Bar chart
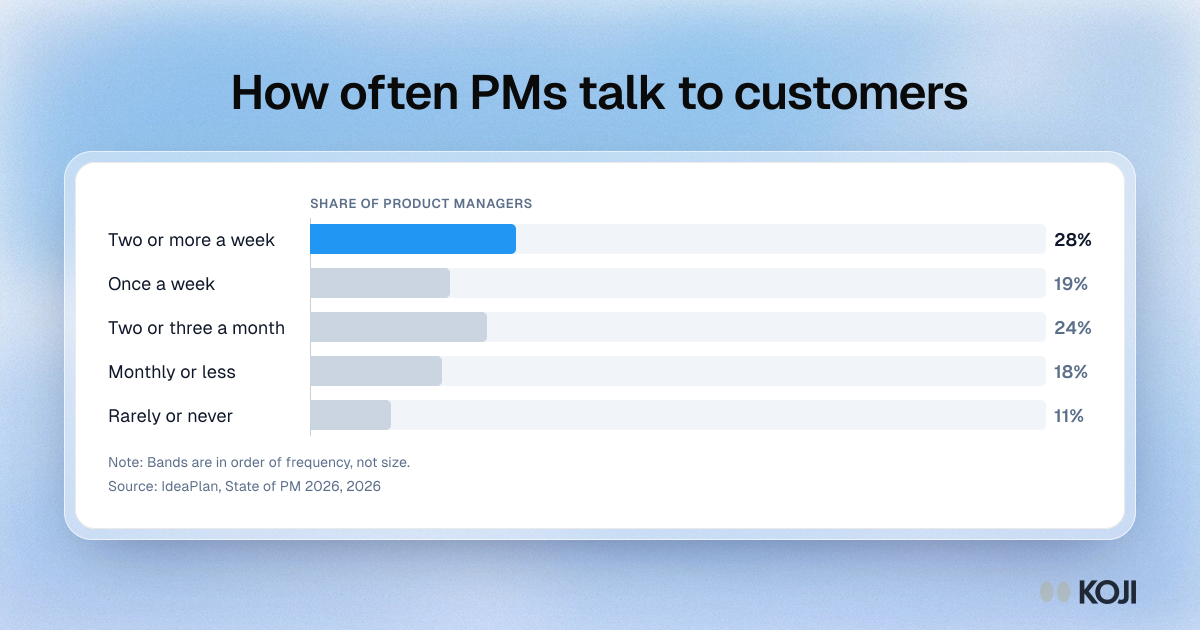
How often PMs talk to customers
Share of product managers by customer conversation frequency, 2026
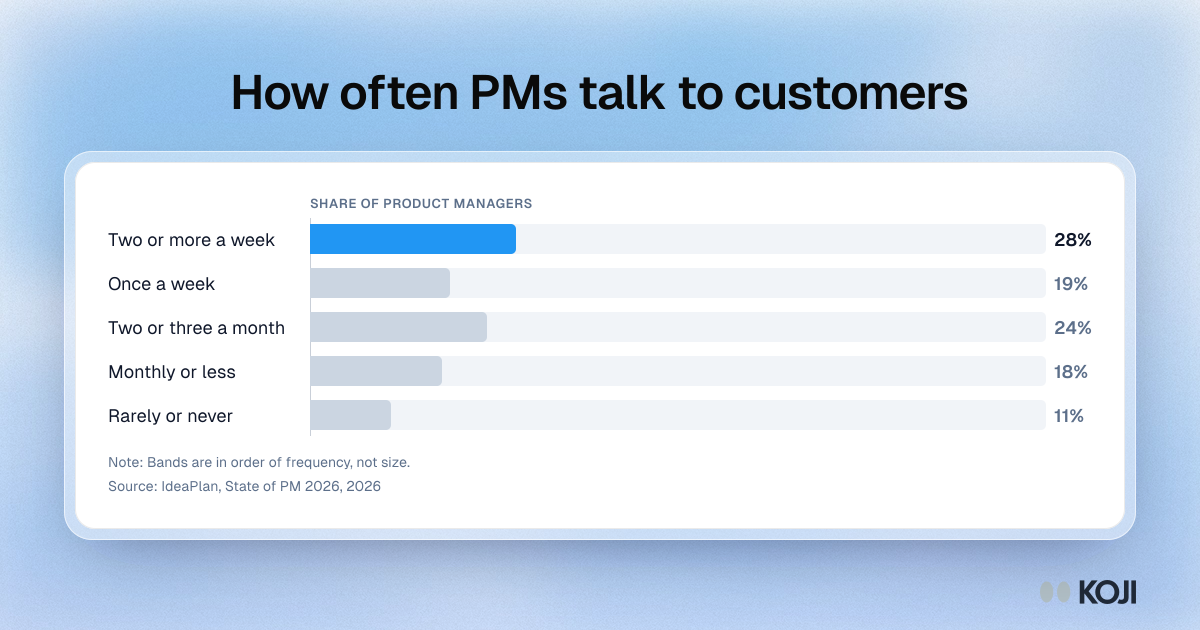
A bar chart of how often product managers say they hold customer conversations, from two or more a week down to rarely or never. It is for PMs and product leaders who want to show why planning runs on stale evidence. The figures come from IdeaPlan's summary of its State of PM 2026 survey. Koji can help close the gap with short AI-moderated interviews before planning.
Where this appears
What's in this bar chart
| Share of PMs | |
|---|---|
| Two or more a week | 28% |
| Once a week | 19% |
| Two or three a month | 24% |
| Monthly or less | 18% |
| Rarely or never | 11% |
Bands are in order of frequency, not size.
Use this image
Free to use in your docs, decks and posts under CC BY 4.0, as long as you credit Koji with a link to this page. To embed it, paste this into your page:
html
<a href="https://www.koji.so/visuals/planning-conversation-frequency-pm-survey"><img src="https://www.koji.so/visuals/planning-conversation-frequency-pm-survey/planning-conversation-frequency-pm-survey.png" alt="Bar chart of how often PMs talk to customers: 28% twice a week or more, 19% weekly, 24% two or three a month, 18% monthly or less, 11% rarely or never." width="1200" height="630" /></a>
<p>Source: <a href="https://www.koji.so/visuals/planning-conversation-frequency-pm-survey">How often PMs talk to customers</a>, Koji</p>