Scatter plot
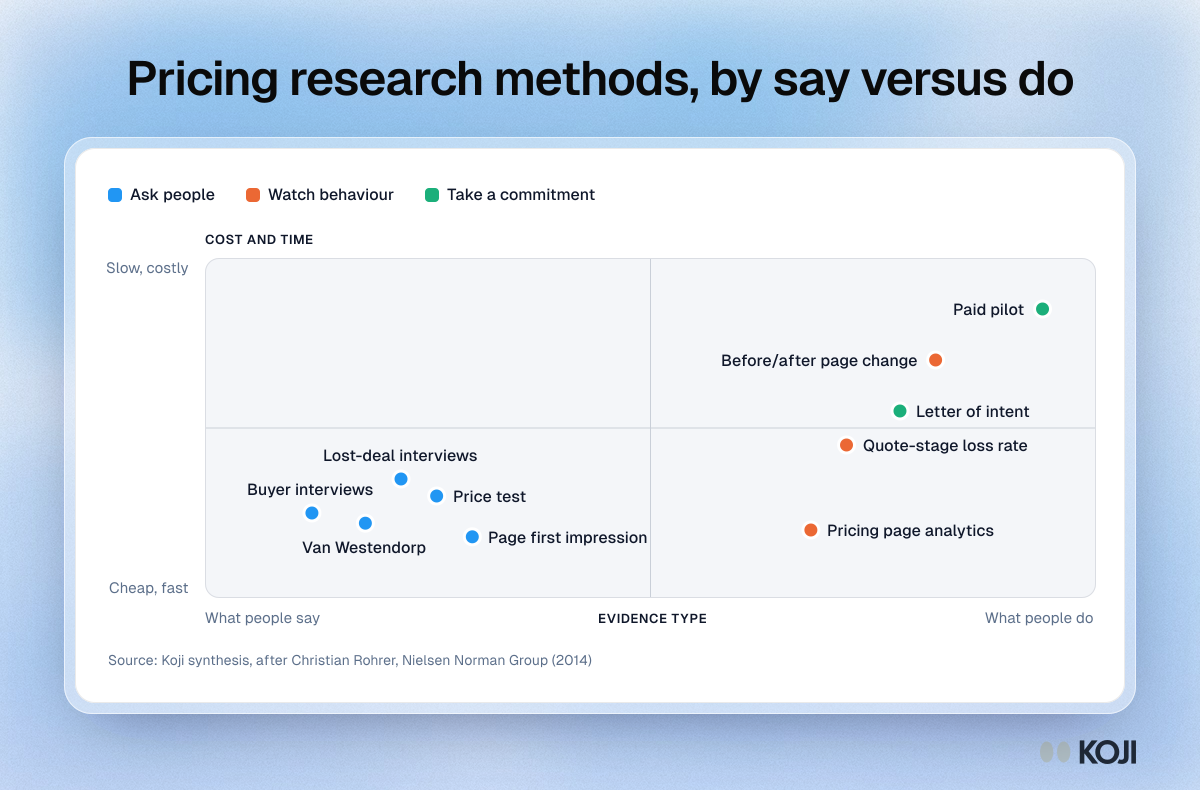
Pricing research methods, by say versus do
Where each way of testing a published price sits
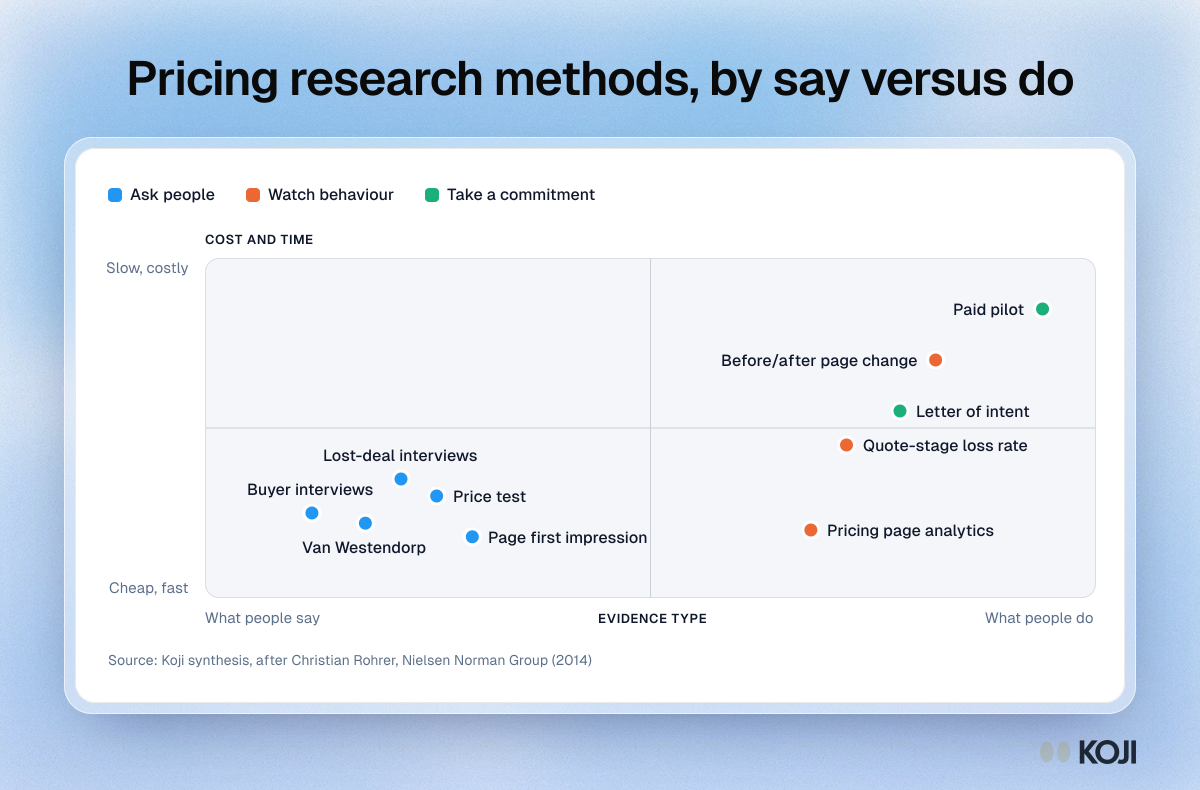
A map of ten ways to test whether to publish a price or keep a contact form. Interviews and price tests sit on the left because they record what buyers say. Page analytics, a before and after comparison, letters of intent and paid pilots sit on the right because they record what buyers do. Use it to pick a cheap first step and a stronger second one. Koji can run the interviews, the price test and the page first impression in one study.
Where this appears
What's in this scatter plot
| Evidence type | Cost and time | Kind | |
|---|---|---|---|
| Buyer interviews | 12 | 25 | Ask people |
| Lost-deal interviews | 22 | 35 | Ask people |
| Price test | 26 | 30 | Ask people |
| Van Westendorp | 18 | 22 | Ask people |
| Page first impression | 30 | 18 | Ask people |
| Pricing page analytics | 68 | 20 | Watch behaviour |
| Quote-stage loss rate | 72 | 45 | Watch behaviour |
| Before/after page change | 82 | 70 | Watch behaviour |
| Letter of intent | 78 | 55 | Take a commitment |
| Paid pilot | 94 | 85 | Take a commitment |
Use this image
Free to use in your docs, decks and posts under CC BY 4.0, as long as you credit Koji with a link to this page. To embed it, paste this into your page:
html
<a href="https://www.koji.so/visuals/pricing-transparency-research-method-map"><img src="https://www.koji.so/visuals/pricing-transparency-research-method-map/pricing-transparency-research-method-map.png" alt="Method map placing ten pricing research methods by what people say versus what they do, and by cost and time, grouped as ask, watch or commit." width="1200" height="790" /></a>
<p>Source: <a href="https://www.koji.so/visuals/pricing-transparency-research-method-map">Pricing research methods, by say versus do</a>, Koji</p>