You are past the first customers, selling to bigger accounts, and someone on the team has asked the question again: do we put a number on the pricing page, or keep "Contact us"? The short answer is that you should not decide it in a meeting. Ask three groups of people (recent buyers, deals you lost, and prospects who stopped at the pricing page), run a price test with each, and let the gap between their answers decide. By the end of this guide you can run that in about two weeks and know whether to publish a price, publish a "from" price or keep the form.
When you need this
You are probably in one of these moments:

Photo by Mario Gogh on Unsplash
- Sales says half the first calls are people who wanted a price and left when they could not find one.
- Sales says the opposite: calls are full of people who saw a number, never saw the value and want a discount.
- You are moving upmarket. Your self-serve tiers have a price, your new Enterprise tier has a form, and nobody remembers why.
- A new CRO, head of growth or board member wants "transparent pricing" because a competitor did it.
- You are about to redesign the pricing page and want the decision made before the design.
Guessing costs you in both directions. Hide a price that buyers expect and you lose the people who never fill in the form. Publish a price that is far below what your largest accounts would pay and you anchor every future negotiation on it.
Here is what buyers say they want. Gartner's 2026 survey of 646 B2B buyers found 67% prefer a rep-free buying experience [1]. The previous Gartner survey of 632 buyers found 61%, and 69% of them reported inconsistencies between what a vendor's website says and what the seller says [2]. TrustRadius's tech buyer survey, as reported by eMarketer, found pricing transparency was the change buyers most wanted from vendors, named by 45% [3].
Read those carefully. They show what buyers prefer, not that publishing a price raises your revenue. I could not find a clean study of that for B2B software, and a vendor blog claiming "3x more signups" without naming its sample is not one. So you test your own buyers.
The method in brief
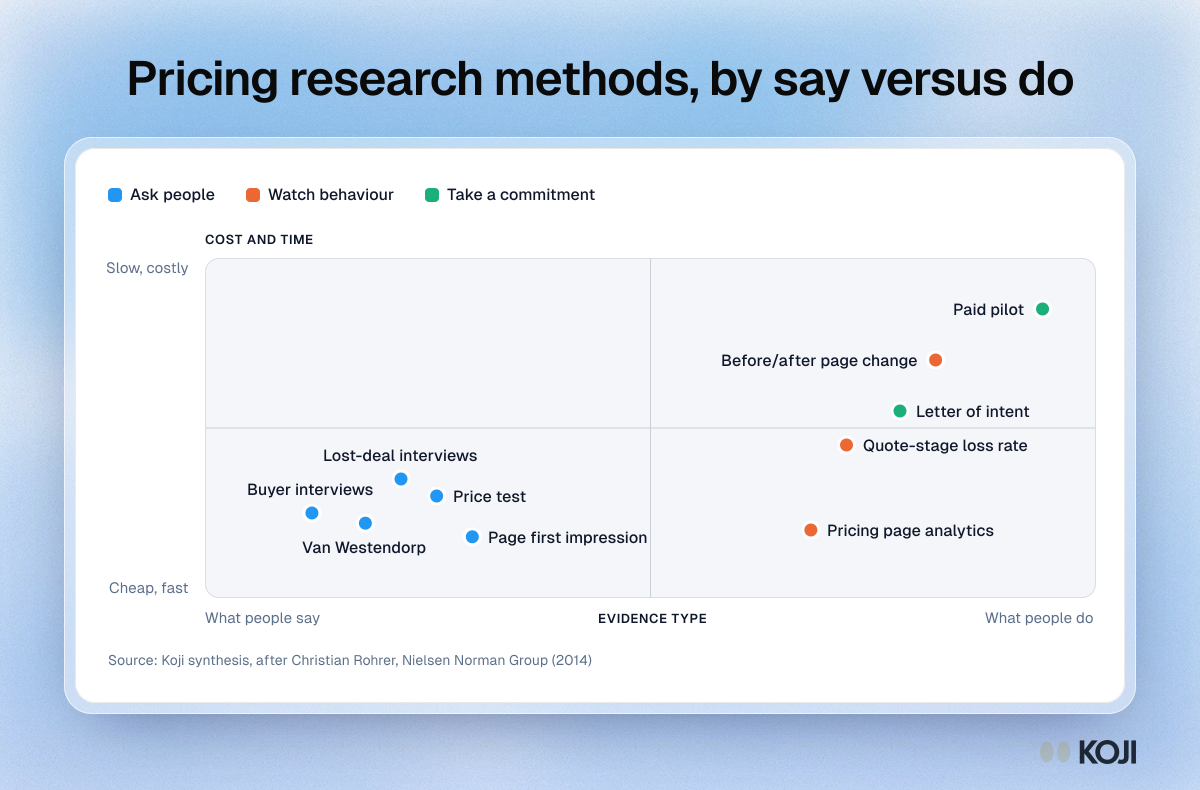
Four kinds of evidence answer this, and they answer different questions. The map below places them on what people say versus what they do [4]:
- Buyer and lost-deal interviews. What did they expect to pay, what did they do on the pricing page, who else had to approve? This is the same discipline as win-loss analysis and the Mom Test: ask about the last time, not what they would do in theory.
- A price test (Gabor-Granger). Each person says how likely they are to buy at one price at a time. You get a demand curve per group and the reasons behind it. How the method works. If you have no idea of the range, Van Westendorp finds it first, and the two are compared in Gabor-Granger vs Van Westendorp.
- A first-impression test of the page itself. Show your current pricing page for a few seconds, then ask what they think it costs and what they would do next. See pricing page research.
- Behaviour. Pricing page analytics, quote-stage drop-off, and an actual change to the page. This is the only evidence that is not self-reported.
Step by step: two weeks, 30 conversations
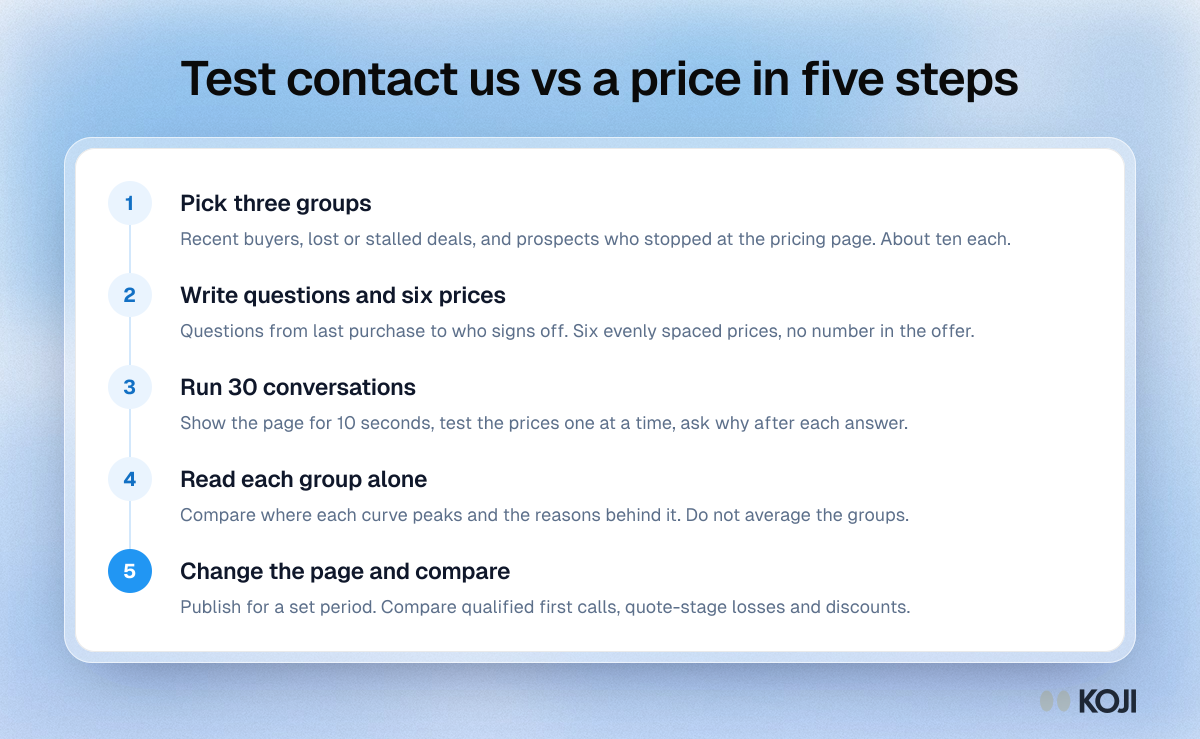
Who. Aim for about 30 people in three groups of roughly ten:
- Recent buyers (won in the last 6 months). They know why they said yes, and what they paid or expected to pay.
- Lost or stalled deals. The most useful group, and the one founders skip. Ask sales for deals that went quiet at the quote stage.
- Pricing-page abandoners. People who reached the form or the pricing page and did not continue. If you cannot identify them, use target accounts who match your ICP and have not spoken to sales.
Within each group, include both the person who uses the product and the person who signs off. They often disagree.
Thirty is a working floor for a directional price curve, not a statistical guarantee. In a well-known saturation study, 100 of 109 themes had appeared by the 12th of 30 interviews with a fairly similar group [5], so ten per group is enough to hear the main reasons. It is not enough to compare small differences between groups. Survey guidance usually asks for 100 or more completes per segment, so treat anything under that as direction [6].
How to find them. Email your CRM lists with a short, honest ask, and offer a small thank-you. Lean on people who already know you before you try strangers. For more on finding people, see how to find 20 people to interview when you have no audience.
What to ask. Keep each conversation under 15 minutes. Start with the last purchase, show the price test late, and ask why after every answer.
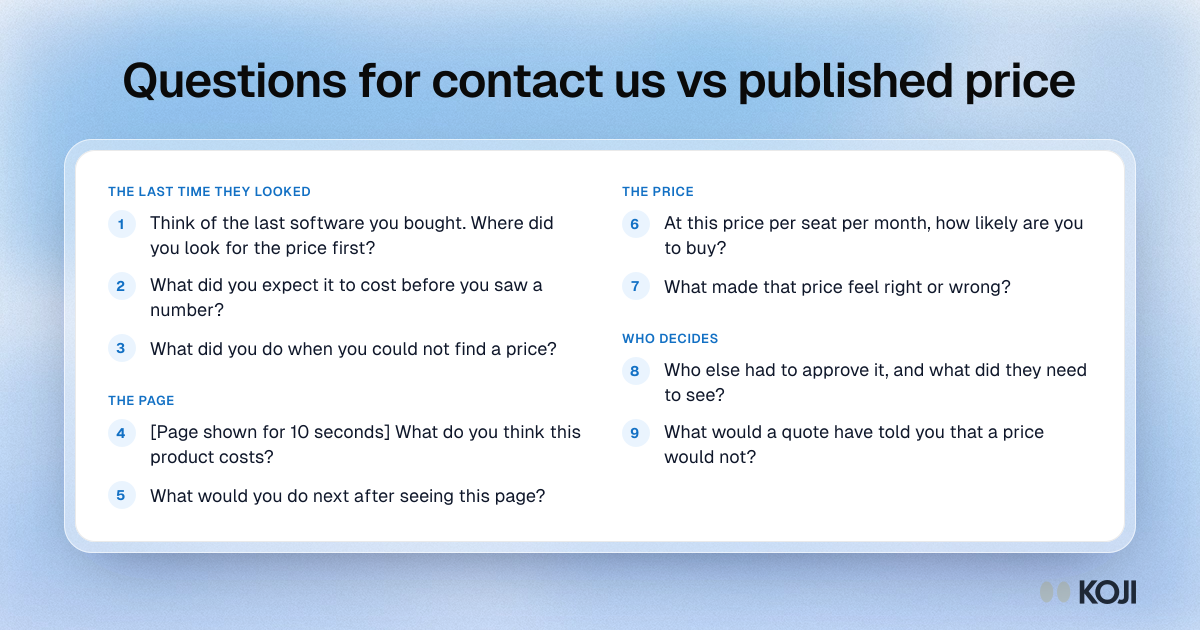
How to run it. Describe what the price buys in a sentence, with no number. Then show prices one at a time, never as a menu. Start different people at different prices so nobody anchors on the cheapest. Ask what they expected the price to be before they saw it. That one answer tells you more about "Contact us" than any survey.
How long it takes. Two days to write the questions and pick prices, five to seven days of conversations, two days to read and decide.
A worked example
Say you are a 40-person company selling project software to construction firms. Your Team plan is self-serve and priced per seat. Your Business tier says "Contact us". Your head of sales wants to hide Team too. Your CEO wants everything public.
You run 31 conversations: 11 recent buyers, 10 lost or stalled deals, 10 target accounts. You test six prices per seat per month: $29, $49, $79, $119, $179 and $249. The numbers below are made up to show how to read a result. They are not data from a real study.
Before they saw any number, 8 of the 10 lost-deal contacts said they assumed it would cost "a lot" and never asked for a quote. Two of them said a competitor's visible price made it onto their shortlist first. That is a finding about the page, not about the price.
Then the price test, split by firm size:
| Price per seat per month | Firms under 50 staff would buy | Revenue per person asked | Firms over 200 staff would buy | Revenue per person asked |
|---|---|---|---|---|
| $29 | 92% | $27 | 98% | $28 |
| $49 | 84% | $41 | 97% | $48 |
| $79 | 55% | $43 | 92% | $73 |
| $119 | 24% | $29 | 81% | $96 |
| $179 | 9% | $16 | 63% | $113 |
| $249 | 3% | $7 | 38% | $95 |
Revenue per person asked is the price times the share. For small firms the peak is $79, with $49 about 5% behind. For large firms the peak is $179, and the reasons are different: they ask about single sign-on, audit logs and a security review, and they say the cost is "a rounding error against the project". The two peaks are more than twice apart.
So the decision is not "public or hidden". It is: publish the small-firm tiers with a price, because they compare and buy alone, and publish "from $179 per seat, with SSO and audit logs" for the large tier, with a form for the rest. You keep the conversation where it earns its keep and remove the guessing where it does not.
Reading the results and deciding
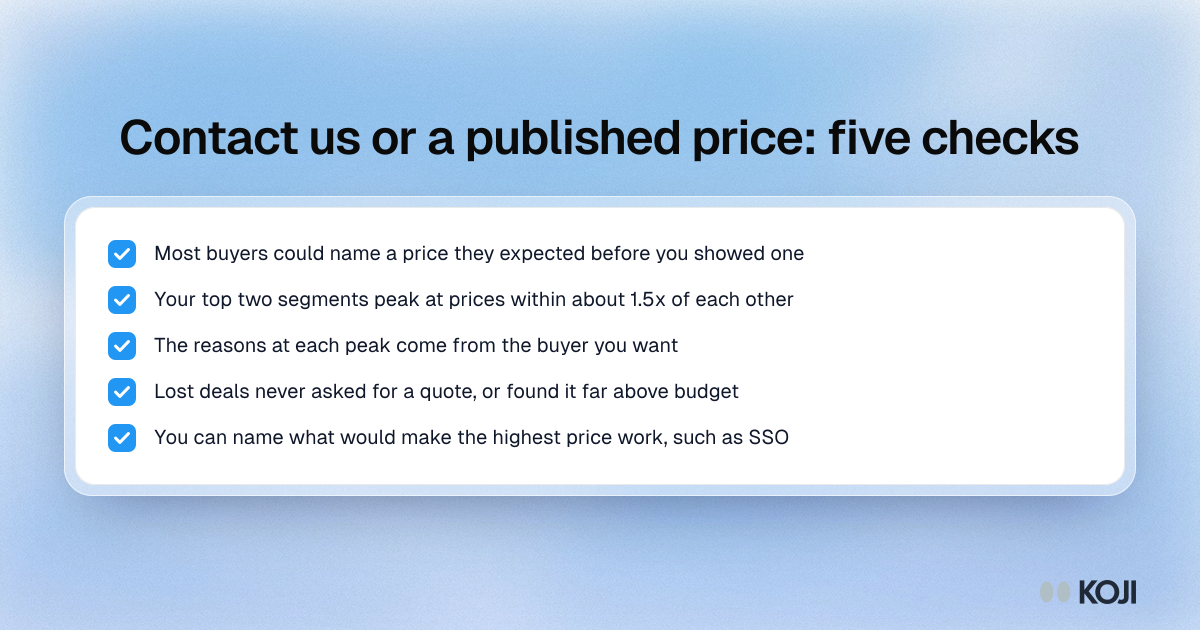
Treat the curve as a ceiling. A meta-analysis of 77 studies found stated willingness to pay was about 21% higher, on average, than real payment [7]. These are rules of thumb from running this kind of test, not published thresholds. Check each one against your results:
- Most buyers could name a price they expected before you showed one.
- Your top two segments peak at prices within about 1.5x of each other.
- The reasons at each peak come from the buyer you want, not from tire-kickers.
- Lost deals say they never asked for a quote, or asked and found it far above budget.
- You can name what would make the highest price work, such as SSO or support.
What to do for each outcome:
- Peaks within about 1.5x across your segments, and buyers expected a price. Publish it. The form is costing you shortlist spots.
- Peaks more than 2x apart. Publish the low tiers and a "from" price for the high one. This is the usual shape for a company moving upmarket.
- Buyers say they could not guess the price, and large accounts negotiate anyway. Keep the form, but publish what drives the price (seats, usage, modules) so nobody guesses "a lot".
- Lost deals blame price, but their stated reasons are about value or trust. The price is not the problem. See why "price" is never the real churn reason.
- Everyone is unsure. Run 10 more conversations in the group that disagrees.
Companies do change this over time. PostHog wrote in 2022 that it was extending transparent pricing to its Enterprise plan, with Cloud Enterprise set at roughly 1.3 times its Cloud pricing, while customers could still contact sales [8]. That is one company's choice, and it fits a product with usage-based pricing and developer buyers. Do not copy it because it is famous. Test whether your buyers look like theirs.
Run it this week with Koji
You can do all of this with a spreadsheet and a calendar. Koji removes the scheduling, the walk up and down the prices and the maths. You can set up each of these yourself from a free account.
- Start a study and describe the goal ("should we publish a price for our Team and Business tiers?"). The research assistant can build it, or you add questions yourself.
- Add an image question for the pricing page. Attach a screenshot of your current page to a question, set it to show once for 10 seconds, and ask what they think it costs and what they would do next. Koji knows what the image shows, so its follow-ups are about the page. This works in text and voice interviews, not phone calls.
- Add the context questions from the bank above: the last time they looked at pricing, what they expected, who signs off.
- Add a Price Test question. The question text names the product and what the price buys, not a price. Enter 3 to 10 prices (five to seven, evenly spaced, works best), the currency and a unit such as "per seat per month". The default counts "Probably would buy" or higher as a buy.
- Invite each group separately. Import your CRM list for personal interview links, or email them from Koji, and offer a gift card as a thank-you. Duplicate the study for each group, so you read each curve on its own.
- Read each report. It shows the share who would buy at each price, the revenue each implies and the price that earns the most, with the quotes behind each point. Download it as slides or a PDF to take to your CEO, your head of sales or your board.
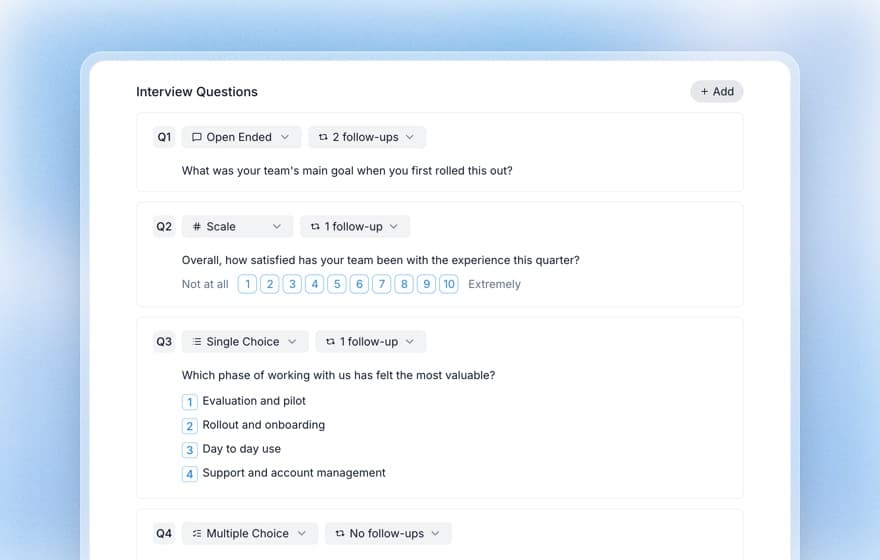
Each person starts at a random price in the middle of your list, and Koji moves up or down until it finds the highest price they would still buy at, usually in about three steps. Then the interviewer asks why. The price test reads best from about 30 interviews, and prices lock once responses come in, so check them first. The report is labelled directional on purpose: the best price is always one of the prices you tested.
Common mistakes
- Only asking won deals. They have already said yes. The lost and stalled group is where "Contact us" costs you.
- Putting a number on the page before you know the segments. One public price for a 10-seat team and a 2,000-seat account is two decisions.
- Asking "what would you pay?" People round down. Show prices.
- Testing the form but not the page. Buyers decide in seconds whether to continue. Show it to them.
- Treating one competitor as proof. What works for a usage-priced developer tool may not work for your buyers.
- Skipping the follow-through. A curve that nobody checks against real behaviour is an opinion.
When research will mislead you
- Stated prices run about a fifth high [7], and more for expensive or specialist products.
- Thirty people is directional. If you need to compare two segments with confidence, you need far more [6].
- Buyers in interviews are not buyers in a procurement cycle. The person you interview may not hold the budget.
- Interviews cannot tell you what happens to your pipeline. Pair the result with a real change: publish the new page for a defined period, and compare the share of qualified first calls, the quote-stage loss rate and the average discount before and after. Ask two or three large accounts for a letter of intent at the "from" price.
Where this fits
Pricing for a scaleup sits between knowing who your next customer is and proving the change worked. Before this, price your first product with 30 customer conversations covers the first number. The whole sequence is in the founder's research playbook, and Koji for founders shows how teams run it. Related reading: pricing research without the consultant and pricing survey questions.
FAQ
Should B2B SaaS publish its price? It depends on who buys. Buyers say they prefer to research without a rep [1][2], but a custom enterprise deal may not have a single price. Test your own buyers and publish what you can: a price for self-serve tiers, a "from" price or the drivers of the price for the rest.
How many buyers do I need to talk to? About 30, in three groups of ten, gives a directional curve and the main reasons. For firm numbers or to compare segments, aim for 100 or more per segment [6].
What is a "from" price? A starting price with the thing that drives it ("from $179 per seat with SSO"). It tells buyers the order of magnitude without committing you to a quote.
Can I trust what buyers say they would pay? Partly. A meta-analysis found stated willingness to pay about 21% above real payment on average [7]. Confirm with a change to the page and a letter of intent.
Do I need an A/B test? No, and at most scaleups there is not enough pricing-page traffic for one. A before-and-after comparison over a few weeks, with the same metrics, is usually what you can run.
Next step: pick the three groups, write your six prices, then start a free study and run the first ten conversations this week.
References
- Gartner, "Gartner Sales Survey Finds 67% of B2B Buyers Prefer a Rep-Free Experience" (646 buyers, surveyed August to September 2025), press release, 9 March 2026. gartner.com
- Gartner, "Gartner Sales Survey Finds 61% of B2B Buyers Prefer a Rep-Free Buying Experience" (632 buyers, surveyed August to September 2024), press release, 25 June 2025. gartner.com
- TrustRadius, tech buyer survey, reported by eMarketer, "B2B tech buyers crave pricing transparency", 2025. emarketer.com
- Christian Rohrer, "When to Use Which User-Experience Research Methods", Nielsen Norman Group, 2014. nngroup.com
- Guest, Bunce and Johnson, "How Many Interviews Are Enough? An Experiment with Data Saturation and Variability", Field Methods 18(1), 2006. ALNAP library
- SurveyMonkey, "The Gabor-Granger method: how to build the survey and calculate the demand curve". surveymonkey.com
- Schmidt and Bijmolt, "Accurately measuring willingness to pay for consumer goods: a meta-analysis of the hypothetical bias", Journal of the Academy of Marketing Science 48(3), 2020. marketingcenter.de
- Simon Fisher, "Why we ditched 'talk to sales' for transparent pricing", PostHog blog, 2022. posthog.com
Further reading
- Gabor-Granger pricing method: the method behind the price test, with the maths.
- Pricing page research: how to test the page itself, not only the number.
- Win-loss analysis: how to interview the deals you lost.
- Kyle Poyar, Growth Unhinged: the annual survey of how B2B companies price.