Comparison
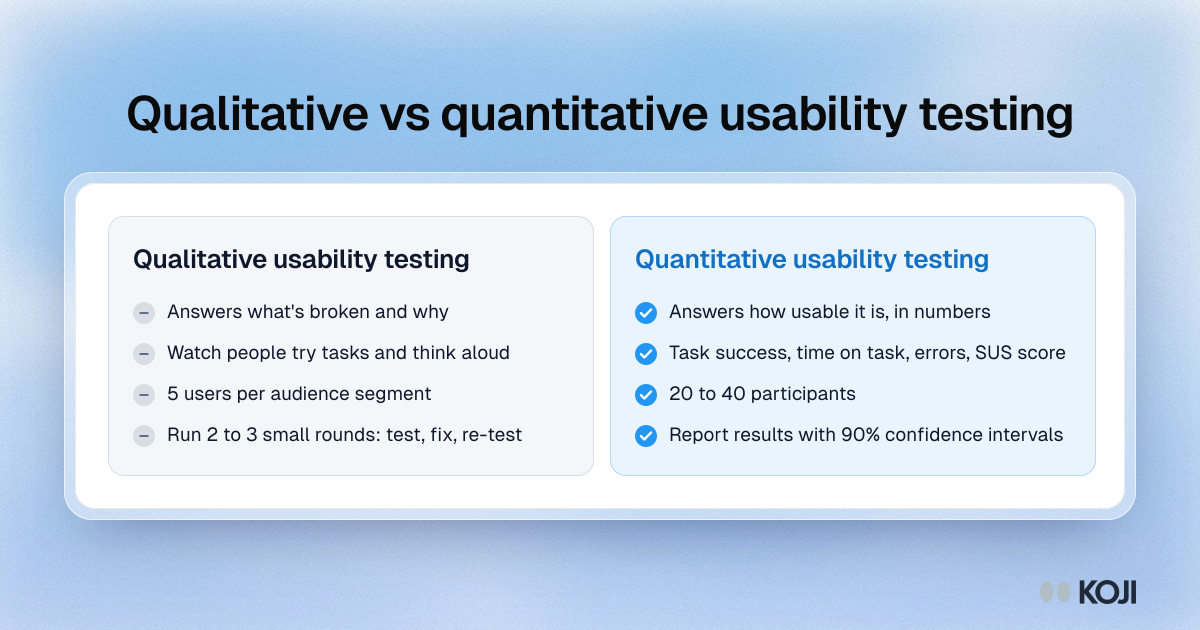
Qualitative vs quantitative usability testing
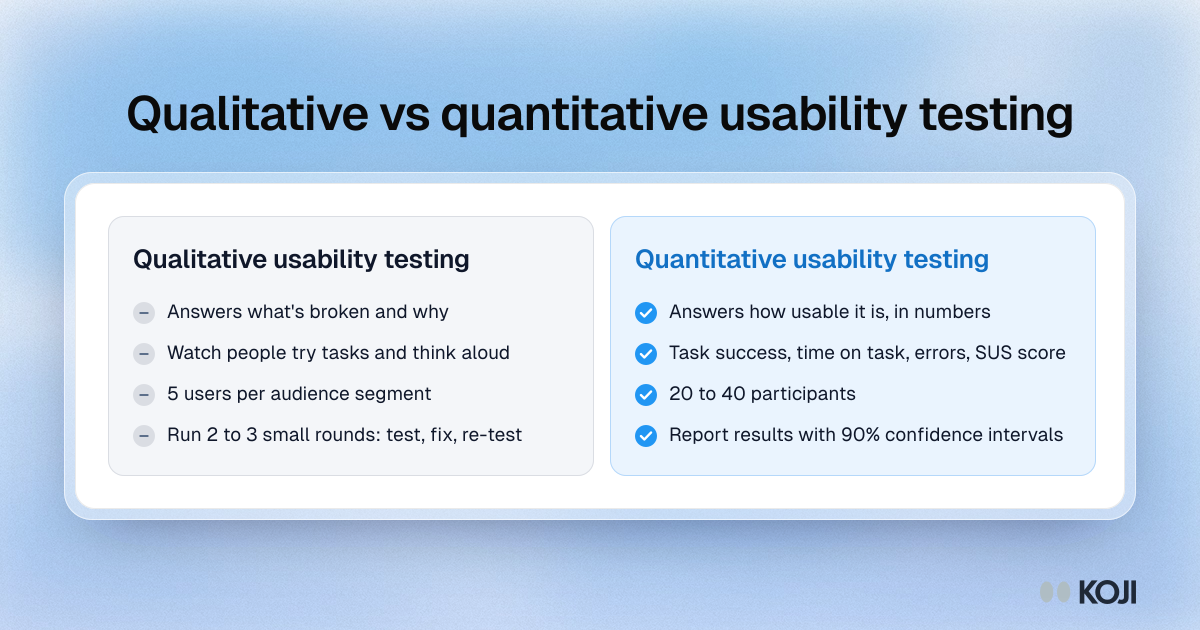
Sets qualitative usability testing (finding what's broken and why, with about 5 users per segment) against quantitative testing (measuring task success, time on task or SUS, with 20 to 40 participants). Use it to size a usability study by its goal. The 5-user figure comes from Jakob Nielsen and Thomas Landauer's problem discovery model.
Where this appears
What's in this comparison
Qualitative usability testing
- Answers what's broken and why
- Watch people try tasks and think aloud
- 5 users per audience segment
- Run 2 to 3 small rounds: test, fix, re-test
Quantitative usability testing
- Answers how usable it is, in numbers
- Task success, time on task, errors, SUS score
- 20 to 40 participants
- Report results with 90% confidence intervals
Use this image
Free to use in your docs, decks and posts under CC BY 4.0, as long as you credit Koji with a link to this page. To embed it, paste this into your page:
html
<a href="https://www.koji.so/visuals/qualitative-vs-quantitative-usability-testing-sample-size"><img src="https://www.koji.so/visuals/qualitative-vs-quantitative-usability-testing-sample-size/qualitative-vs-quantitative-usability-testing-sample-size.png" alt="Comparison of qualitative and quantitative usability testing: 5 users per segment to find problems, 20 to 40 to measure them." width="1200" height="630" /></a>
<p>Source: <a href="https://www.koji.so/visuals/qualitative-vs-quantitative-usability-testing-sample-size">Qualitative vs quantitative usability testing</a>, Koji</p>