Bar chart
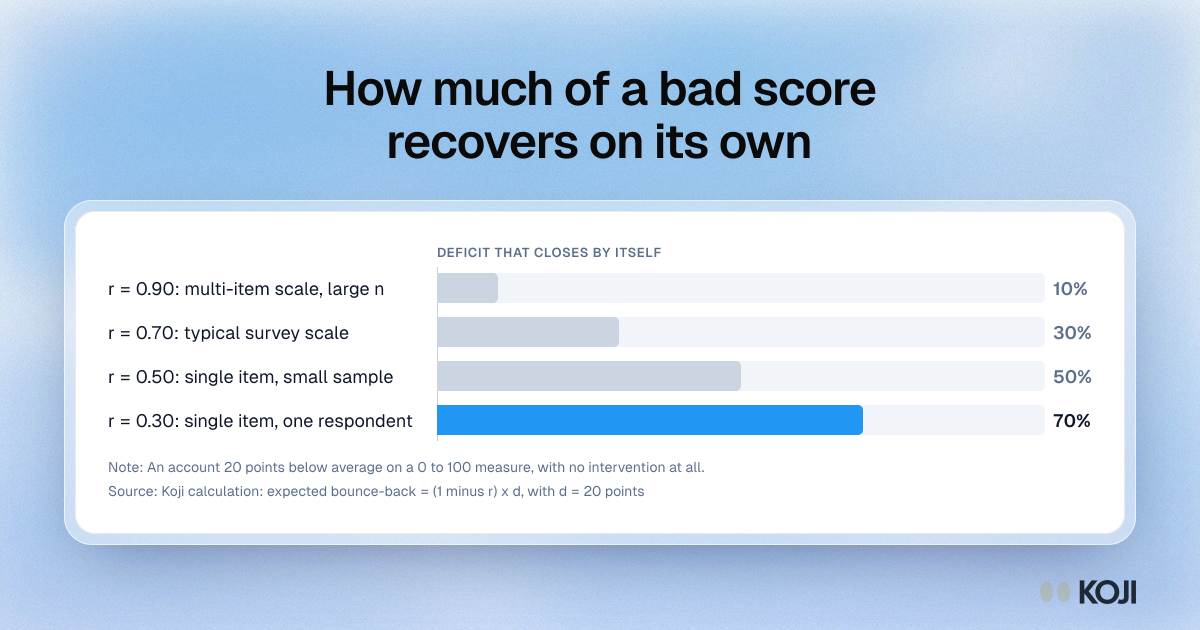
How much of a bad score recovers on its own
Expected bounce-back by test-retest reliability of the metric
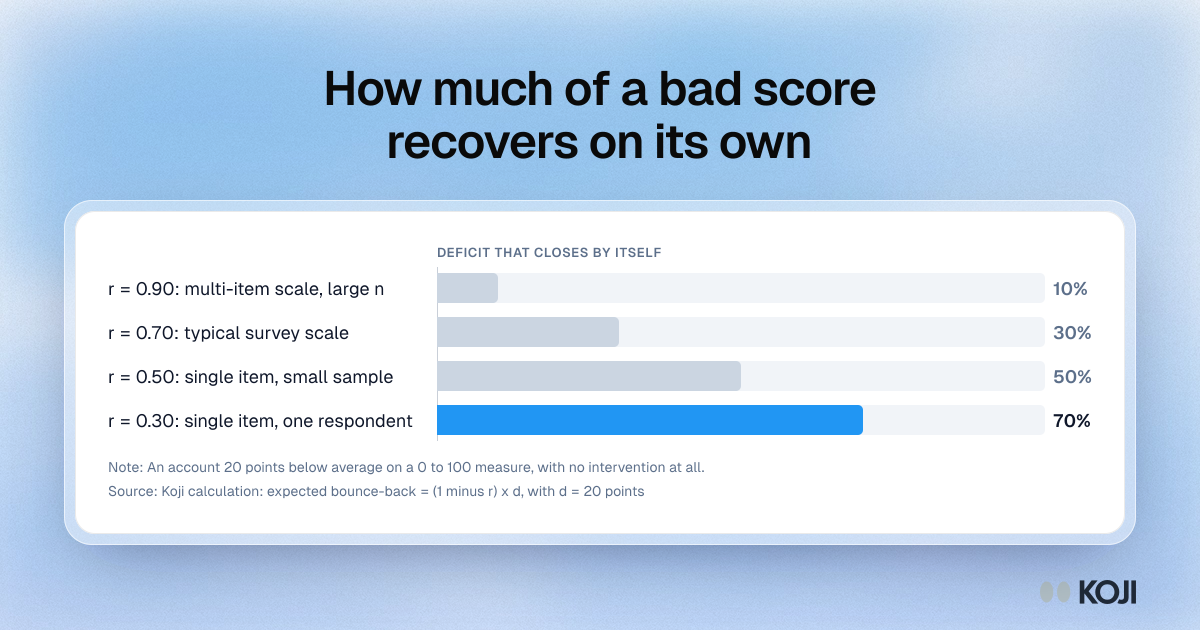
Regression to the mean in numbers. For an account 20 points below average on a 0 to 100 measure, the expected improvement with no intervention is (1 minus r) times the gap, where r is the metric's test-retest reliability. A well-built multi-item scale at 0.90 recovers 2 points, or 10 percent of the gap. A single-item score from one respondent at 0.30 recovers 14 points, or 70 percent. Use it before you credit a rescue programme or a product fix with a rebound.
Where this appears
What's in this bar chart
| Share that closes by itself | |
|---|---|
| r = 0.90: multi-item scale, large n | 10% |
| r = 0.70: typical survey scale | 30% |
| r = 0.50: single item, small sample | 50% |
| r = 0.30: single item, one respondent | 70% |
An account 20 points below average on a 0 to 100 measure, with no intervention at all.
Use this image
Free to use in your docs, decks and posts under CC BY 4.0, as long as you credit Koji with a link to this page. To embed it, paste this into your page:
<a href="https://www.koji.so/visuals/regression-to-the-mean-bounce-back-by-reliability"><img src="https://www.koji.so/visuals/regression-to-the-mean-bounce-back-by-reliability/regression-to-the-mean-bounce-back-by-reliability.png" alt="Bar chart of how much of a 20-point deficit closes with no intervention: 10% at reliability 0.90, 30% at 0.70, 50% at 0.50 and 70% at 0.30" width="1200" height="630" /></a>
<p>Source: <a href="https://www.koji.so/visuals/regression-to-the-mean-bounce-back-by-reliability">How much of a bad score recovers on its own</a>, Koji</p>