Bar chart
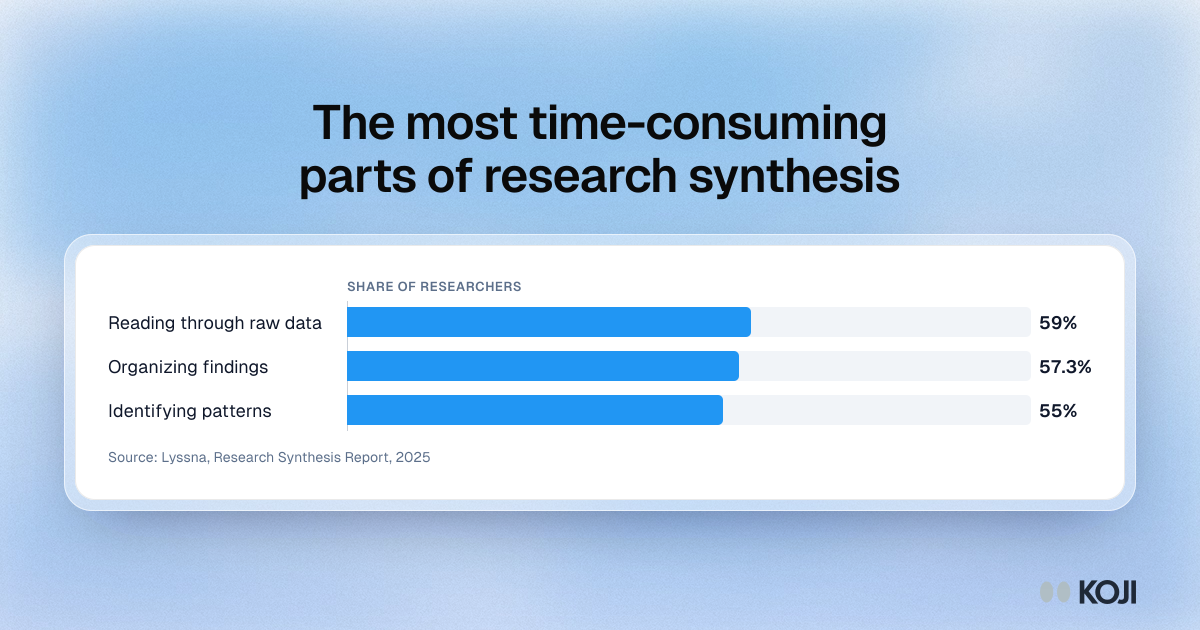
The most time-consuming parts of research synthesis
Share of researchers who named each task, Lyssna 2025
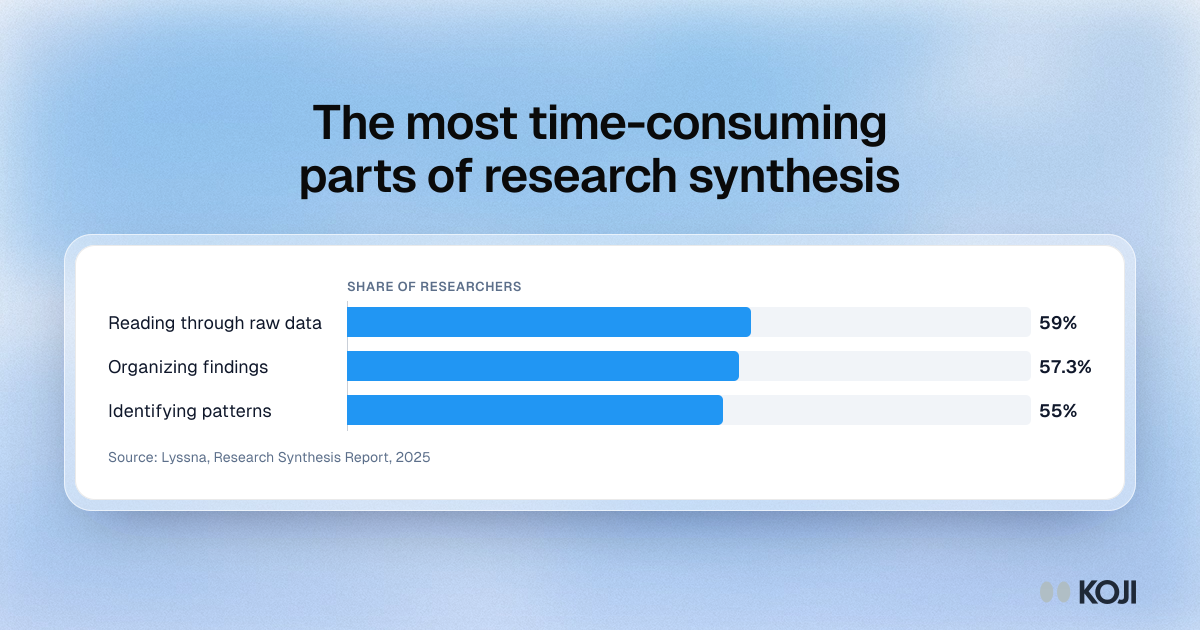
A bar chart from Lyssna's Research Synthesis Report 2025 showing which synthesis tasks researchers find most time-consuming: reading through raw data, organizing findings and identifying patterns. It helps research leads explain where analysis hours go when they build a budget or argue for help with synthesis. Koji takes on the first two by transcribing interviews and grouping answers into themes with supporting quotes as responses arrive.
Where this appears
What's in this bar chart
| Share of researchers | |
|---|---|
| Reading through raw data | 59% |
| Organizing findings | 57.3% |
| Identifying patterns | 55% |
Use this image
Free to use in your docs, decks and posts under CC BY 4.0, as long as you credit Koji with a link to this page. To embed it, paste this into your page:
html
<a href="https://www.koji.so/visuals/research-synthesis-most-time-consuming-tasks-2025"><img src="https://www.koji.so/visuals/research-synthesis-most-time-consuming-tasks-2025/research-synthesis-most-time-consuming-tasks-2025.png" alt="Bar chart of the most time-consuming synthesis tasks: reading through raw data cited by 59% of researchers, organizing findings 57.3%, identifying patterns 55%." width="1200" height="630" /></a>
<p>Source: <a href="https://www.koji.so/visuals/research-synthesis-most-time-consuming-tasks-2025">The most time-consuming parts of research synthesis</a>, Koji</p>