Framework
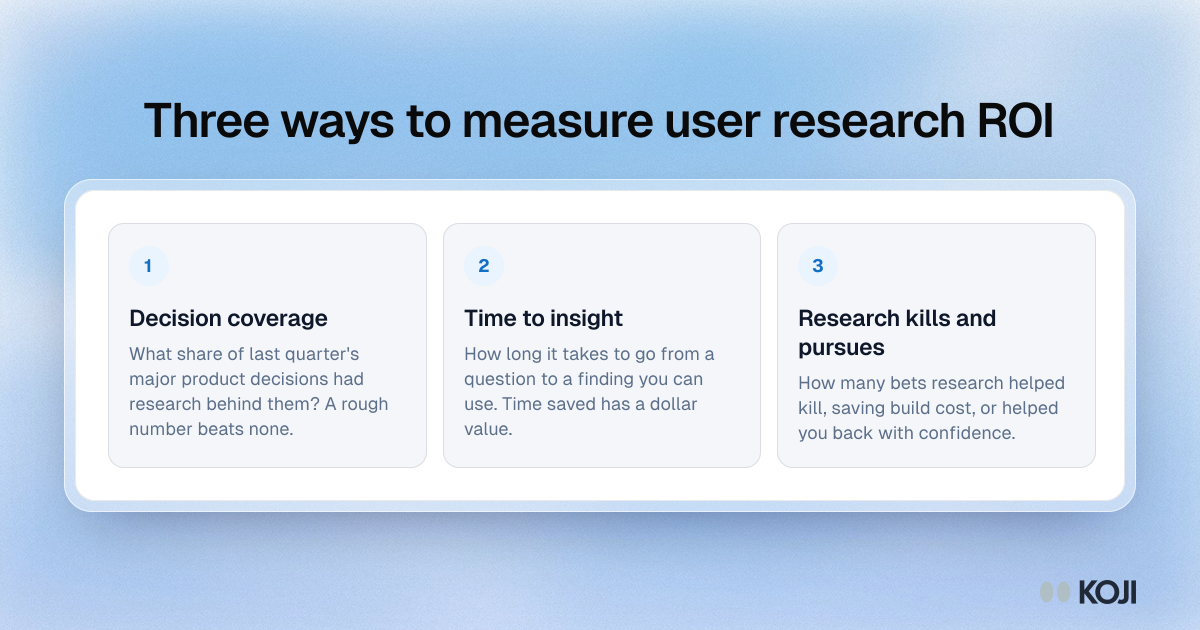
Three ways to measure user research ROI
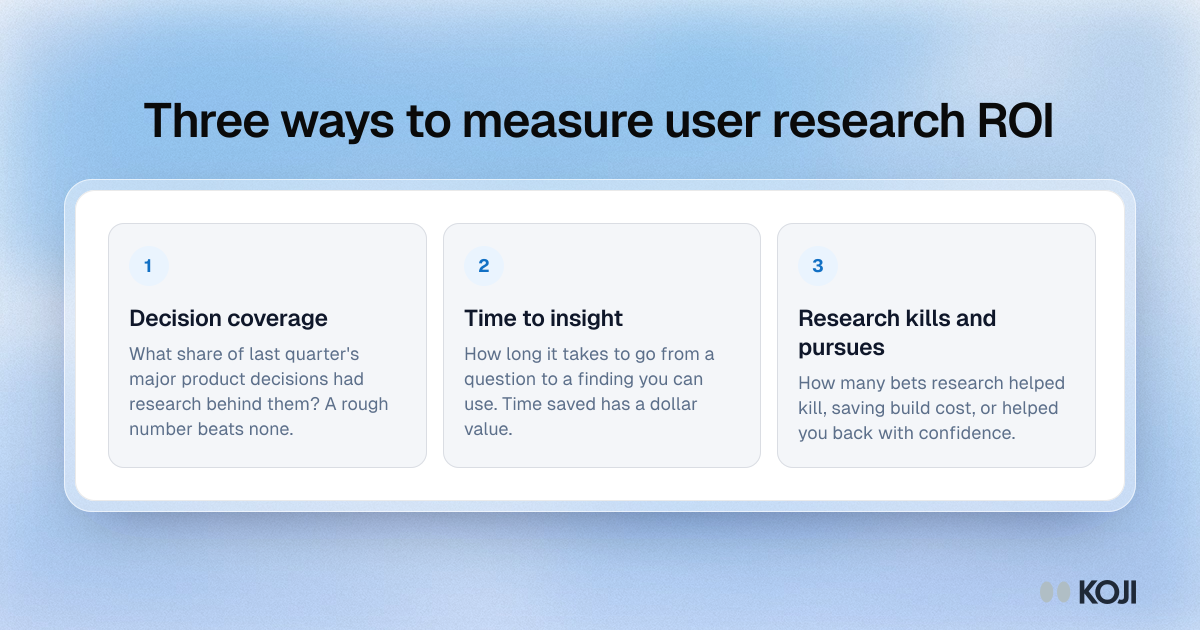
Three leading indicators a research team can track to show its return: how many major decisions had research behind them, how fast a question turns into a usable finding, and how many product bets research helped stop or back. Tie them to outcomes like churn and activation to defend the budget. Koji helps most with the second one, since AI-moderated interviews and automatic analysis cut the time from question to finding.
Where this appears
What's in this framework
- Decision coverage: What share of last quarter's major product decisions had research behind them? A rough number beats none.
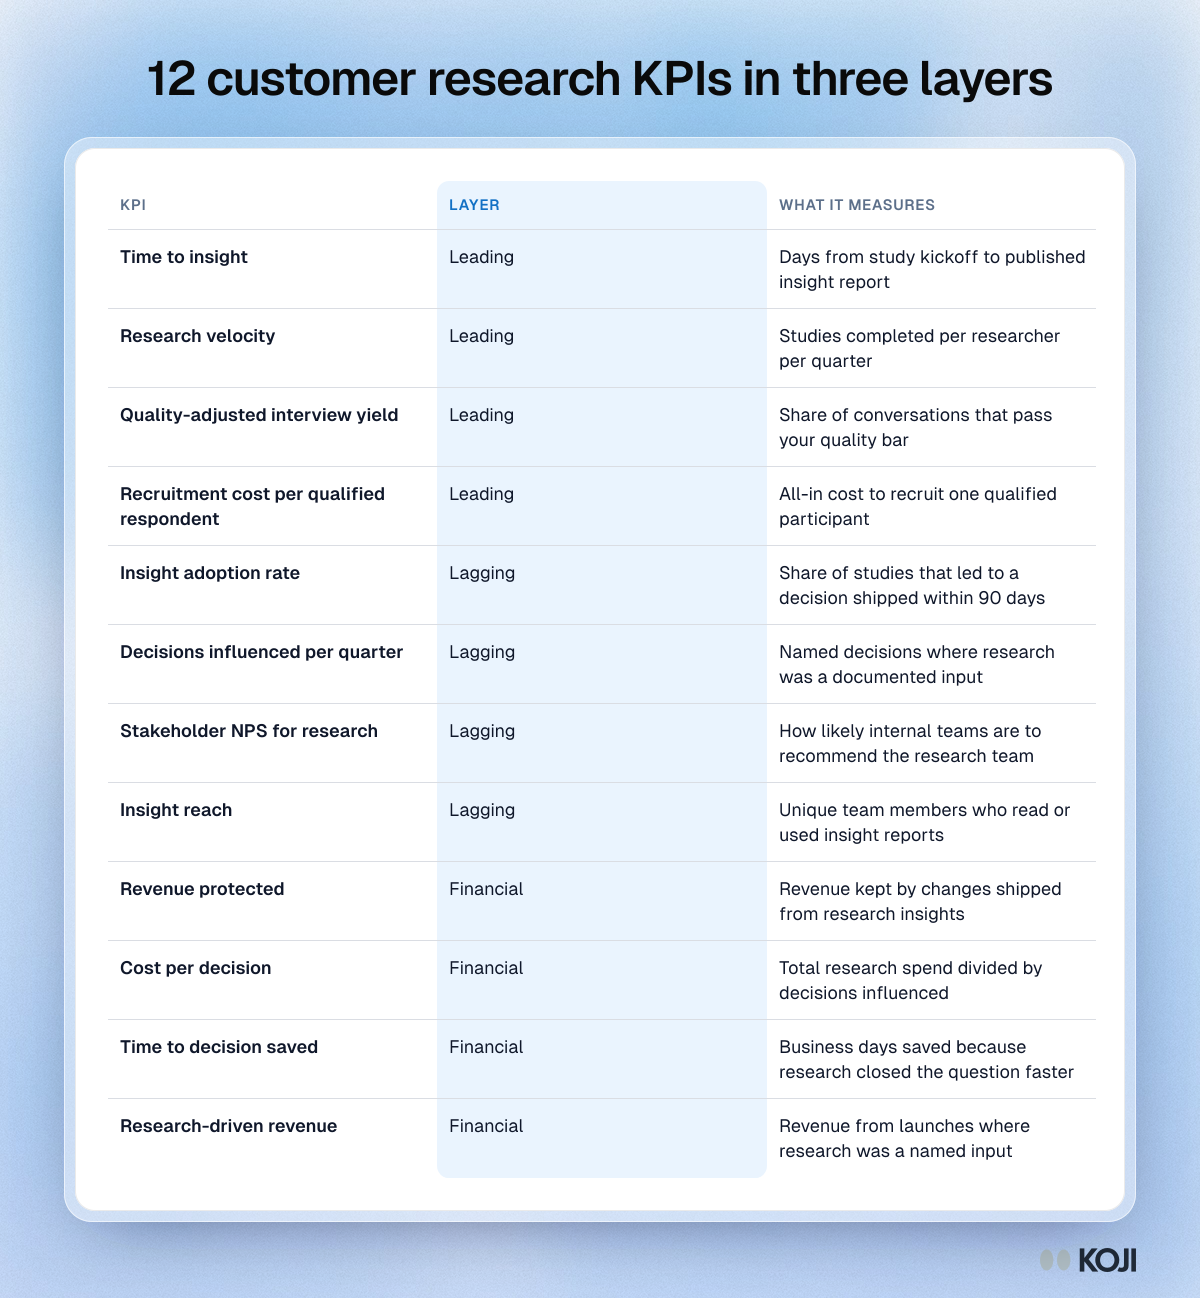
- Time to insight: How long it takes to go from a question to a finding you can use. Time saved has a dollar value.
- Research kills and pursues: How many bets research helped kill, saving build cost, or helped you back with confidence.
Use this image
Free to use in your docs, decks and posts under CC BY 4.0, as long as you credit Koji with a link to this page. To embed it, paste this into your page:
html
<a href="https://www.koji.so/visuals/user-research-roi-three-leading-indicators"><img src="https://www.koji.so/visuals/user-research-roi-three-leading-indicators/user-research-roi-three-leading-indicators.png" alt="Framework of three leading indicators for user research ROI: decision coverage, time to insight, and the product bets research helped kill or pursue." width="1200" height="630" /></a>
<p>Source: <a href="https://www.koji.so/visuals/user-research-roi-three-leading-indicators">Three ways to measure user research ROI</a>, Koji</p>