Bar chart
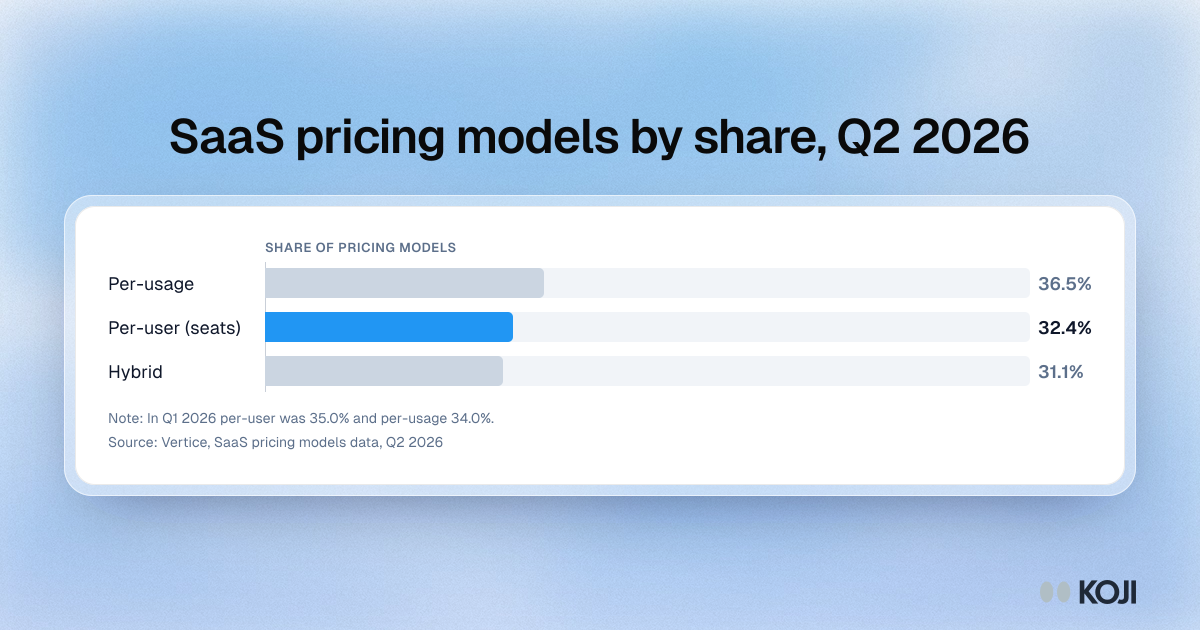
SaaS pricing models by share, Q2 2026
Per-usage pricing passed per-user pricing in Vertice purchasing data in the second quarter of 2026.
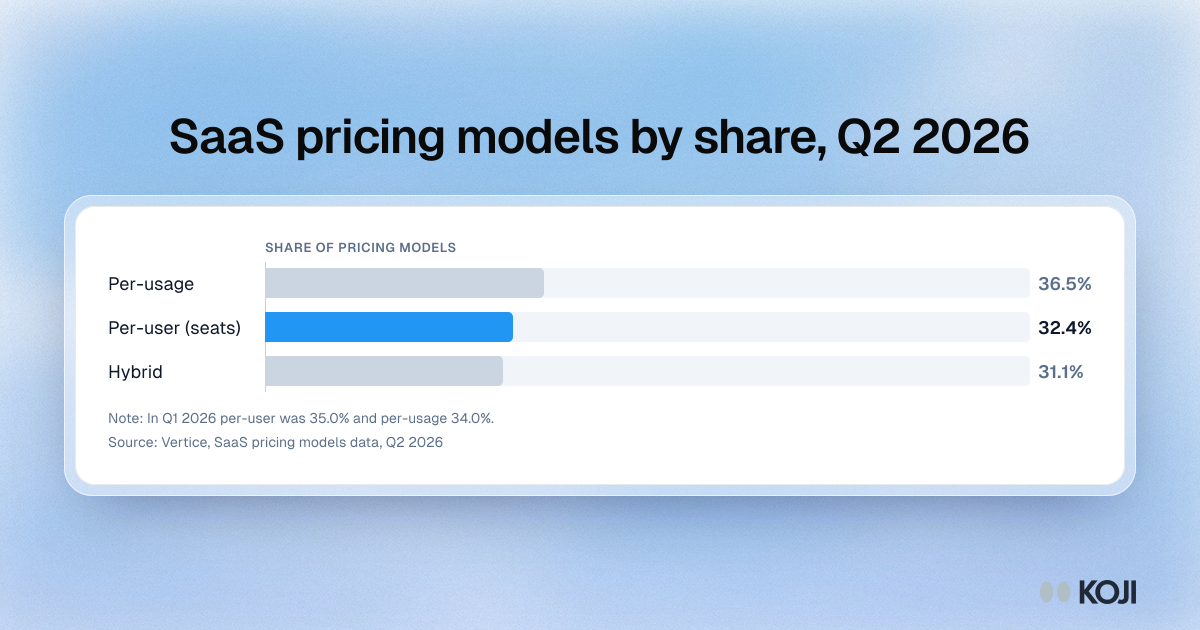
A bar chart of how SaaS was priced in Q2 2026 in Vertice purchasing data: per-usage 36.5%, per-user (seats) 32.4% and hybrid 31.1%, with per-user down from 35.0% in Q1. It is for customer success and revenue teams planning renewals as customers move work to AI. Koji helps teams interview accounts before the seat count changes.
Where this appears
What's in this bar chart
| Share in Vertice data | |
|---|---|
| Per-usage | 36.5% |
| Per-user (seats) | 32.4% |
| Hybrid | 31.1% |
In Q1 2026 per-user was 35.0% and per-usage 34.0%.
Use this image
Free to use in your docs, decks and posts under CC BY 4.0, as long as you credit Koji with a link to this page. To embed it, paste this into your page:
html
<a href="https://www.koji.so/visuals/saas-pricing-models-share-q2-2026"><img src="https://www.koji.so/visuals/saas-pricing-models-share-q2-2026/saas-pricing-models-share-q2-2026.png" alt="Bar chart of SaaS pricing models by share in Q2 2026: per-usage 36.5%, per-user 32.4%, hybrid 31.1%." width="1200" height="630" /></a>
<p>Source: <a href="https://www.koji.so/visuals/saas-pricing-models-share-q2-2026">SaaS pricing models by share, Q2 2026</a>, Koji</p>