Column chart
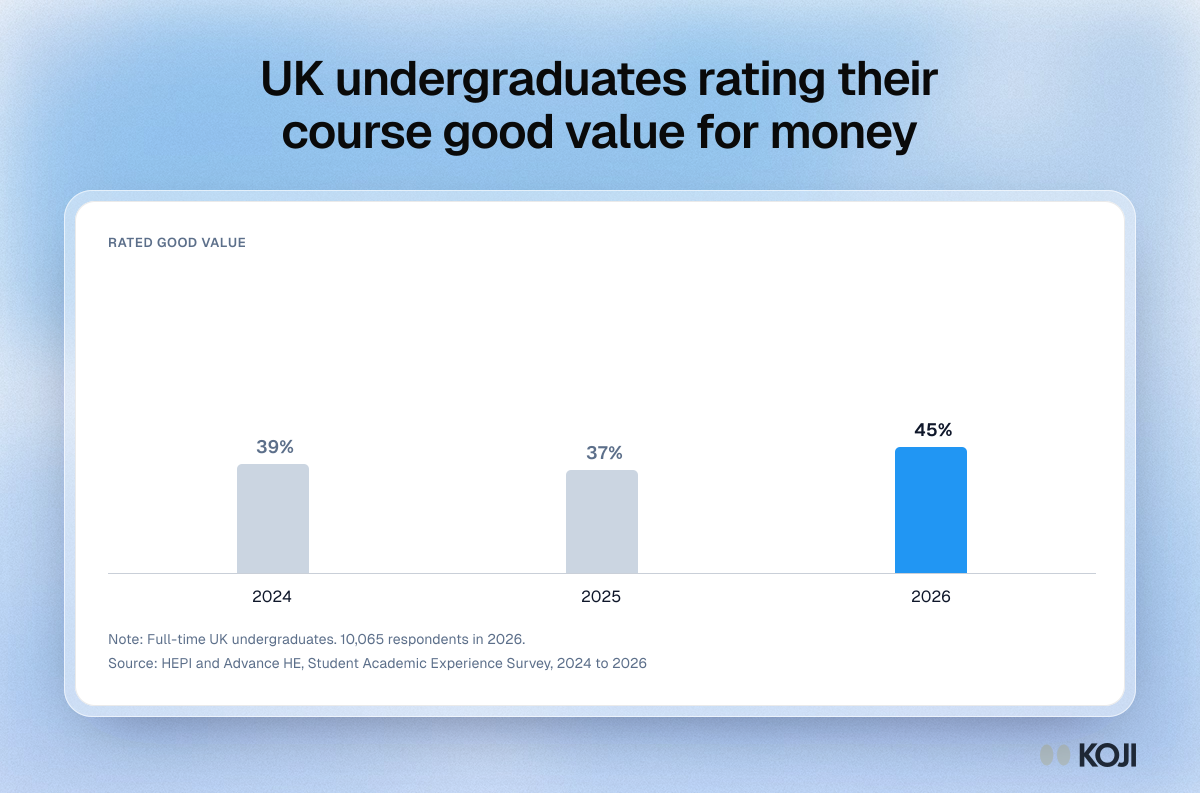
UK undergraduates rating their course good value for money
Student Academic Experience Survey, 2024 to 2026
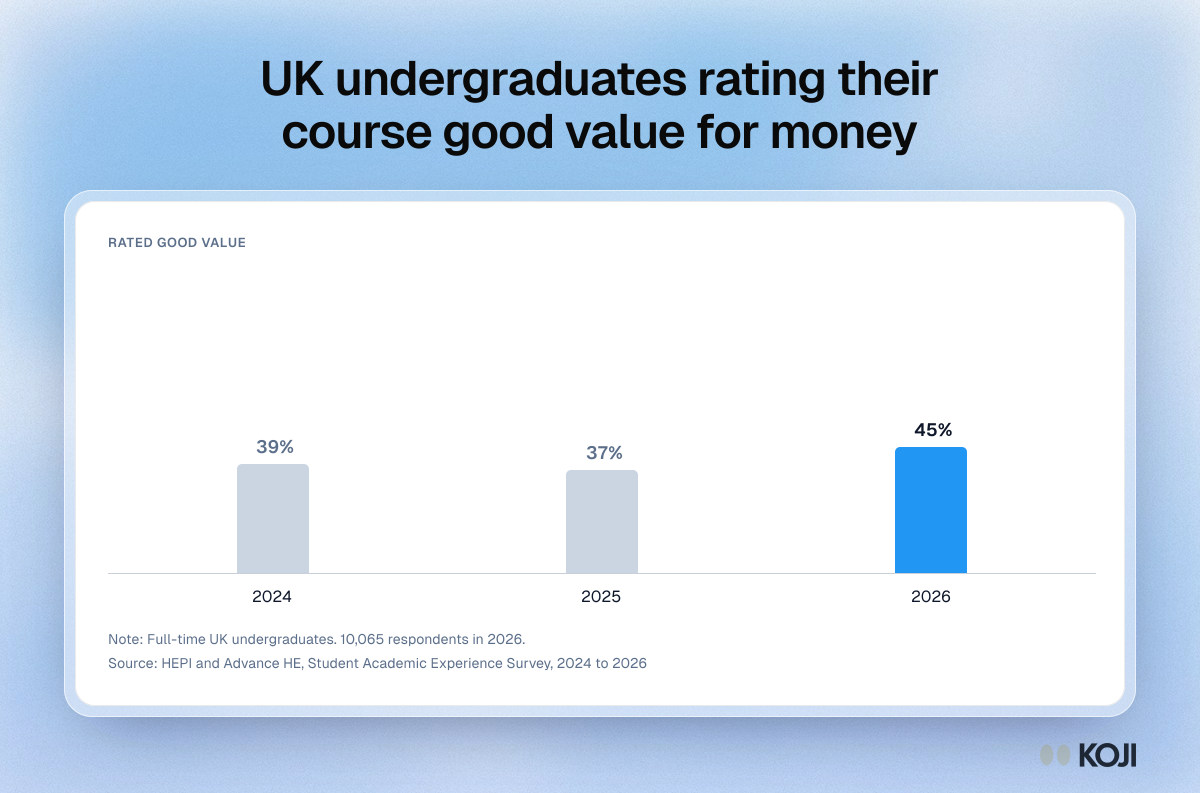
The share of UK full-time undergraduates who rated their course good or very good value for money in the HEPI and Advance HE Student Academic Experience Survey, from 2024 to 2026. Course and quality teams can use it as sector context, not as a course target, since value judgements mix teaching quality with the cost of living. Koji can follow up a value rating by asking students what is behind it.
What's in this column chart
| Good or very good value | |
|---|---|
| 2024 | 39% |
| 2025 | 37% |
| 2026 | 45% |
Full-time UK undergraduates. 10,065 respondents in 2026.
Use this image
Free to use in your docs, decks and posts under CC BY 4.0, as long as you credit Koji with a link to this page. To embed it, paste this into your page:
html
<a href="https://www.koji.so/visuals/saes-good-value-for-money-2024-2026"><img src="https://www.koji.so/visuals/saes-good-value-for-money-2024-2026/saes-good-value-for-money-2024-2026.png" alt="Column chart of the share of UK full-time undergraduates rating their course good or very good value for money: 39% in 2024, 37% in 2025 and 45% in 2026." width="1200" height="793" /></a>
<p>Source: <a href="https://www.koji.so/visuals/saes-good-value-for-money-2024-2026">UK undergraduates rating their course good value for money</a>, Koji</p>