Column chart
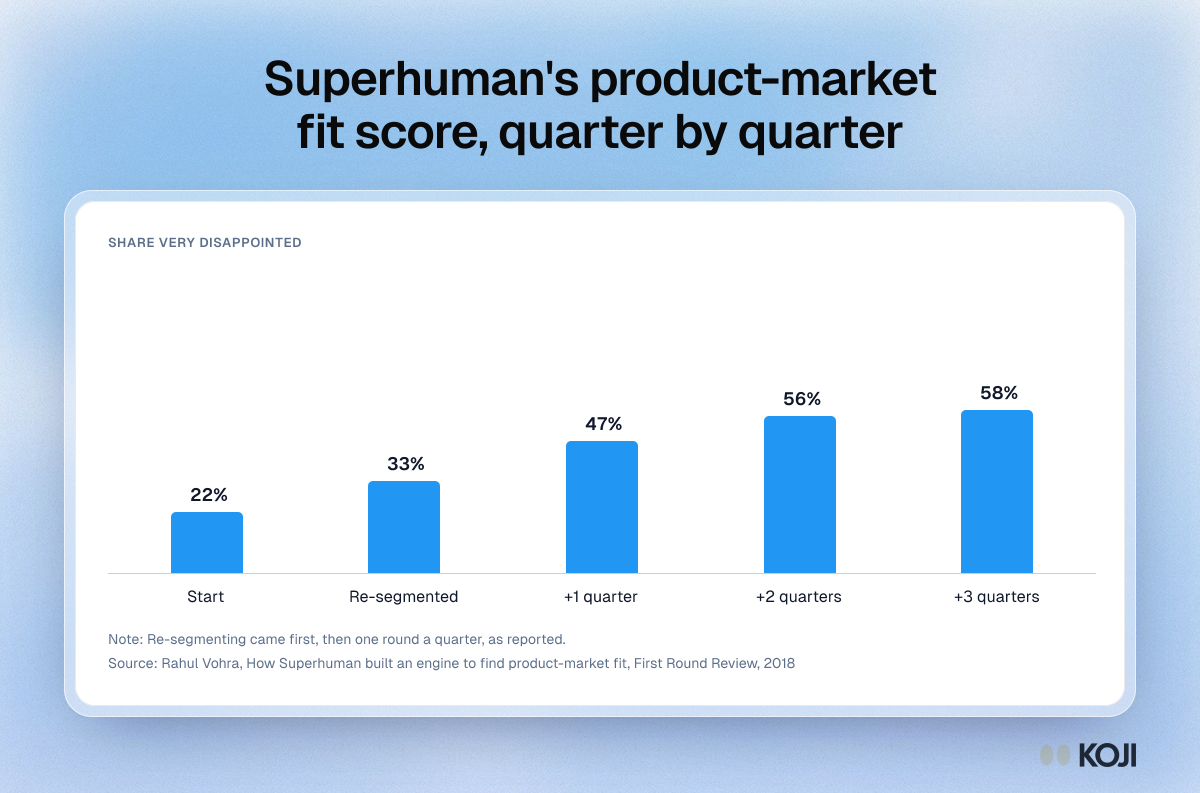
Superhuman's product-market fit score, quarter by quarter
How focusing on the happiest users moved the score from 22% to 58%
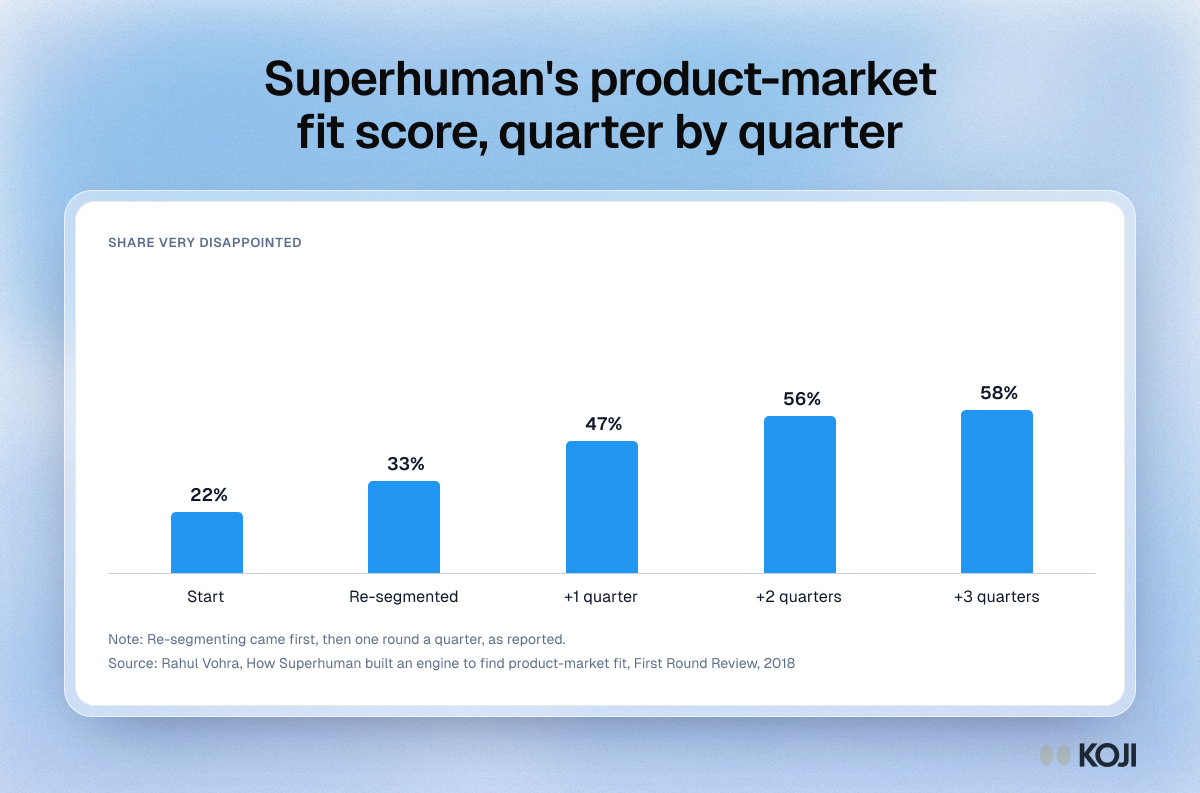
Superhuman's founder reported that the share of users who would be very disappointed without the product started at 22%. After the team focused on the users who loved it, the score rose to 33%, and later quarterly rounds took it to 47%, 56% and 58%. The chart is useful for founders deciding whose words and needs should shape their product and homepage. It shows what segmenting your best users can do before you change anything else.
Where this appears
What's in this column chart
| Very disappointed | |
|---|---|
| Start | 22% |
| Re-segmented | 33% |
| +1 quarter | 47% |
| +2 quarters | 56% |
| +3 quarters | 58% |
Re-segmenting came first, then one round a quarter, as reported.
Use this image
Free to use in your docs, decks and posts under CC BY 4.0, as long as you credit Koji with a link to this page. To embed it, paste this into your page:
html
<a href="https://www.koji.so/visuals/superhuman-pmf-score-by-quarter"><img src="https://www.koji.so/visuals/superhuman-pmf-score-by-quarter/superhuman-pmf-score-by-quarter.png" alt="Column chart of Superhuman's very disappointed score rising from 22% to 33% after re-segmenting, then 47%, 56% and 58%." width="1200" height="793" /></a>
<p>Source: <a href="https://www.koji.so/visuals/superhuman-pmf-score-by-quarter">Superhuman's product-market fit score, quarter by quarter</a>, Koji</p>