Reference table
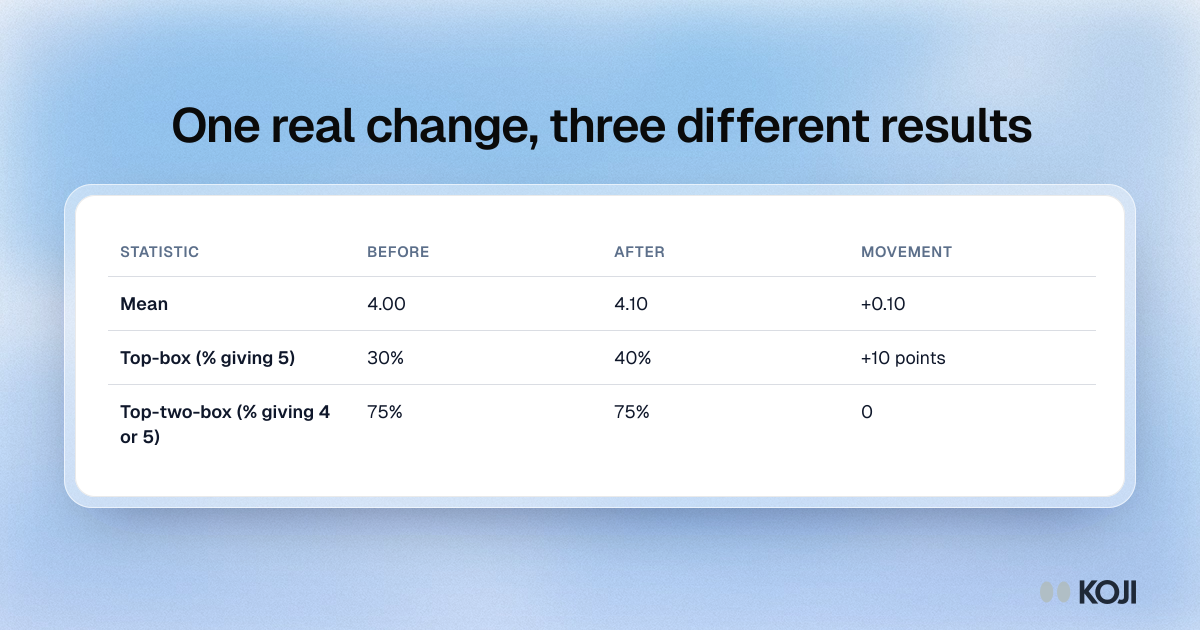
One real change, three different results
10% of respondents move from a 4 to a 5 on a 1 to 5 scale
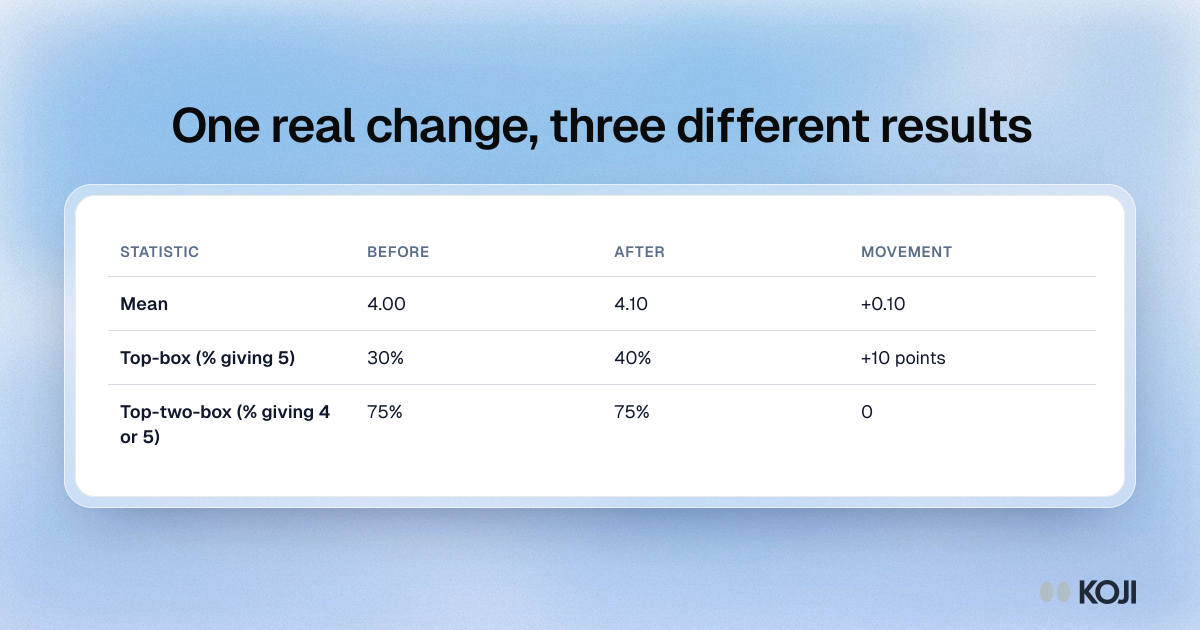
A worked example of how the choice of summary statistic changes what a real improvement looks like. Move 10% of respondents from a 4 to a 5 on a 1 to 5 satisfaction item and the mean rises by 0.10, the top-box score by 10 points and the top-two-box score not at all. Use it to explain to stakeholders why a number did or did not move. Koji stores each answer as a discrete value, so you can compute all three from the same wave.
Where this appears
What's in this reference table
| Statistic | Before | After | Movement |
|---|---|---|---|
| Mean | 4.00 | 4.10 | +0.10 |
| Top-box (% giving 5) | 30% | 40% | +10 points |
| Top-two-box (% giving 4 or 5) | 75% | 75% | 0 |
Use this image
Free to use in your docs, decks and posts under CC BY 4.0, as long as you credit Koji with a link to this page. To embed it, paste this into your page:
html
<a href="https://www.koji.so/visuals/same-change-mean-vs-top-box-vs-top-two-box"><img src="https://www.koji.so/visuals/same-change-mean-vs-top-box-vs-top-two-box/same-change-mean-vs-top-box-vs-top-two-box.png" alt="Table showing how moving 10% of respondents from 4 to 5 shifts the mean by 0.10, top-box by 10 points and top-two-box by nothing." width="1200" height="630" /></a>
<p>Source: <a href="https://www.koji.so/visuals/same-change-mean-vs-top-box-vs-top-two-box">One real change, three different results</a>, Koji</p>