Reference table
SERVQUAL vs SERVPERF
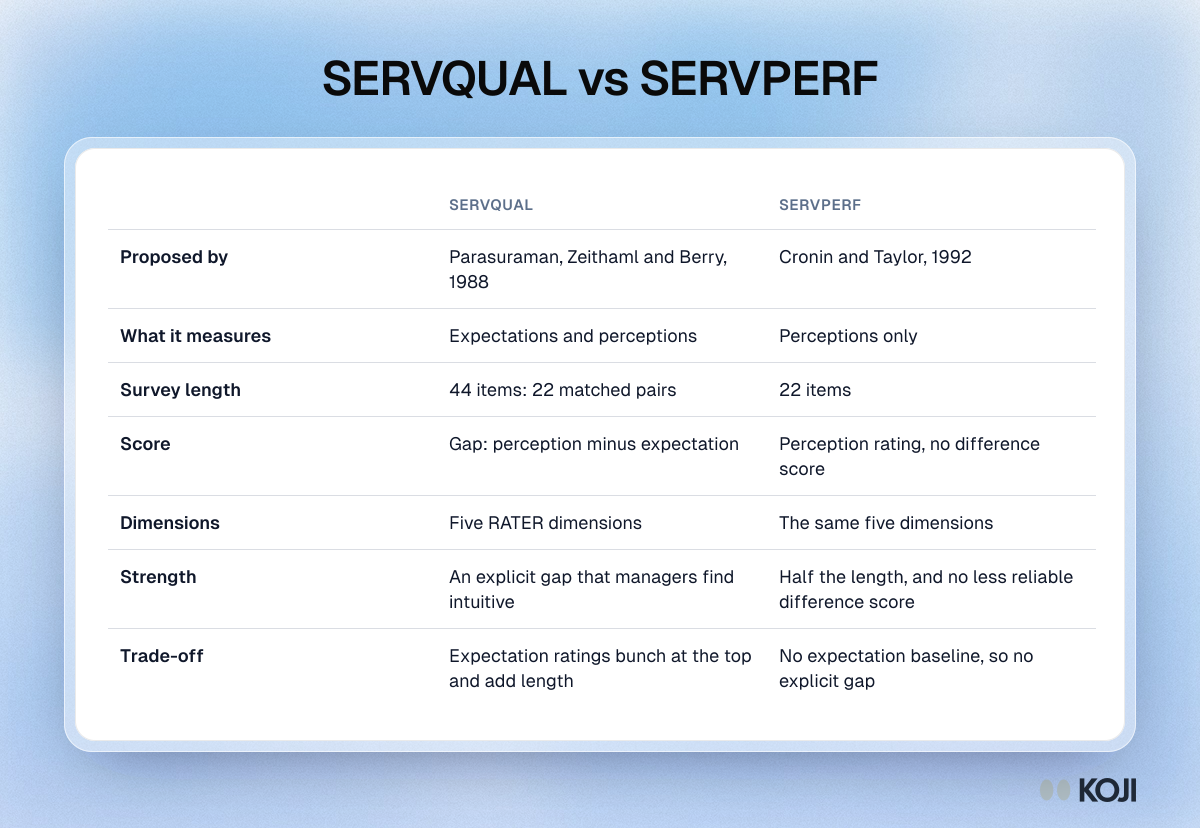
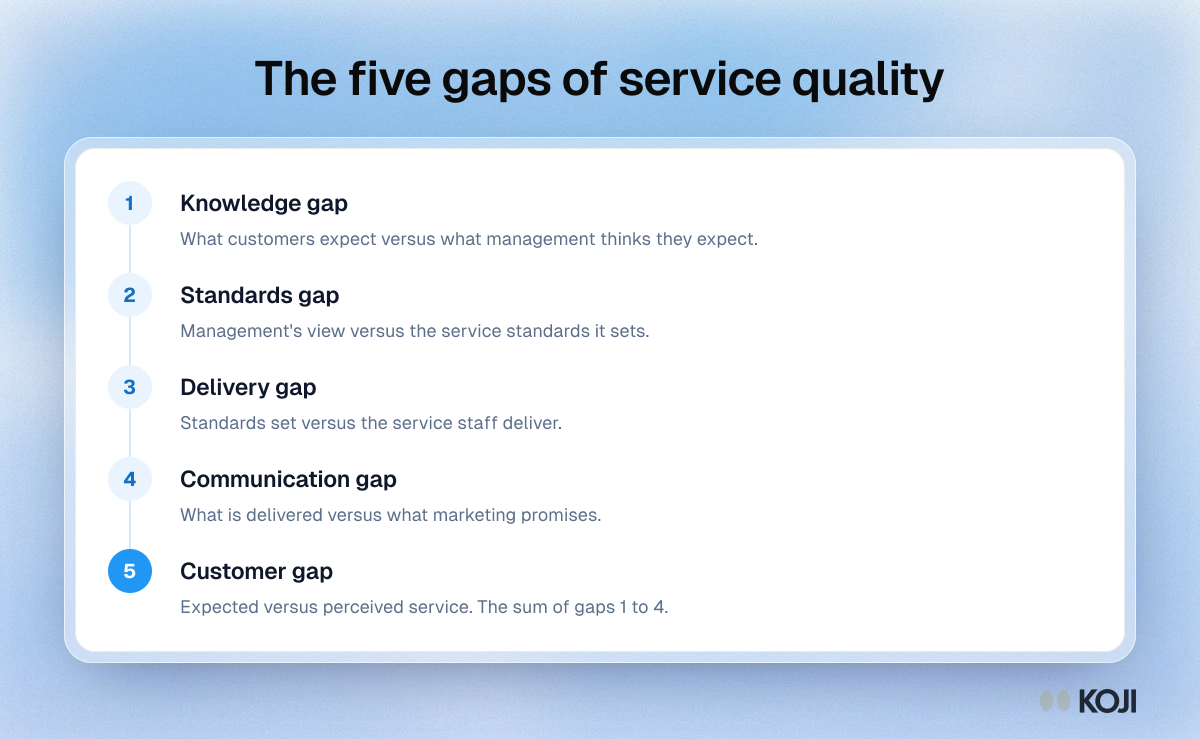
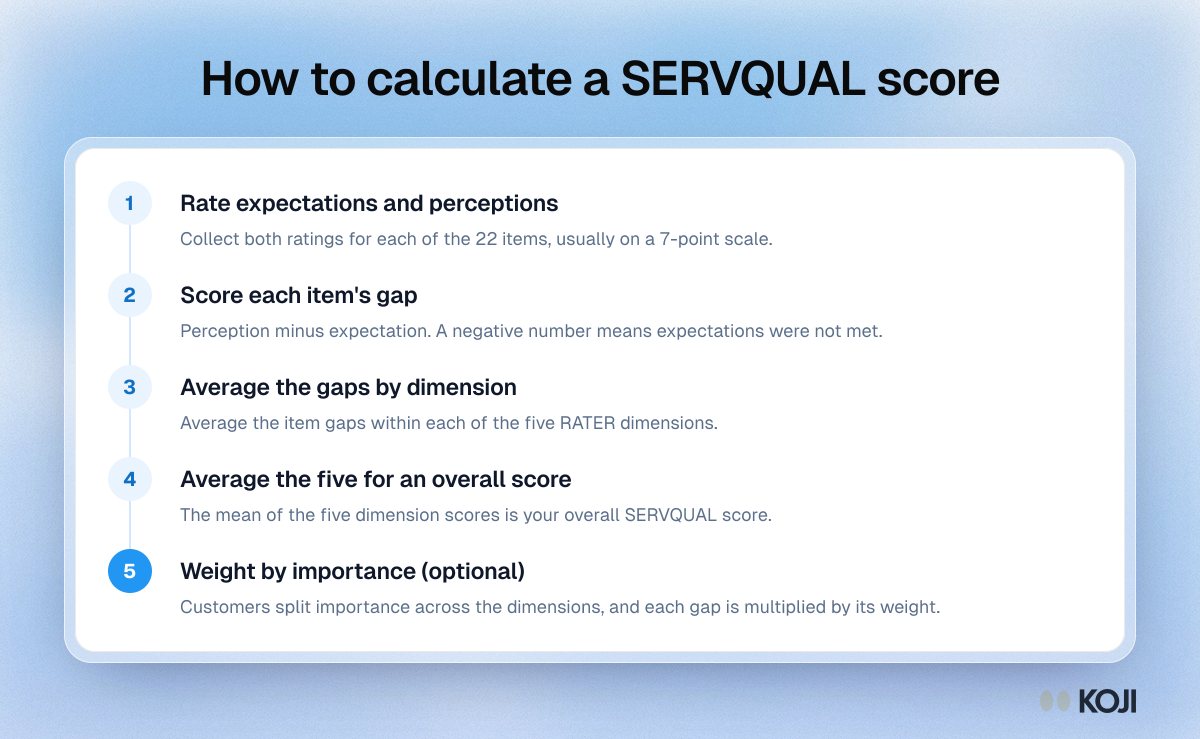
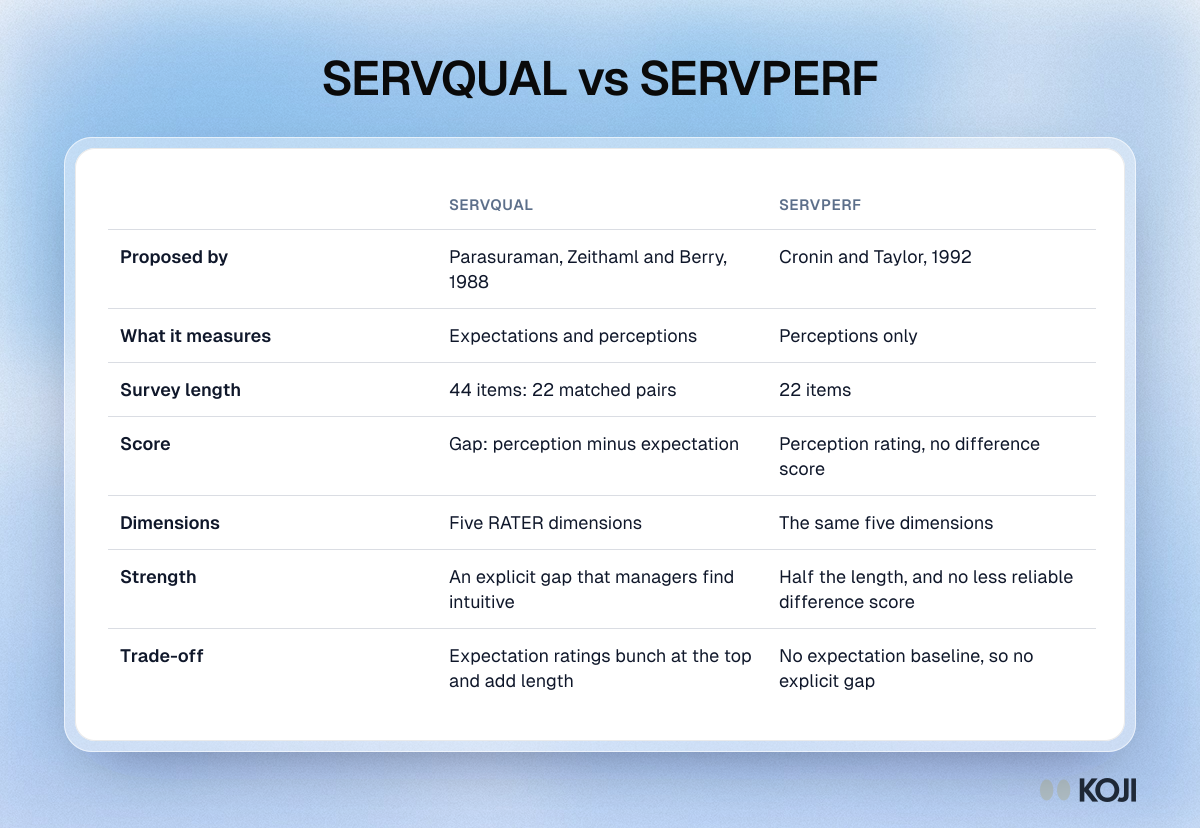
A side-by-side comparison of SERVQUAL and SERVPERF, the two best-known ways to measure service quality. SERVQUAL compares expectations with perceptions across 44 items. SERVPERF, from Cronin and Taylor in 1992, measures perceptions only with 22 items and skips the difference score. Use it to pick the instrument that fits your study, or to explain the trade-off to stakeholders. Koji can run either style with scale questions and an open follow-up.
Where this appears
What's in this reference table
| SERVQUAL | SERVPERF | |
|---|---|---|
| Proposed by | Parasuraman, Zeithaml and Berry, 1988 | Cronin and Taylor, 1992 |
| What it measures | Expectations and perceptions | Perceptions only |
| Survey length | 44 items: 22 matched pairs | 22 items |
| Score | Gap: perception minus expectation | Perception rating, no difference score |
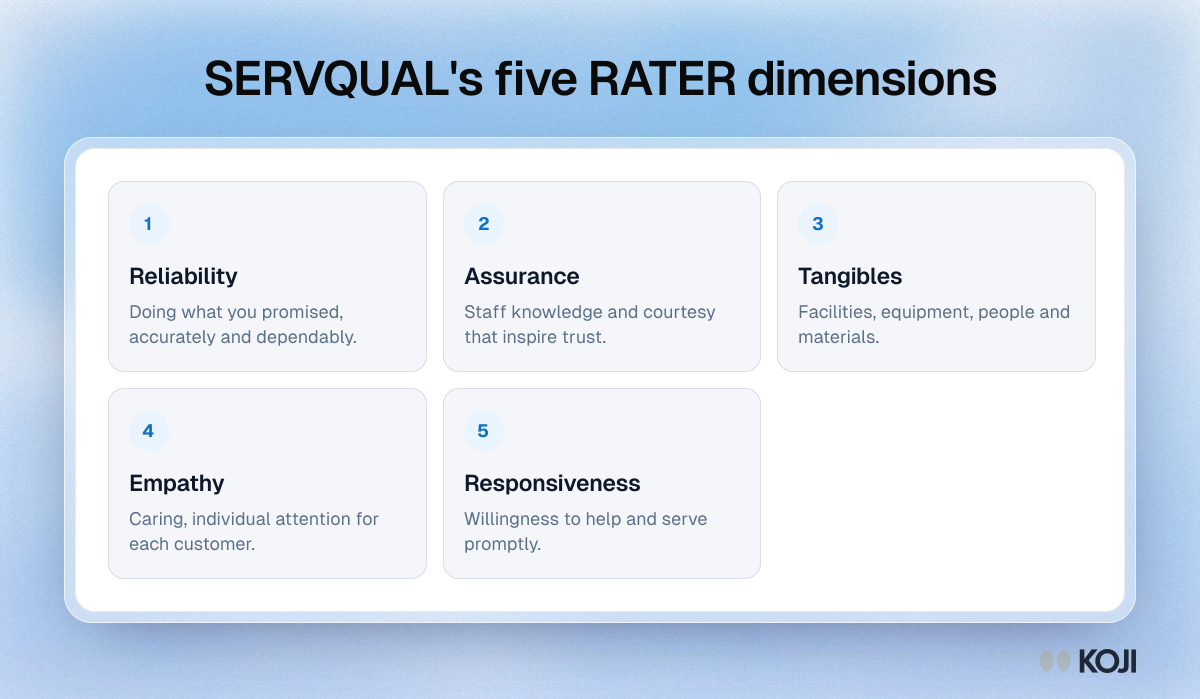
| Dimensions | Five RATER dimensions | The same five dimensions |
| Strength | An explicit gap that managers find intuitive | Half the length, and no less reliable difference score |
| Trade-off | Expectation ratings bunch at the top and add length | No expectation baseline, so no explicit gap |
Use this image
Free to use in your docs, decks and posts under CC BY 4.0, as long as you credit Koji with a link to this page. To embed it, paste this into your page:
html
<a href="https://www.koji.so/visuals/servqual-vs-servperf-comparison"><img src="https://www.koji.so/visuals/servqual-vs-servperf-comparison/servqual-vs-servperf-comparison.png" alt="Table comparing SERVQUAL and SERVPERF by origin, what each measures, survey length, scoring, strengths and trade-offs." width="1200" height="828" /></a>
<p>Source: <a href="https://www.koji.so/visuals/servqual-vs-servperf-comparison">SERVQUAL vs SERVPERF</a>, Koji</p>