Reference table
SUS score grades and percentiles
What a System Usability Scale score means on the curved letter-grade scale
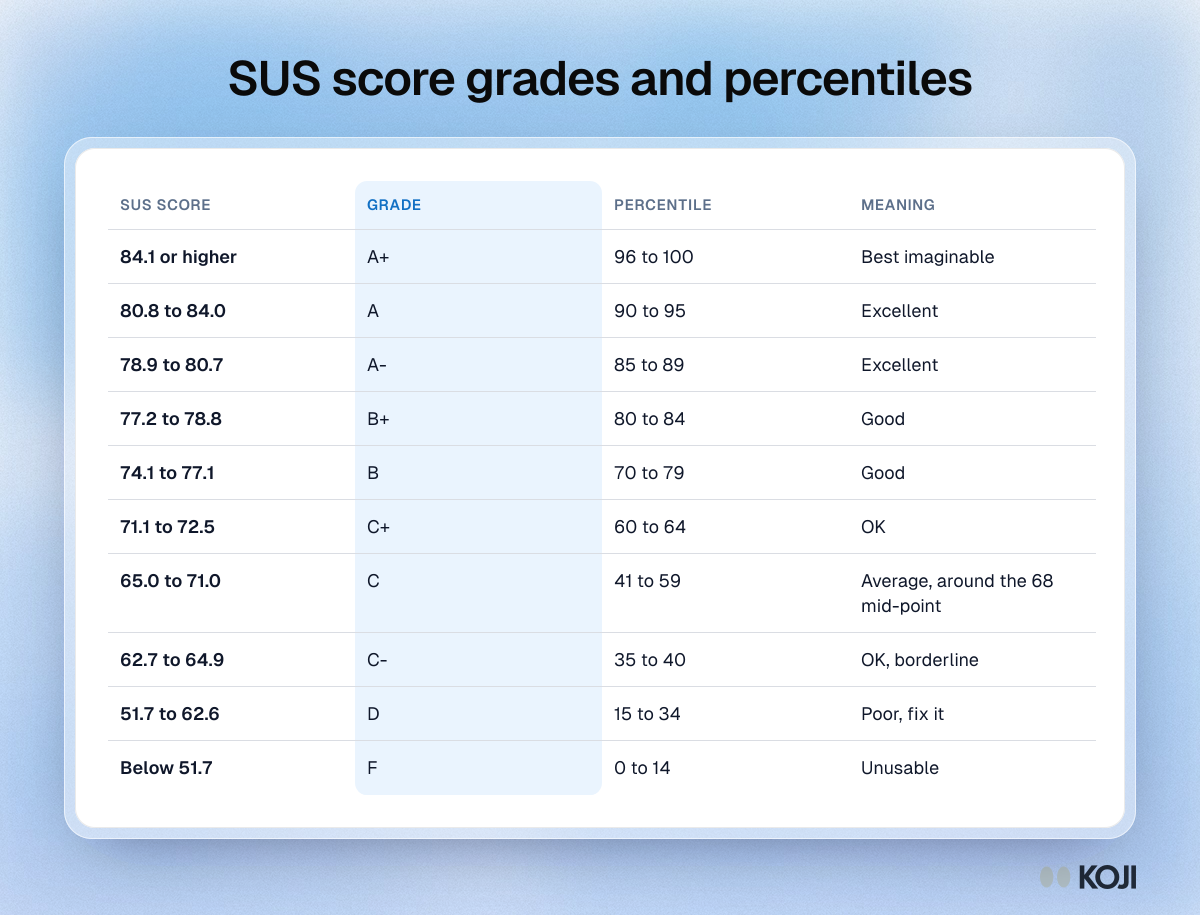
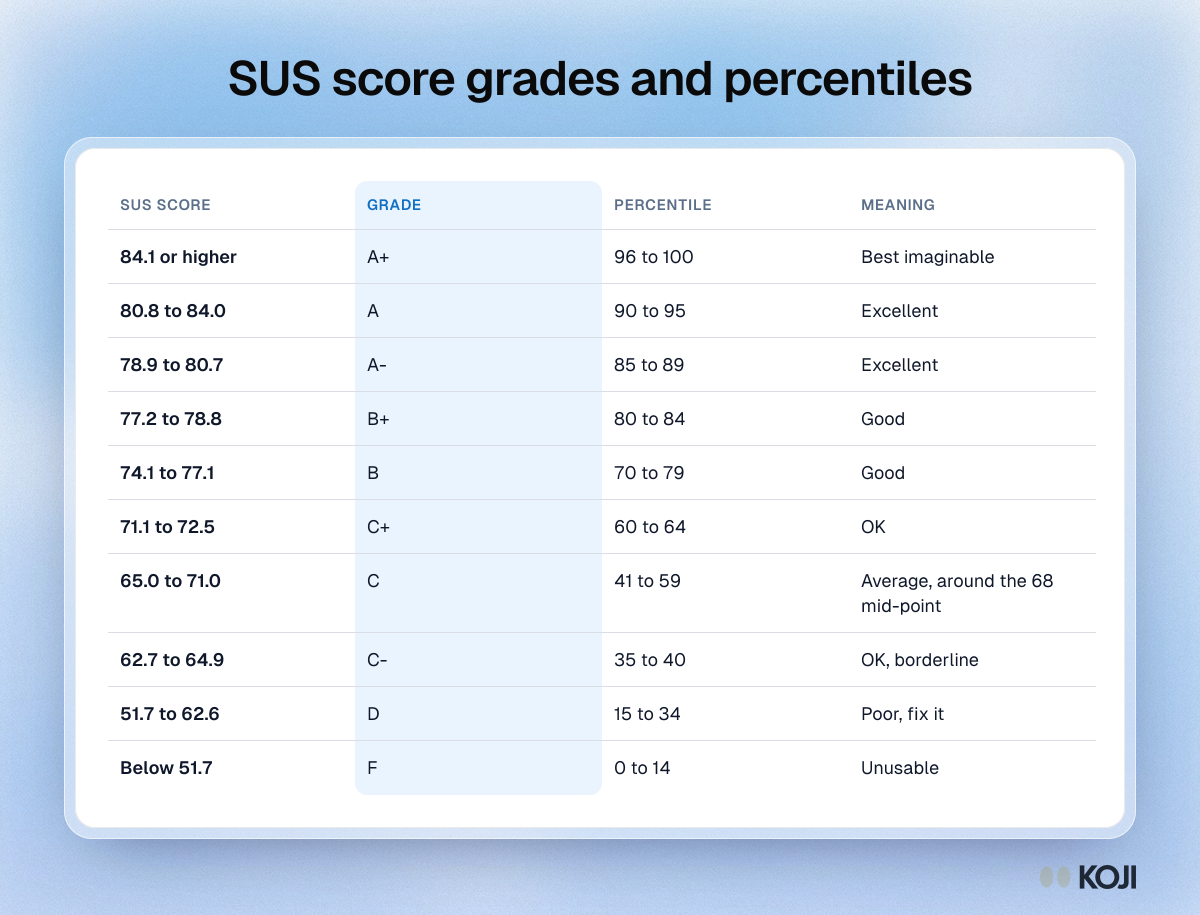
A SUS score is an index, not a percentage, so it only makes sense next to the benchmark distribution. This table condenses the curved grading scale into score bands, letter grades, percentiles and plain-language meanings. Use it to report a result to stakeholders, or to see whether a score of around 68 is really just average. The B- band is left out to keep the table readable.
Where this appears
What's in this reference table
| SUS score | Grade | Percentile | Meaning |
|---|---|---|---|
| 84.1 or higher | A+ | 96 to 100 | Best imaginable |
| 80.8 to 84.0 | A | 90 to 95 | Excellent |
| 78.9 to 80.7 | A- | 85 to 89 | Excellent |
| 77.2 to 78.8 | B+ | 80 to 84 | Good |
| 74.1 to 77.1 | B | 70 to 79 | Good |
| 71.1 to 72.5 | C+ | 60 to 64 | OK |
| 65.0 to 71.0 | C | 41 to 59 | Average, around the 68 mid-point |
| 62.7 to 64.9 | C- | 35 to 40 | OK, borderline |
| 51.7 to 62.6 | D | 15 to 34 | Poor, fix it |
| Below 51.7 | F | 0 to 14 | Unusable |
Use this image
Free to use in your docs, decks and posts under CC BY 4.0, as long as you credit Koji with a link to this page. To embed it, paste this into your page:
html
<a href="https://www.koji.so/visuals/sus-score-grades-and-percentiles"><img src="https://www.koji.so/visuals/sus-score-grades-and-percentiles/sus-score-grades-and-percentiles.png" alt="Table of System Usability Scale scores with letter grade, percentile and meaning, from A+ at 84.1 or higher down to F below 51.7, with 68 as the average." width="1200" height="915" /></a>
<p>Source: <a href="https://www.koji.so/visuals/sus-score-grades-and-percentiles">SUS score grades and percentiles</a>, Koji</p>