Column chart
Usability problems found by 5, 10 and 15 users
Why one round of five users is not always enough
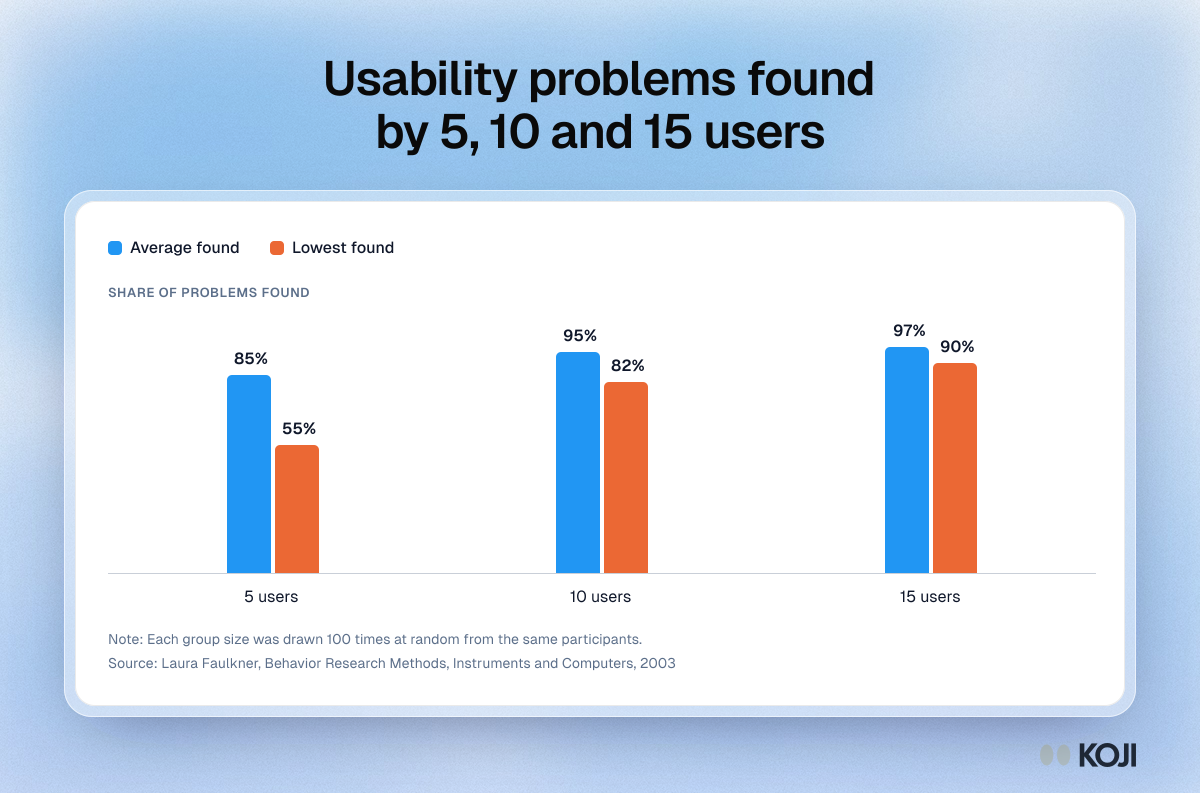
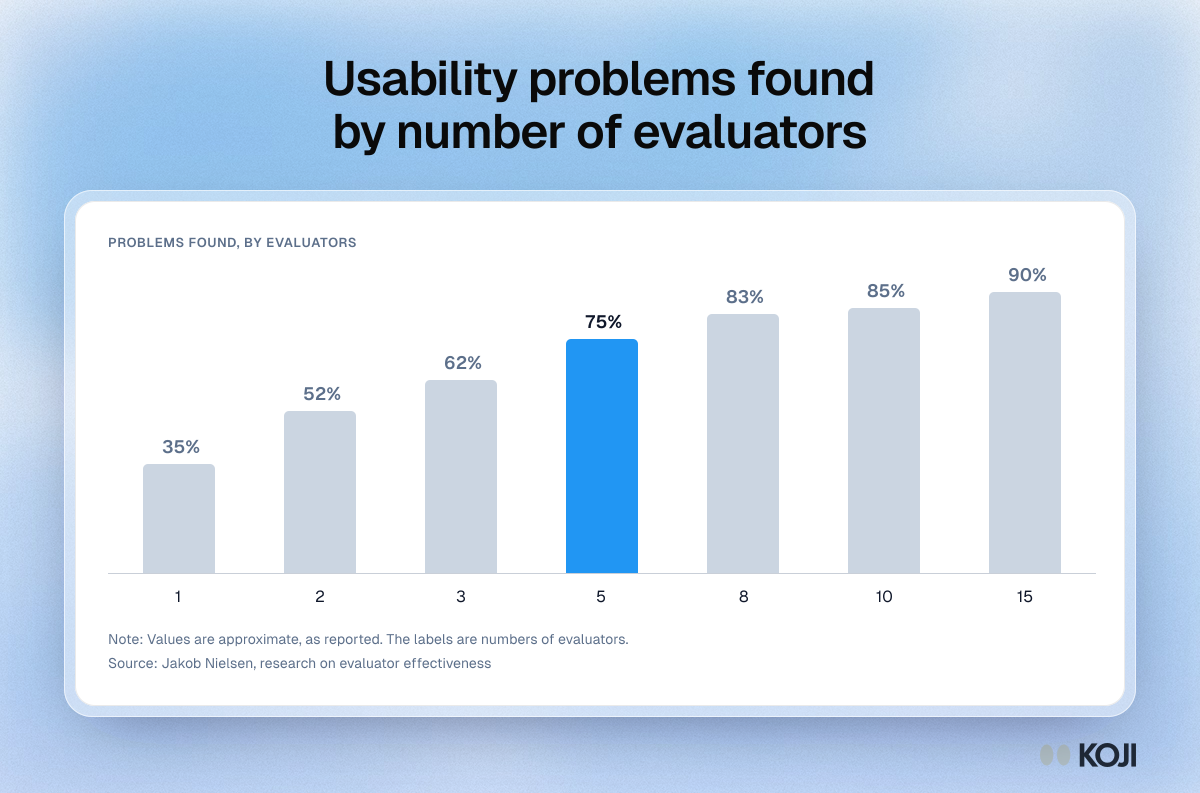
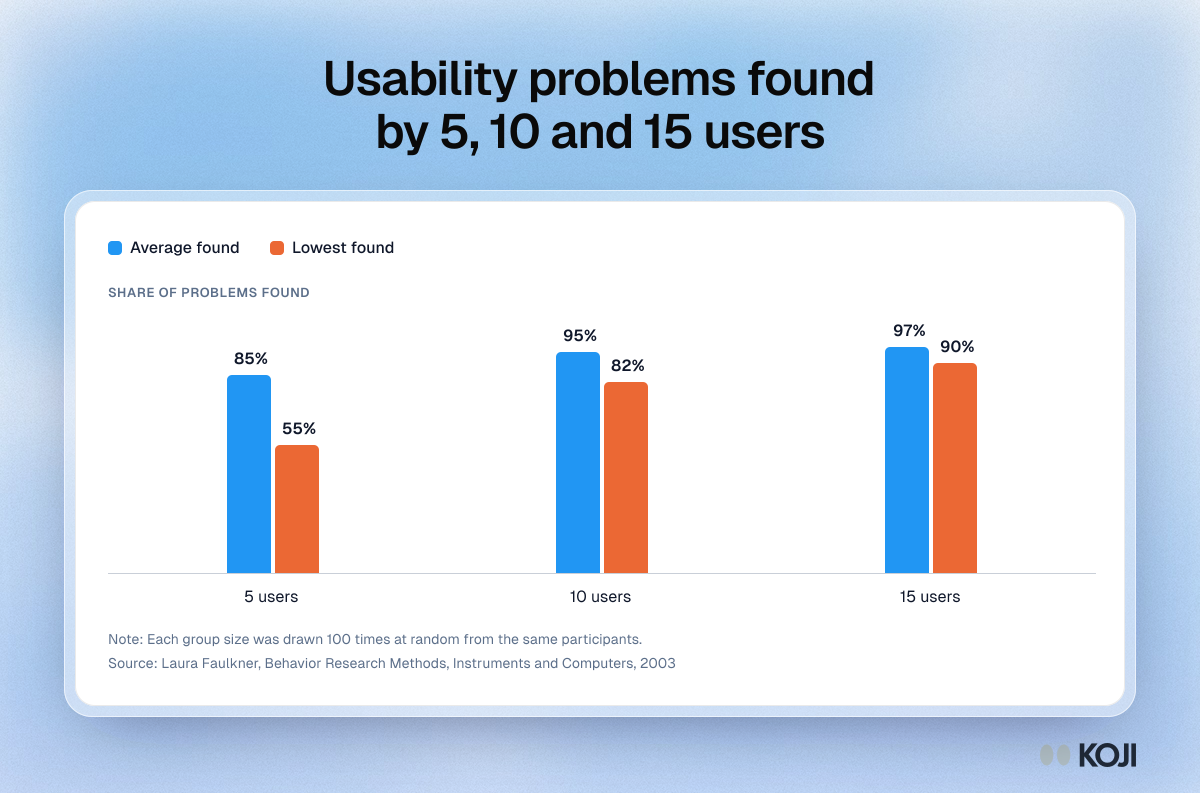
This chart shows how many usability problems random groups of 5, 10 and 15 users found in Laura Faulkner's 2003 study, on average and in the worst draw. It is for founders and product teams deciding how many people to put through a usability test. Read it as a case for small, repeated rounds: five people catch most problems on average, but a second round protects you from an unlucky first group. Koji can run those rounds as task questions with your own users.
Where this appears
What's in this column chart
| Average found | Lowest found | |
|---|---|---|
| 5 users | 85% | 55% |
| 10 users | 95% | 82% |
| 15 users | 97% | 90% |
Each group size was drawn 100 times at random from the same participants.
Use this image
Free to use in your docs, decks and posts under CC BY 4.0, as long as you credit Koji with a link to this page. To embed it, paste this into your page:
html
<a href="https://www.koji.so/visuals/usability-problems-found-by-group-size-faulkner"><img src="https://www.koji.so/visuals/usability-problems-found-by-group-size-faulkner/usability-problems-found-by-group-size-faulkner.png" alt="Column chart from Faulkner 2003: 5 users found 85% of usability problems on average but 55% at worst, 10 users 95% and 82%, 15 users 97% and 90%." width="1200" height="793" /></a>
<p>Source: <a href="https://www.koji.so/visuals/usability-problems-found-by-group-size-faulkner">Usability problems found by 5, 10 and 15 users</a>, Koji</p>