Reference table
What each usability test result tells you
Six results a usability task produces, and the limits of each
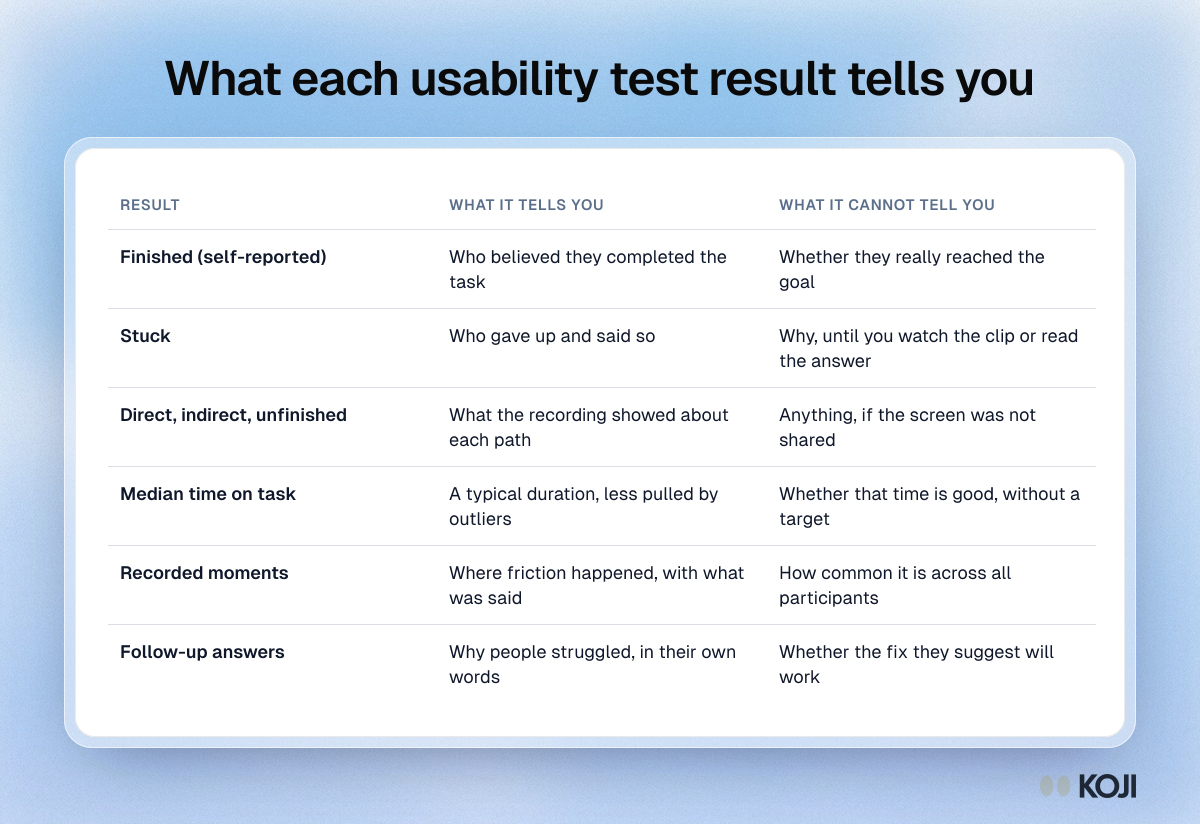
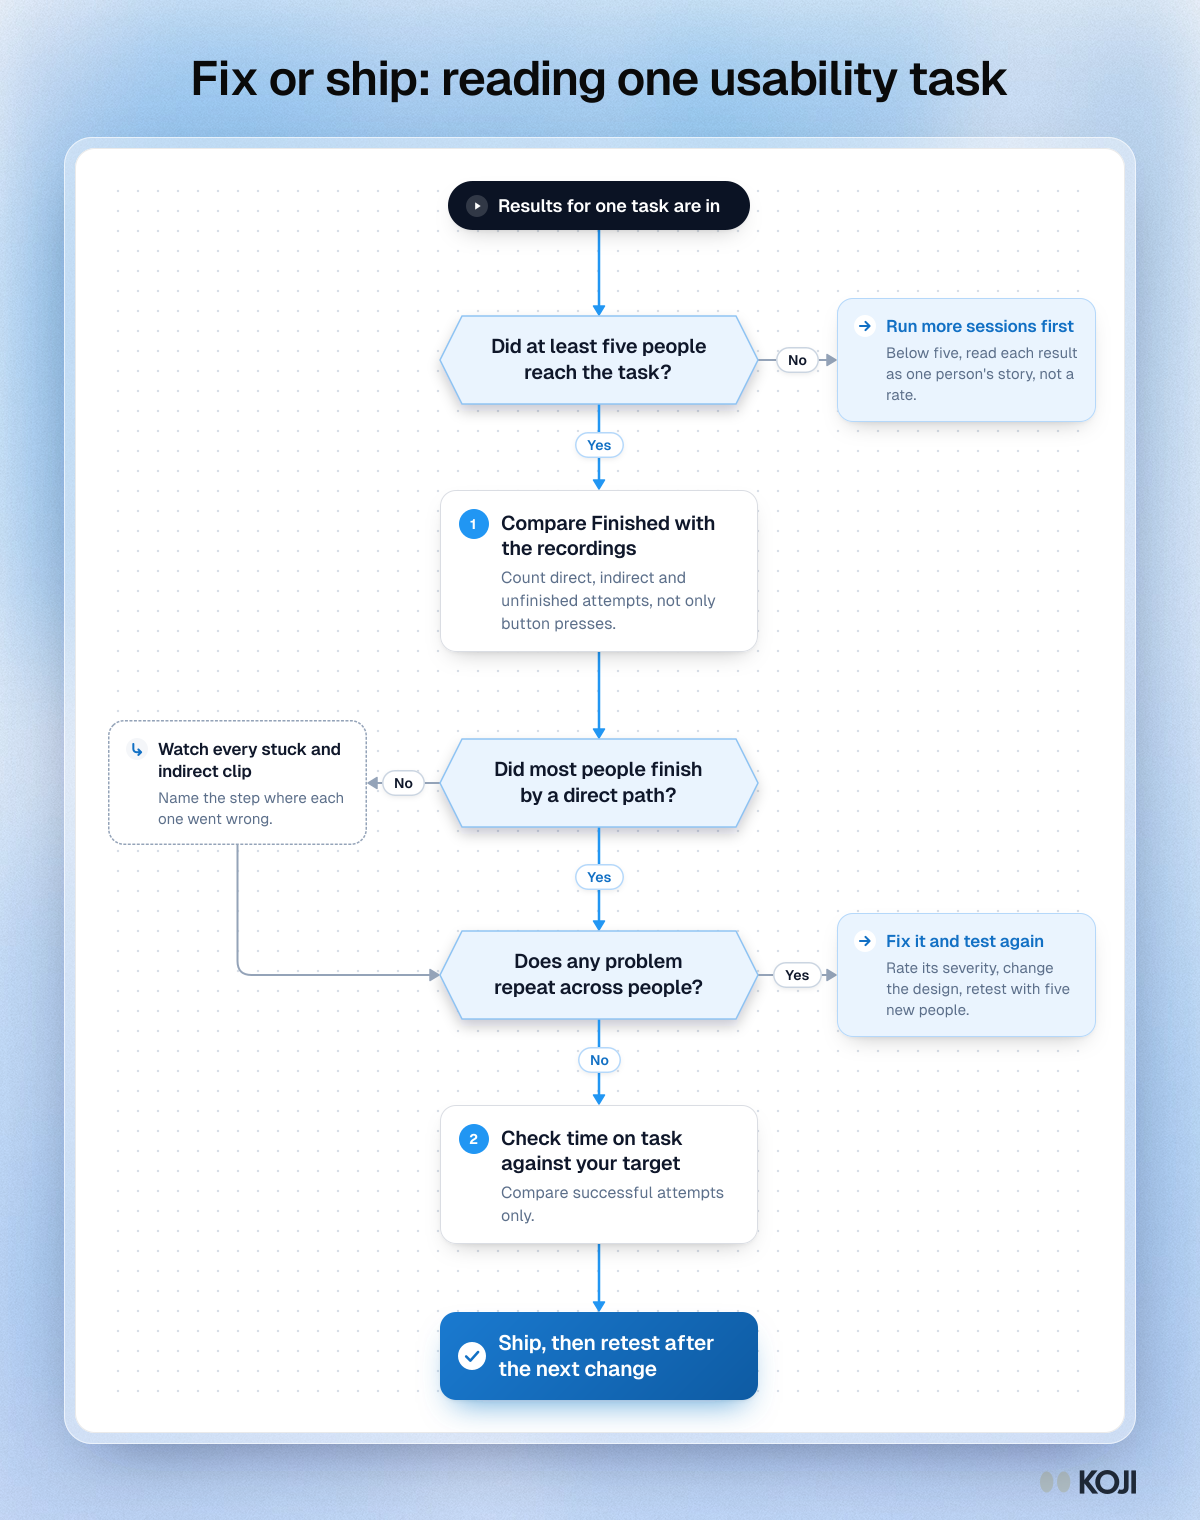
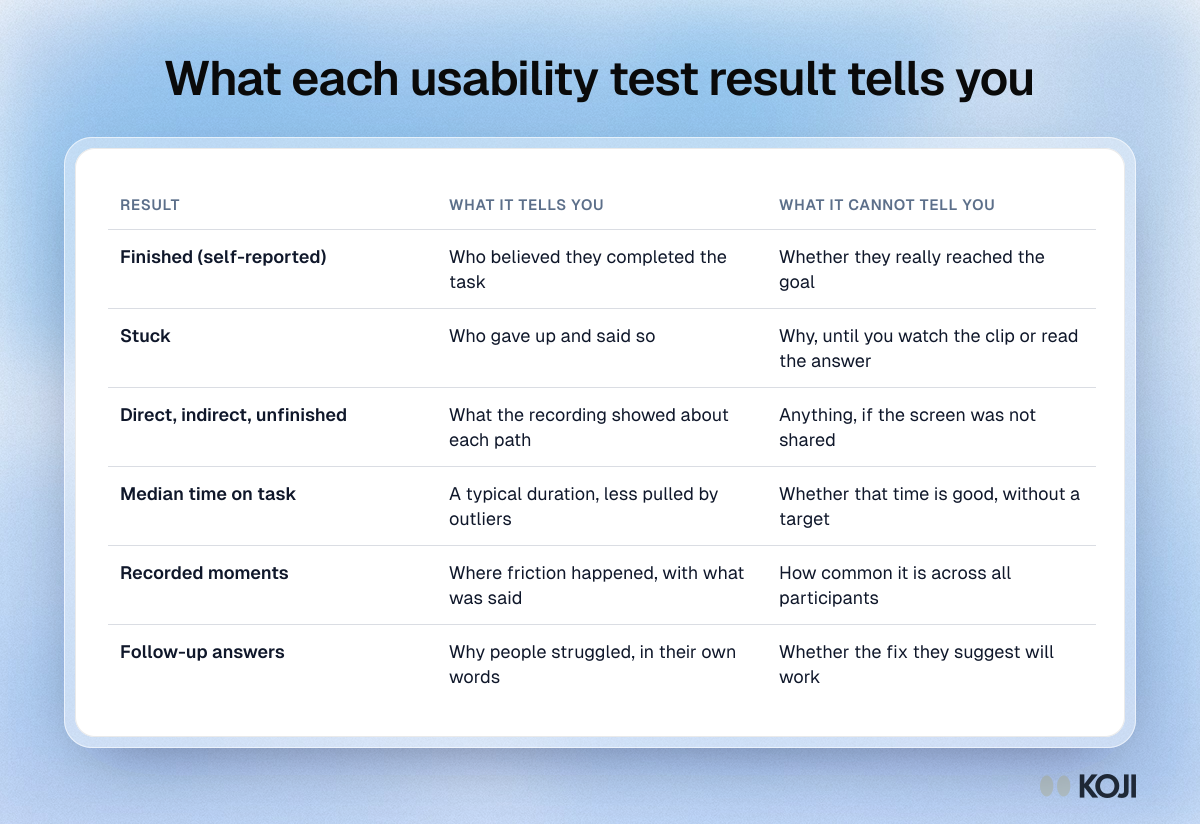
A reference table for product managers and researchers reading usability test results. It lists six results a task produces, from self-reported finishing and stuck counts to recordings, median time, recorded moments and follow-up answers, and says what each can and cannot tell you. Keep it next to your report when you decide what to fix. Koji reports show all six for each task question.
Where this appears
What's in this reference table
| Result | What it tells you | What it cannot tell you |
|---|---|---|
| Finished (self-reported) | Who believed they completed the task | Whether they really reached the goal |
| Stuck | Who gave up and said so | Why, until you watch the clip or read the answer |
| Direct, indirect, unfinished | What the recording showed about each path | Anything, if the screen was not shared |
| Median time on task | A typical duration, less pulled by outliers | Whether that time is good, without a target |
| Recorded moments | Where friction happened, with what was said | How common it is across all participants |
| Follow-up answers | Why people struggled, in their own words | Whether the fix they suggest will work |
Use this image
Free to use in your docs, decks and posts under CC BY 4.0, as long as you credit Koji with a link to this page. To embed it, paste this into your page:
html
<a href="https://www.koji.so/visuals/usability-test-results-what-each-tells-you"><img src="https://www.koji.so/visuals/usability-test-results-what-each-tells-you/usability-test-results-what-each-tells-you.png" alt="Table of six usability test results, from self-reported finishing to follow-up answers, with what each one tells you and what it cannot tell you." width="1200" height="824" /></a>
<p>Source: <a href="https://www.koji.so/visuals/usability-test-results-what-each-tells-you">What each usability test result tells you</a>, Koji</p>