How to Read Usability Test Results: Success Rate, Time on Task and the Moments Behind Them
How to read usability test results and decide whether to fix or ship: self-reported vs observed success, stuck and drop-off, median time on task, post-task ratings, small samples and a worked example.
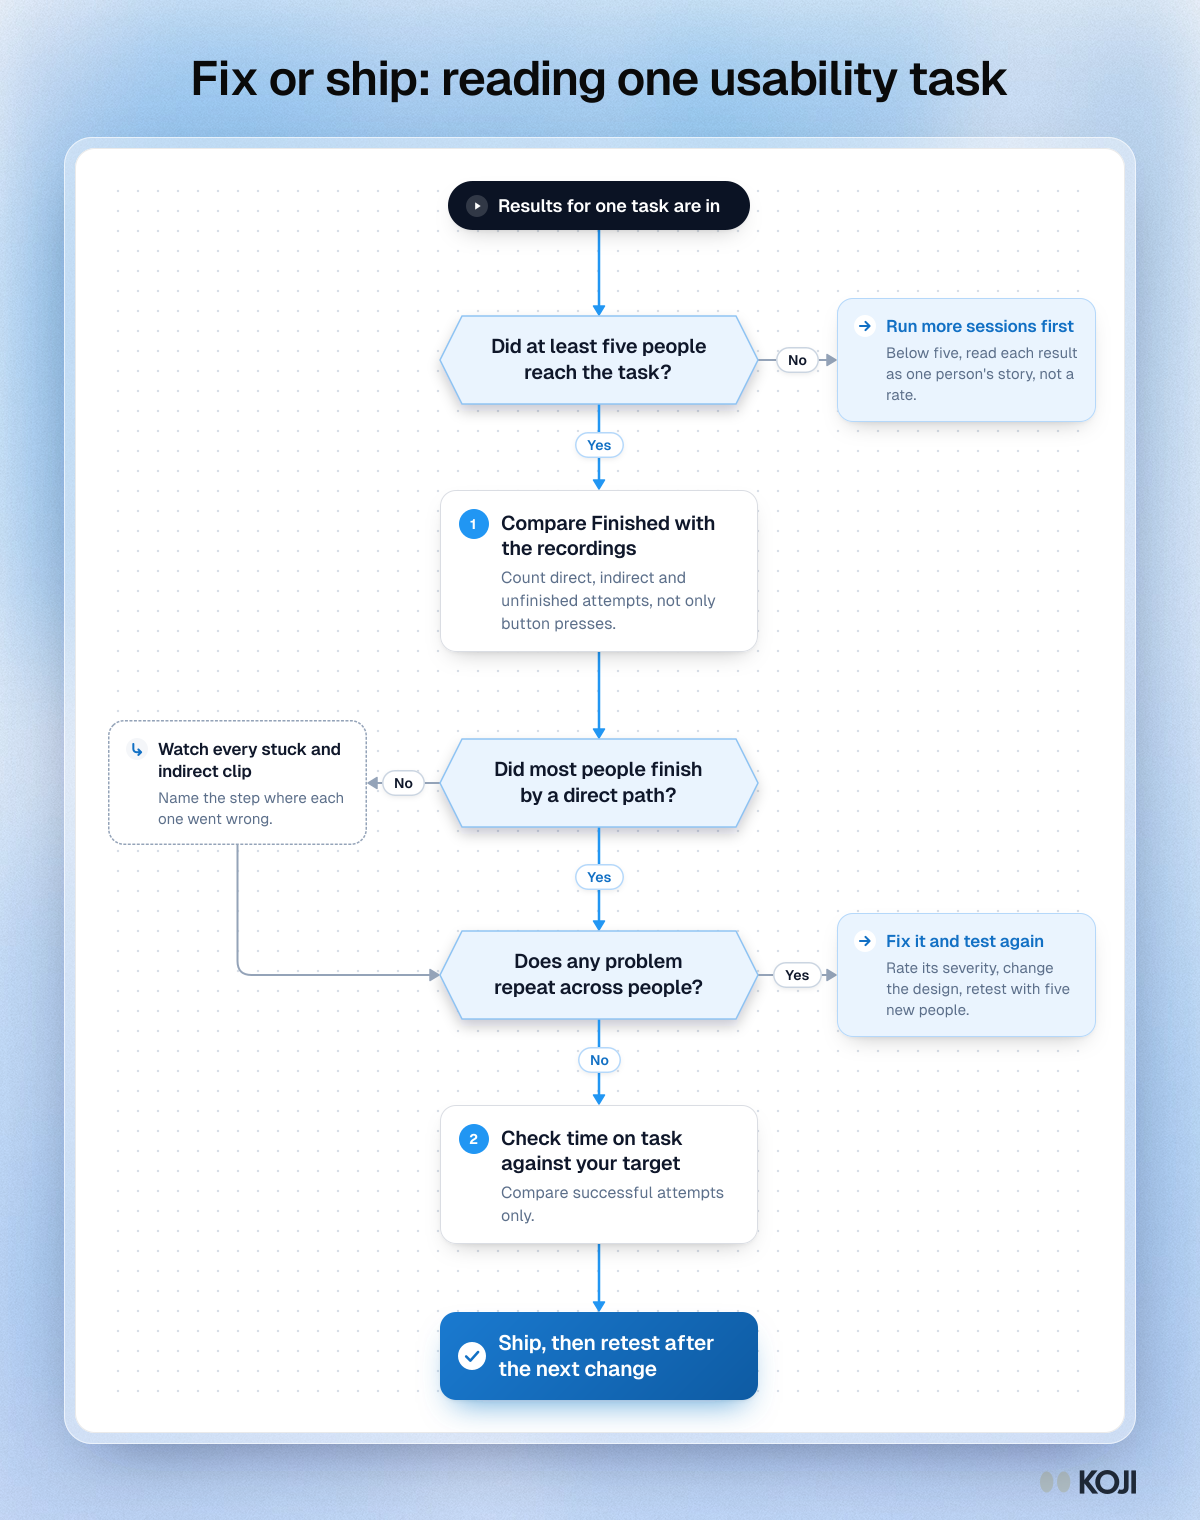
To read usability test results, start with what people actually did, not what they said they did. For each task, compare the share who finished with what the recordings show, look for problems that repeat across participants, and only then look at time on task. A task is ready to ship when most people finish it by a direct path and no problem shows up in more than one session. If a problem repeats, fix it and test again with a fresh group.
This guide walks through that reading in order: the four numbers a task produces, how far to trust each one, how to turn clips and quotes into a fix list, and a worked example. It is written for product managers and founders who ran a test themselves and now have to decide what to do with it.
Want to try it on your own flow? You can add a task to a free Koji study and get every number in this guide for each participant. The setup is in How Koji helps below.
The short version: a fix-or-ship rule
Read one task at a time, in this order:
- Check you have enough sessions. With fewer than five people on a task, treat each result as one person's story, not a rate.
- Compare self-reported success with observed success. "I'm done" is a claim. The recording shows whether they got there, and how.
- Watch every stuck and indirect session. Name the step where each one went wrong.
- Look for repeats. One person tripping on something is a note. Two or more tripping on the same step is a problem to fix.
- Check time last. Time on task only means something once you know people succeeded, and only against a target.
The four numbers a task gives you
Almost every usability tool reports some version of the same results. Each one answers a different question.
Completion rate (and why "finished" is not the same as success)
Completion rate is the share of people who completed the task. It is the simplest usability metric and the one stakeholders understand at once. For context, Jeff Sauro's analysis of almost 1,200 tasks across software and websites put the average completion rate at 78% (MeasuringU). Use that as a rough reference when you have no benchmark of your own, never as a pass mark. A checkout or a password reset needs to be far higher than average, because failure there costs you a sale or a support ticket.
The catch is how completion gets recorded. In an unmoderated test, people usually say for themselves that they are finished, and they are often wrong. When MeasuringU compared self-reported and verified completion across four unmoderated benchmark studies covering ten tasks, reported completion ran well above verified completion, and self-reported rates explained only about 18% of the variation in verified completion. Someone can press "done" on the wrong page, convinced they found the setting.
So split completion into two measures:
- Self-reported success: they said they finished.
- Observed success: the recording shows they reached the goal. Observed success has two kinds. A direct success follows a reasonable path. An indirect success gets there after wrong turns, back-tracking or a search.
An indirect success counts as a success for the completion rate, but treat it as a warning. It usually means the label, menu or page that should have led people there did not.
Stuck and drop-off
"Stuck" is a person telling you they gave up. Drop-off is a person who left the task without saying anything. Both are failures, but they carry different information. A stuck press arrives with a reason in their own words if you ask for one. A silent drop-off only tells you where they stopped. Look at the page where each failure ended: if three of four failures end on the same page, you have found the problem before watching a single clip.
Time on task
Time on task tells you how long people spent between seeing the task and finishing or giving up. It is useful for comparing two designs, or one design before and after a change. It is weak on its own, for three reasons:
- Times are skewed. Most people take a similar time and a few take much longer, because they got lost, took a phone call or left a tab open. A mean gets pulled up by those few. Report the median, and for small samples consider the geometric mean, which Jeff Sauro and James Lewis found estimates the centre of task times with less error than the median in small samples (CHI 2010).
- Failed attempts mix in. Many reports, Koji's included, calculate the median across everyone who pressed a button, finished or stuck. A group that gives up quickly can make a hard task look fast. When you compare designs, compare times for successful attempts only.
- There is no universal good time. Set a target before the test, such as the time an experienced colleague takes plus a margin, and read the result against that.
Ratings after the task
Many tests add a single rating after each task, such as the Single Ease Question ("Overall, how difficult or easy was the task to complete?" on a 1 to 7 scale). Ratings and behaviour are related but not the same thing. In a MeasuringU analysis of 123 tests with 677 tasks and more than 3,000 users, the correlation between post-task ratings and completion rates was about 0.51. That is a real link, but it leaves plenty of room for people who failed and still called the task easy, or who succeeded and hated it. When the rating and the behaviour disagree, believe the behaviour and use the rating to ask why.
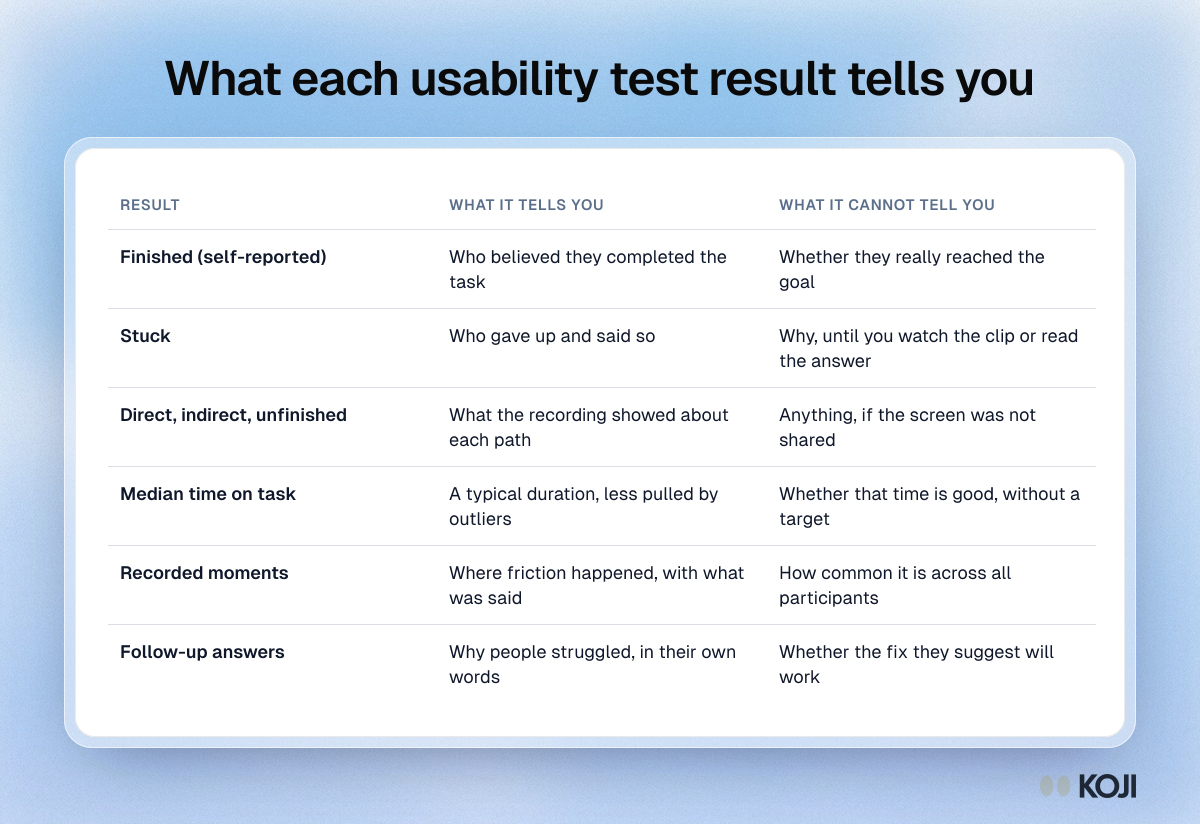
The table below sums up what each result can and cannot tell you.
How far to trust the numbers with five to ten people
Most product teams test with five to ten people per round, and that is a good choice. Jakob Nielsen's advice from 2000 still holds for finding problems: "The best results come from testing no more than 5 users and running as many small tests as you can afford." He also argued that three tests with five users improve a design more than one test with fifteen.
Small samples are good at finding problems and bad at measuring rates. If four of five people finish, the true completion rate could plausibly be anywhere from about 36% to 98% (an adjusted Wald 95% interval). So:
- Report counts, not percentages, for small rounds: "4 of 5 finished", not "80%".
- Add a confidence interval when you have to report a rate. The small-sample confidence intervals guide shows how, with a ready table for completion rates.
- Treat a repeat as a signal. A problem that two of five people hit independently is very unlikely to be rare among your users.
- Run a larger benchmark (20 or more people per task) only when you need a rate you can track over time. The usability benchmarking guide covers that.
Turning clips and quotes into a fix list
The numbers tell you which tasks need attention. The recordings and follow-up answers tell you what to change.
Watch the clips with your team
Watch every failed and indirect session, and at least one direct success for each task, so you know what the intended path looks like. Do it together if you can: a designer, an engineer and a PM watching the same 40-second clip agree on the problem much faster than they do reading a summary. For each failure, write one line: the step, what the person did, and what they expected to happen.

Photo by Alex Suprun on Unsplash
Name the step, not the person
Good fix-list entries describe the interface, not the participant: "The Billing link is under Account, and people look for it under Settings", not "P3 could not find billing". Then group entries that describe the same step. Each group is one usability issue.
Rate severity, then decide
For each issue, note how many people hit it, whether it blocked them or only slowed them, and whether it sits on a path most users take. The severity ratings guide gives a simple four-level scale. Fix blockers on common paths first. Leave cosmetic issues that one person mentioned for later.
Use their words to choose the fix
The follow-up answer, "What did you expect to happen?", is often more useful than the recording. People describe the label they were looking for, the place they expected a button, or the thing they thought a page was for. Those words are your first candidate fix. Then test the fix with five new people, not the same five, who now know the way.
A worked example: testing a new billing page
A PM at a small SaaS company tests one task with eight people: "You want to switch your plan from monthly to yearly billing. Show us how you would do that."
The results:
- Finished: 7 of 8 pressed "I'm done". Stuck: 1.
- Recordings: 4 direct successes, 2 indirect, 2 unfinished. One of the people who pressed "done" had stopped on the invoice history page.
- Median time: 1:50, against a target of 1:00.
- Clips: both indirect sessions and both failures went to Settings first and searched there before finding Account, then Billing.
- Follow-up answers: three people said they expected billing "under settings, with everything else".
Read with the rule above: the sample is big enough to read, observed success (6 of 8, with 2 of those indirect) is clearly lower than self-reported success (7 of 8), and the same problem repeats in four sessions. Time is over target, but that follows from the detour. The decision is to fix, not ship: add Billing under Settings, then retest with five new people. Reporting only "7 of 8 finished" would have shipped a page that half the participants struggled to find.
How Koji helps
Koji runs a usability test as part of an AI interview, so the task, the follow-up questions and any ratings sit in one study and one report. Task questions are in Beta and work on web pages: a live site, a staging build, a competitor's site or a prototype share link.
- The task. You add a Task question with a web address and the task text. The participant gets a task card, and the page opens inside the interview when the site allows it, or in a new tab with Koji in a small floating window. "I'm done" and "I'm stuck" are always on screen.
- Recording, with consent. On desktop, Koji offers to record the shared tab and the participant's voice. People can decline and still do the task, and you still get their outcome, time and answers.
- The follow-up. After they press a button, Koji asks what happened in neutral words, so you get the "what did you expect?" answer from every participant, not only the ones you had time to debrief.
- The task section of the report. It shows how many finished of everyone who reached the task, how many got stuck, the median time and how many screens were recorded. A verdict per participant, from the recording, separates direct success, indirect success and unfinished attempts, which is exactly the split between self-reported and observed success described above.
- Moments and page flow. A reel of recorded moments (friction, success, navigation) shows each clip with what the person said. A flow chart shows the pages people visited, how many took each route, how each route ended and where people stopped.
- What is exact and what is approximate. Outcome and time come from the button press, so they are exact. Moments, verdicts and the page path come from the recording, so they are approximate and link to the clip, and you should watch the clips before you decide. Without a recording there are no moments or page path.
- Mixed with other questions. Put a 1 to 7 rating after the task for the SEQ, add open questions, or mix tasks with the structured questions you already use, all in one link.
Each task adds credits to every completed interview, and Koji shows the cost before you launch. Koji does not run click tests, heatmaps, tree tests or first-click tests, and recording needs a desktop browser, so for native mobile apps use another tool. If you are a product manager testing a flow before release, Koji for product managers shows how teams fit this into a release cycle.
Common mistakes when reading results
- Reporting "finished" as success. Always check the recordings, or at least a sample of them.
- Percentages from five people. Say "4 of 5". A percentage implies precision a small test does not have.
- Averaging time across failures. Compare successful attempts when the question is speed.
- Trusting ratings over behaviour. A task people rate as easy can still have a low completion rate.
- Retesting with the same people. They learned the path the first time.
- Fixing everything at once. Fix the repeated blockers, retest, and let the next round show what is left.
Related Resources
- Usability metrics: task success rate, time on task and error rate
- Usability issue severity ratings
- Confidence intervals for small-sample UX research
- Single Ease Question (SEQ)
- How to write usability test tasks and scenarios
- Structured questions guide
Sources
- Nielsen, J. (2000). Why you only need to test with 5 users. Nielsen Norman Group, Alertbox, 19 March 2000.
- Sauro, J. What is a good task completion rate? MeasuringU. Average of almost 1,200 tasks.
- Sauro, J. Self-reported versus verified task completion in unmoderated benchmark studies. MeasuringU.
- Sauro, J. Do users fail a task and still rate it as easy? MeasuringU. 123 tests, 677 tasks.
- Sauro, J., and Lewis, J. R. (2010). Average task times in usability tests: what to report? Proceedings of CHI 2010.
Related Articles
Confidence Intervals for Small-Sample UX Research: Completion Rates, Ratings and Task Times
How to put confidence intervals around UX metrics from 5 to 20 participants: the adjusted Wald interval for completion rates, t-intervals for rating scales, and log-transformed intervals with the geometric mean for task times, with worked examples.
Single Ease Question (SEQ): The 7-Point UX Metric for Task-Level Usability (2026)
The complete 2026 guide to the Single Ease Question (SEQ): the verbatim 7-point scale wording, Sauro–MeasuringU benchmarks (5.3–5.5 average), correlation with task completion, when to use SEQ vs SUS, and how to bundle SEQ into AI-moderated interviews on Koji to get task-level usability scores in days.
Structured Questions in AI Interviews
Mix quantitative data collection — scales, ratings, multiple choice, ranking — with AI-powered conversational follow-up in a single interview.
Usability Issue Severity Ratings: How to Score, Prioritize, and Report UX Problems (2026)
How to rate the severity of usability problems using Nielsen's 0-4 scale, why single-evaluator ratings are unreliable, how to separate severity from priority, and how to replace guessed frequency estimates with measured data.
Usability Metrics: Task Success Rate, Time on Task, and Error Rate Explained
The complete guide to the core usability metrics — task success rate, time on task, and error rate — including industry benchmarks, formulas, sample sizes, and how to capture them automatically with AI-moderated research.
How to Write Usability Test Tasks and Scenarios (With Examples)
A usability test task is a realistic goal written so participants can act on it without being told how. Rules, a step-by-step method, weak vs strong examples and how many tasks to plan.
Audit Trail in Qualitative Research: What to Keep and How to Show It
What an audit trail is, the six kinds of records Lincoln and Guba recommend, how much a product or UX study needs, how to keep a decision log, how a colleague can audit it, and a reusable checklist.