Flowchart
Did they really finish the task?
A three-question check to run on every participant before you report a usability completion rate
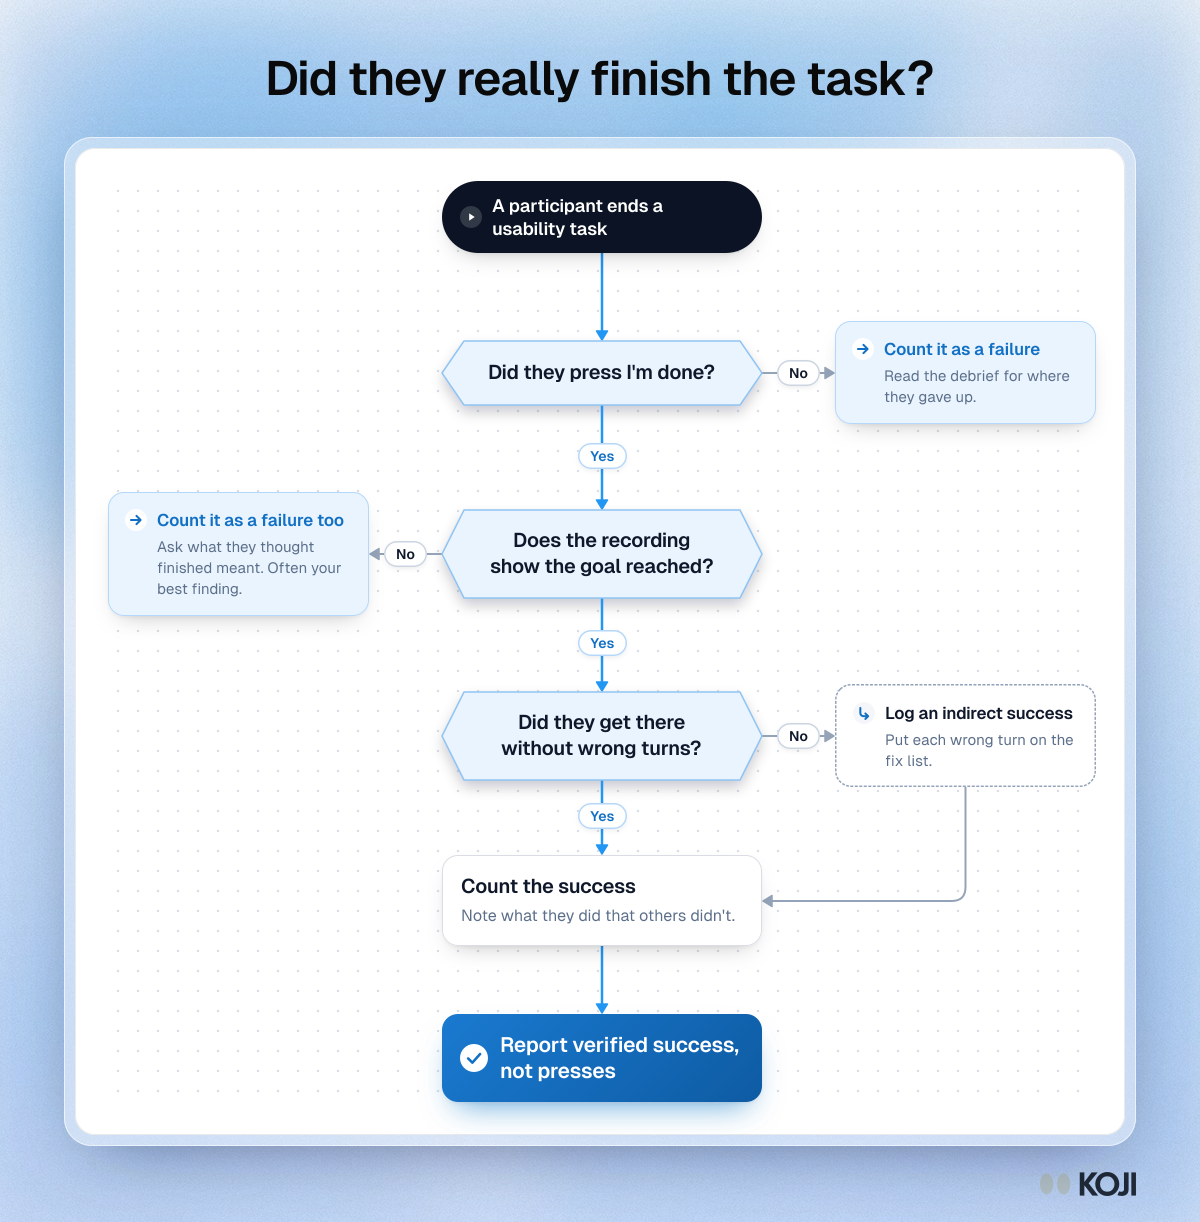
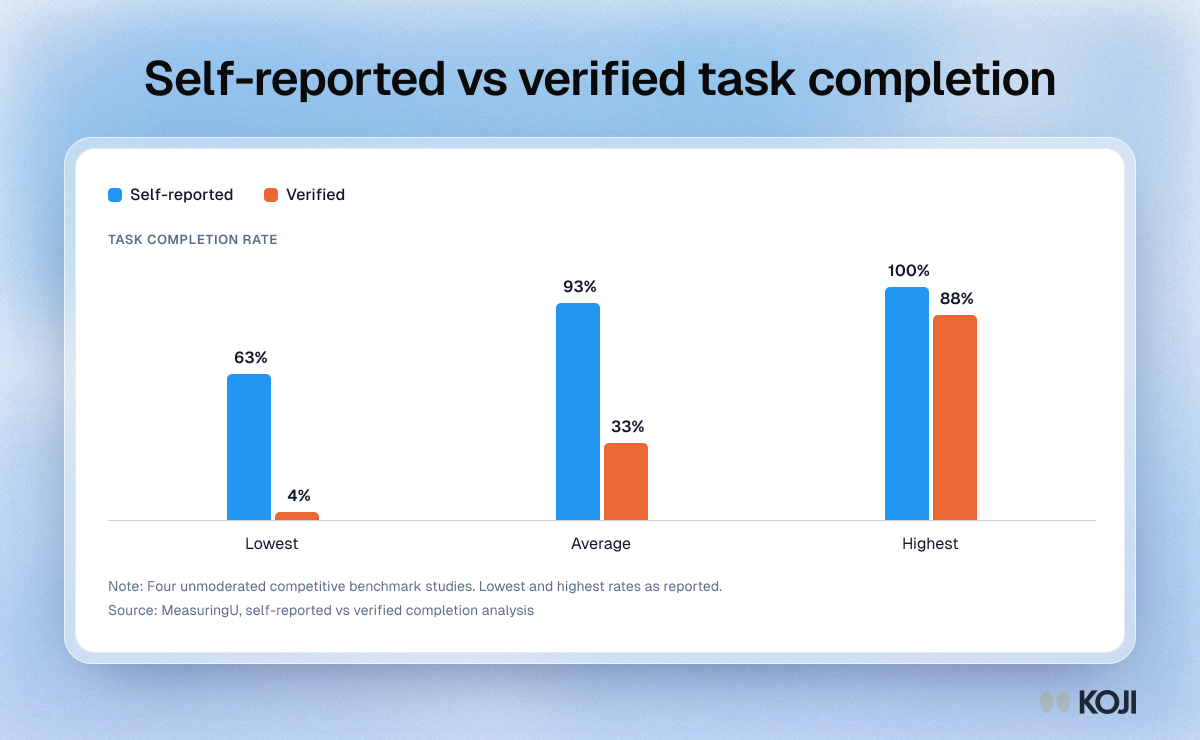
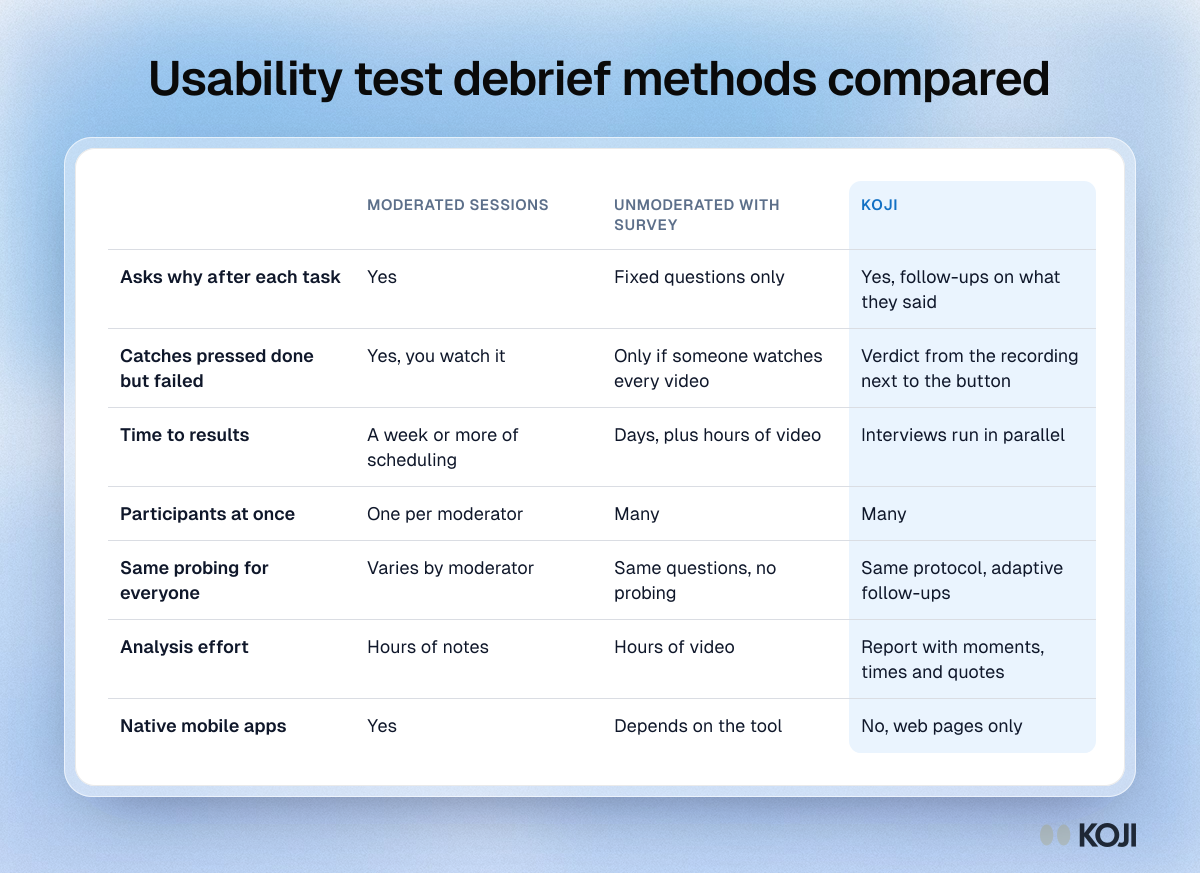
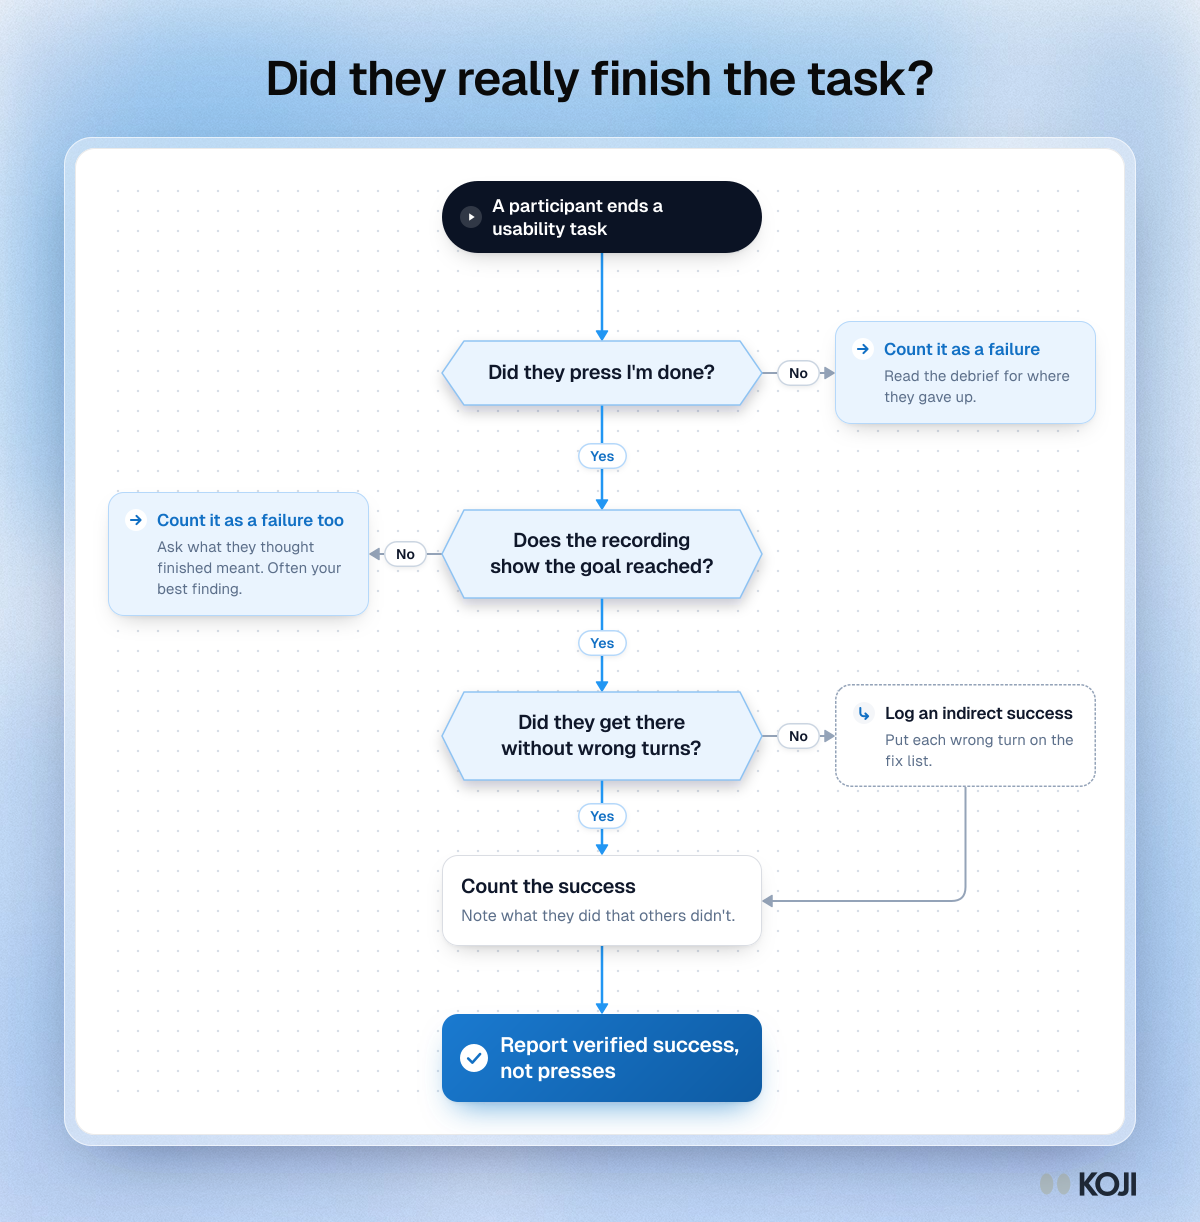
A decision flowchart for UX researchers counting task success in a usability test. It checks the button the participant pressed against what the screen recording shows, then separates direct from indirect success, so false successes are counted as failures. Use it before you put a completion rate in a readout. In Koji, the task details show the verdict from the recording next to the button pressed.
Where this appears
What's in this flowchart
Start: A participant ends a usability task
- Did they press I'm done?
- Yes: go to 2.
- No: Count it as a failure. Read the debrief for where they gave up.
- Does the recording show the goal reached?
- Yes: go to 3.
- No: Count it as a failure too. Ask what they thought finished meant. Often your best finding.
- Did they get there without wrong turns?
- Yes: go to 4.
- No: Log an indirect success. Put each wrong turn on the fix list. Then go to 4.
- Count the success. Note what they did that others didn't.
- Finish: Report verified success, not presses.
Use this image
Free to use in your docs, decks and posts under CC BY 4.0, as long as you credit Koji with a link to this page. To embed it, paste this into your page:
html
<a href="https://www.koji.so/visuals/did-they-really-finish-the-task-flowchart"><img src="https://www.koji.so/visuals/did-they-really-finish-the-task-flowchart/did-they-really-finish-the-task-flowchart.png" alt="Flowchart for counting usability task success: did they press done, does the recording show the goal reached, and were there wrong turns." width="1200" height="1222" /></a>
<p>Source: <a href="https://www.koji.so/visuals/did-they-really-finish-the-task-flowchart">Did they really finish the task?</a>, Koji</p>