Column chart
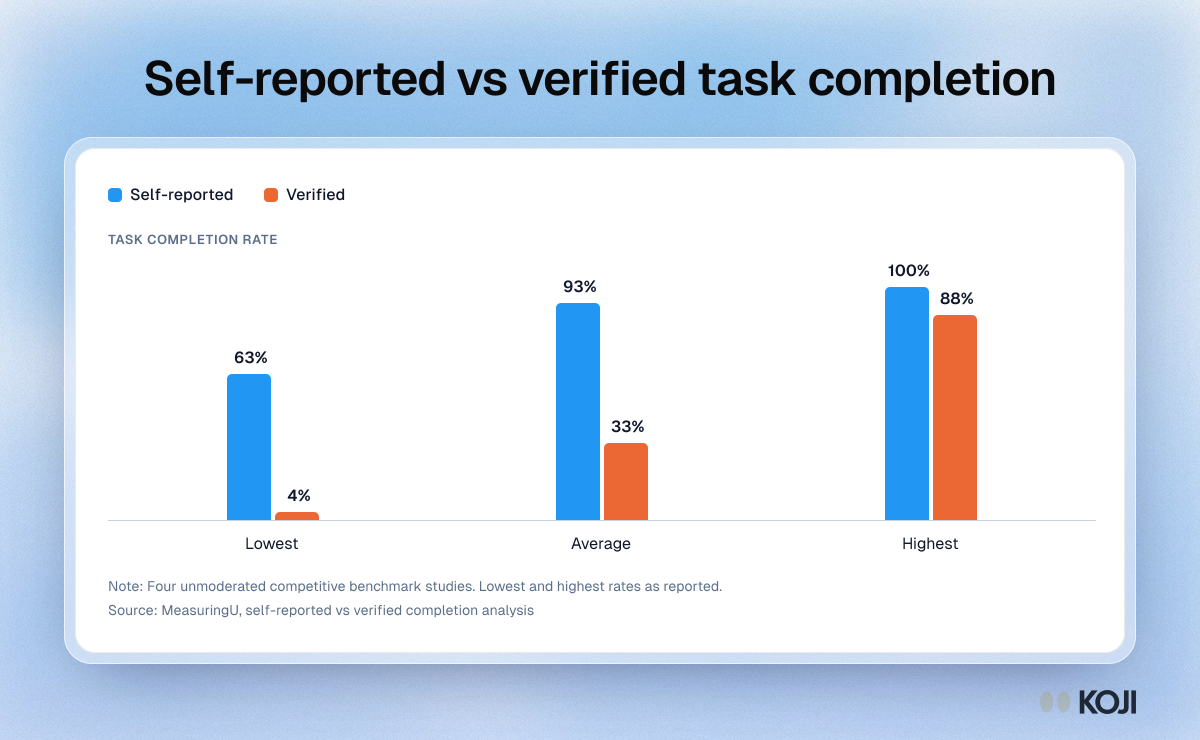
Self-reported vs verified task completion
What participants said about their own success, against what they actually did
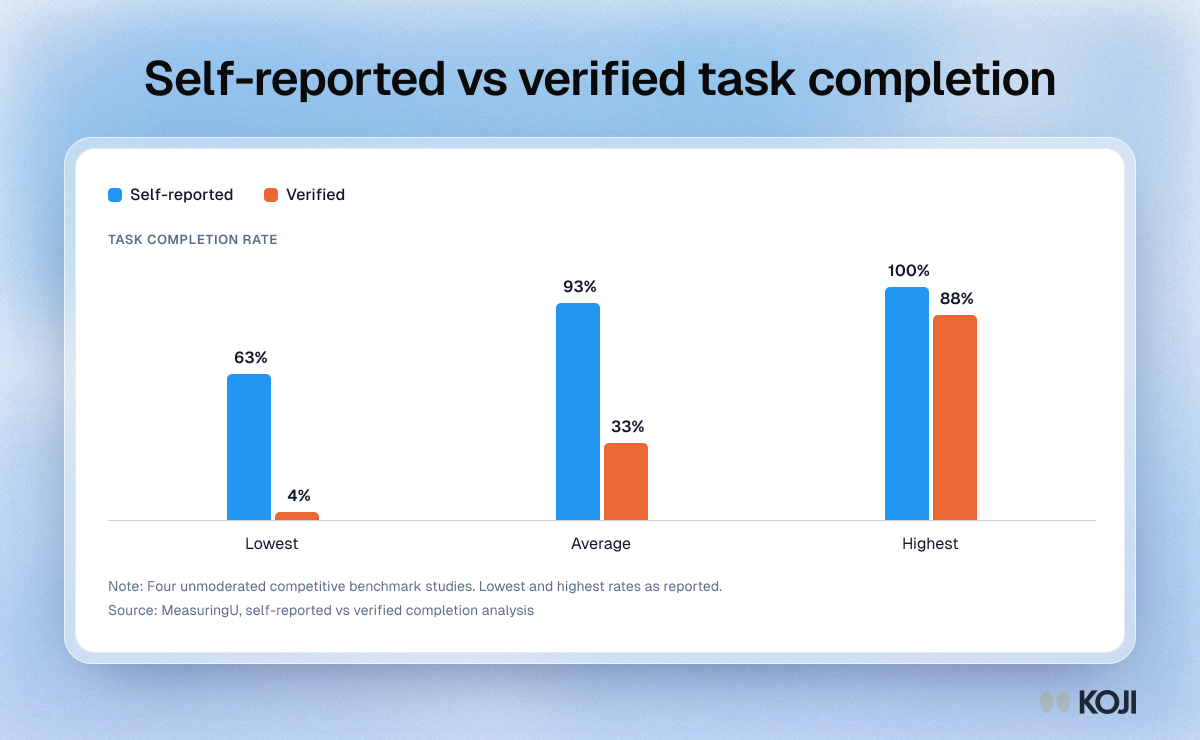
Compares self-reported and verified task completion rates from a MeasuringU analysis of four unmoderated competitive benchmark studies: an average of 93% self-reported against 33% verified, with the lowest and highest rates for each. For UX researchers deciding how to count success in an unmoderated usability test. Koji puts a verdict from the screen recording next to the button each participant pressed, so the gap shows up in the results.
Where this appears
What's in this column chart
| Self-reported | Verified | |
|---|---|---|
| Lowest | 63% | 4% |
| Average | 93% | 33% |
| Highest | 100% | 88% |
Four unmoderated competitive benchmark studies. Lowest and highest rates as reported.
Use this image
Free to use in your docs, decks and posts under CC BY 4.0, as long as you credit Koji with a link to this page. To embed it, paste this into your page:
<a href="https://www.koji.so/visuals/self-reported-vs-verified-task-completion"><img src="https://www.koji.so/visuals/self-reported-vs-verified-task-completion/self-reported-vs-verified-task-completion.png" alt="Column chart of self-reported vs verified task completion in four unmoderated studies: average 93% said, 33% verified, lowest 63% vs 4%." width="1200" height="740" /></a>
<p>Source: <a href="https://www.koji.so/visuals/self-reported-vs-verified-task-completion">Self-reported vs verified task completion</a>, Koji</p>