Reference table
User research operating budget by ARR stage
Incentives, panels, tools and transcription, not counting salaries
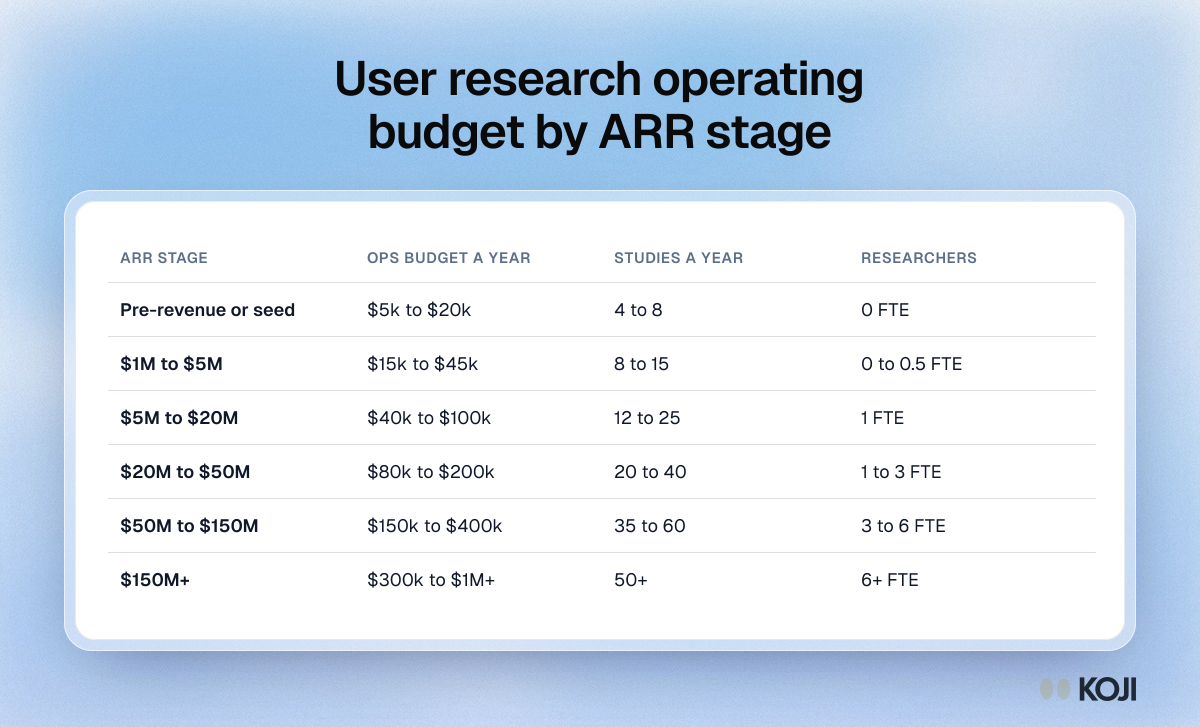
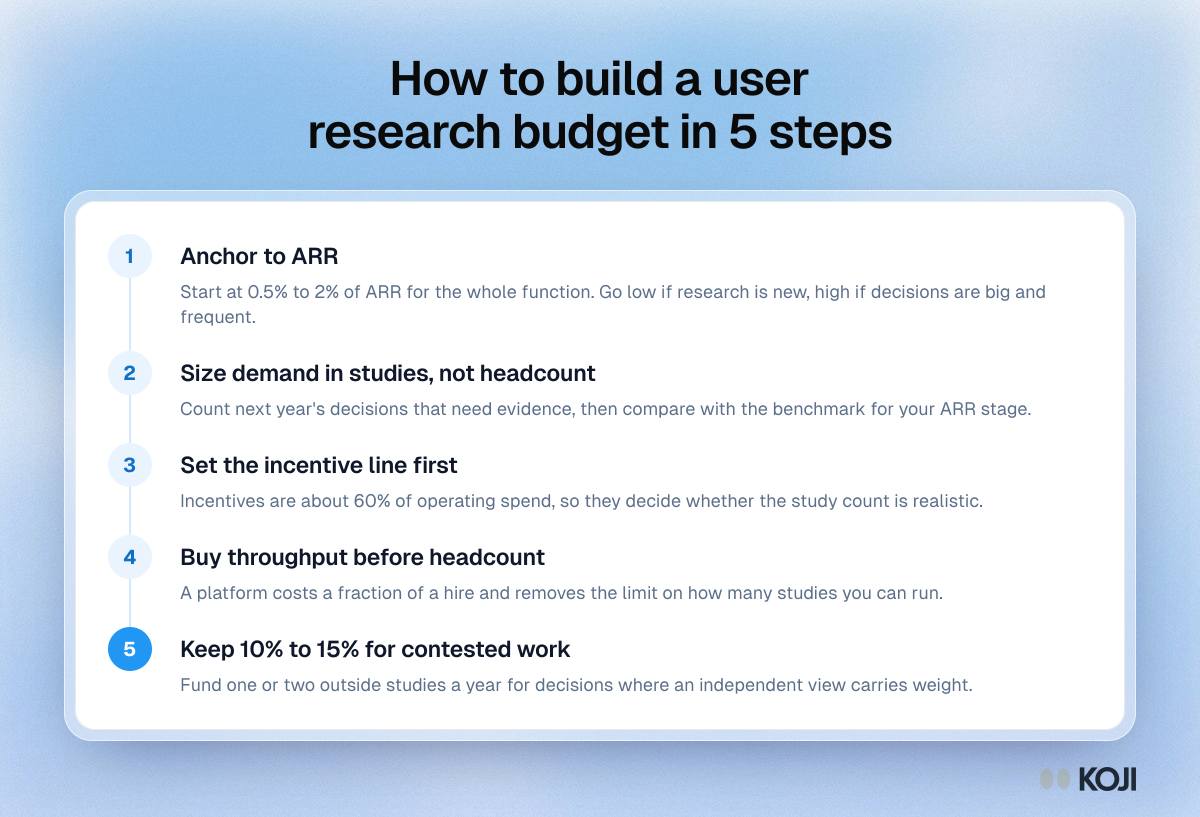
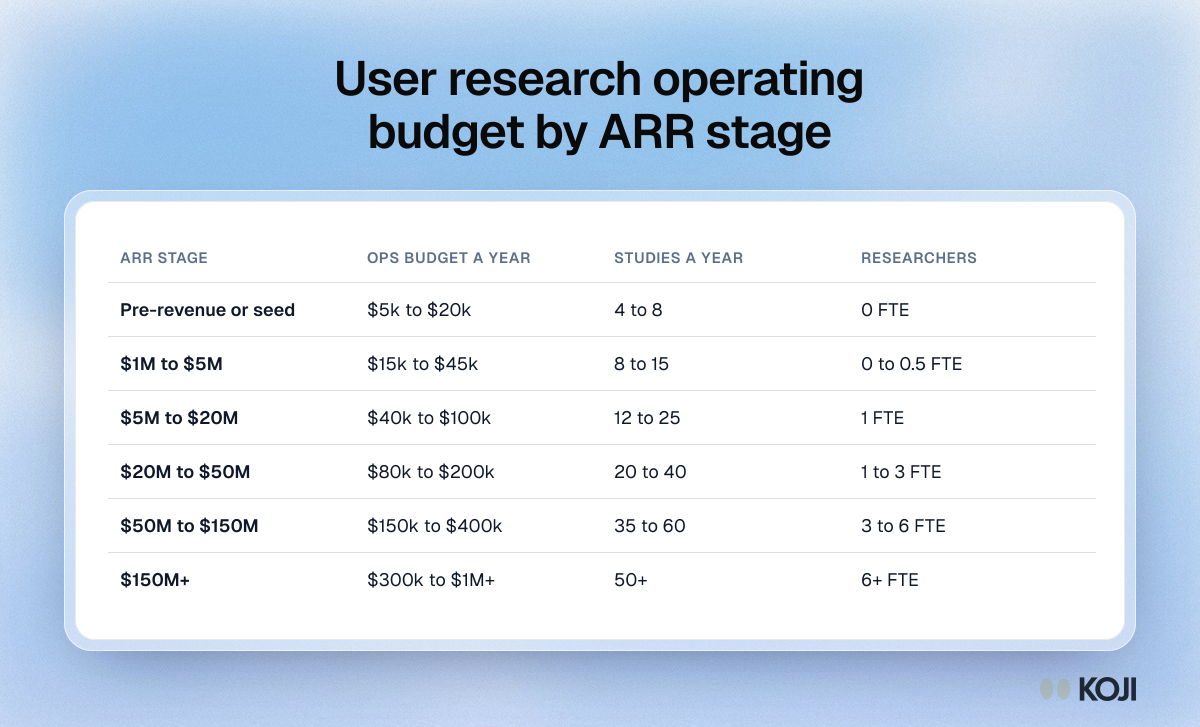
A benchmark table of what a user research function spends each year outside salaries, from pre-revenue startups to companies past $150M ARR, with the number of studies and researchers each stage usually supports. Use it when you set or defend a research budget. Note how many studies one researcher is expected to run at $5M to $20M ARR: that volume only works if moderation and analysis are not done by hand, which is where a platform like Koji comes in.
Where this appears
What's in this reference table
| ARR stage | Ops budget a year | Studies a year | Researchers |
|---|---|---|---|
| Pre-revenue or seed | $5k to $20k | 4 to 8 | 0 FTE |
| $1M to $5M | $15k to $45k | 8 to 15 | 0 to 0.5 FTE |
| $5M to $20M | $40k to $100k | 12 to 25 | 1 FTE |
| $20M to $50M | $80k to $200k | 20 to 40 | 1 to 3 FTE |
| $50M to $150M | $150k to $400k | 35 to 60 | 3 to 6 FTE |
| $150M+ | $300k to $1M+ | 50+ | 6+ FTE |
Use this image
Free to use in your docs, decks and posts under CC BY 4.0, as long as you credit Koji with a link to this page. To embed it, paste this into your page:
html
<a href="https://www.koji.so/visuals/user-research-ops-budget-by-arr-stage"><img src="https://www.koji.so/visuals/user-research-ops-budget-by-arr-stage/user-research-ops-budget-by-arr-stage.png" alt="Table of yearly user research operating budget by company ARR stage, with typical studies a year and researcher headcount for each stage." width="1200" height="727" /></a>
<p>Source: <a href="https://www.koji.so/visuals/user-research-ops-budget-by-arr-stage">User research operating budget by ARR stage</a>, Koji</p>