The short answer: most research tools will give you a link or a PDF. Fewer give you a real PowerPoint deck, and fewer still give you one with charts you can edit. Before you pick a tool on its export, download a sample deck and check three things: are the charts native charts or pictures, does each claim carry its quote, and how many slides would you still rebuild by hand. That last number is the real cost.
This guide compares the routes a founder, PM or designer has for turning interview findings into slides: doing it by hand, using a repository or survey tool's export, and using a tool that builds the deck from the analysis. It covers what each produces as of November 2026, what you still rebuild, and how Koji's deck download fits.
Why the export matters more than it looks
Research that stays in a tool does not change decisions. The deck is what reaches the board, the investor update or the planning meeting, so the export is where the work either travels or stalls.
Two numbers explain why this keeps coming up:
- The people carrying findings are rarely researchers. In Maze's Future of User Research Report 2024, product designers (61%), product managers (38%) and marketers (17%) said they run user research at their companies. They present to people who live in slides.
- Slides eat time. Empower's Big PowerPoint Study (a presentation software vendor's global survey of office workers) puts the typical employee at about 7 hours a week in PowerPoint, with roughly 37% of that time spent on formatting.
And teams know sharing is the weak spot. In User Interviews' State of User Research 2025, 71% of respondents said they grew their practice that year by trying new ways of sharing research insights. That's more than the 64% who pointed to collaborating with others on research.
The three routes, side by side
1. Build the deck by hand. Copy quotes from transcripts, screenshot charts, write titles. You get full control and a deck in your company template. You also get charts that are pictures, which means a number can't be fixed without going back to the tool, and a few hours per study.
2. Export pieces from a repository or survey tool. Repository tools are built to store and tag evidence, and most let you move pieces of it into slides. Survey suites tend to export a whole report.
3. Download a deck built from the analysis. A newer group of AI interview tools generate the slides from the study itself: a cover, the findings, the charts and the quotes.
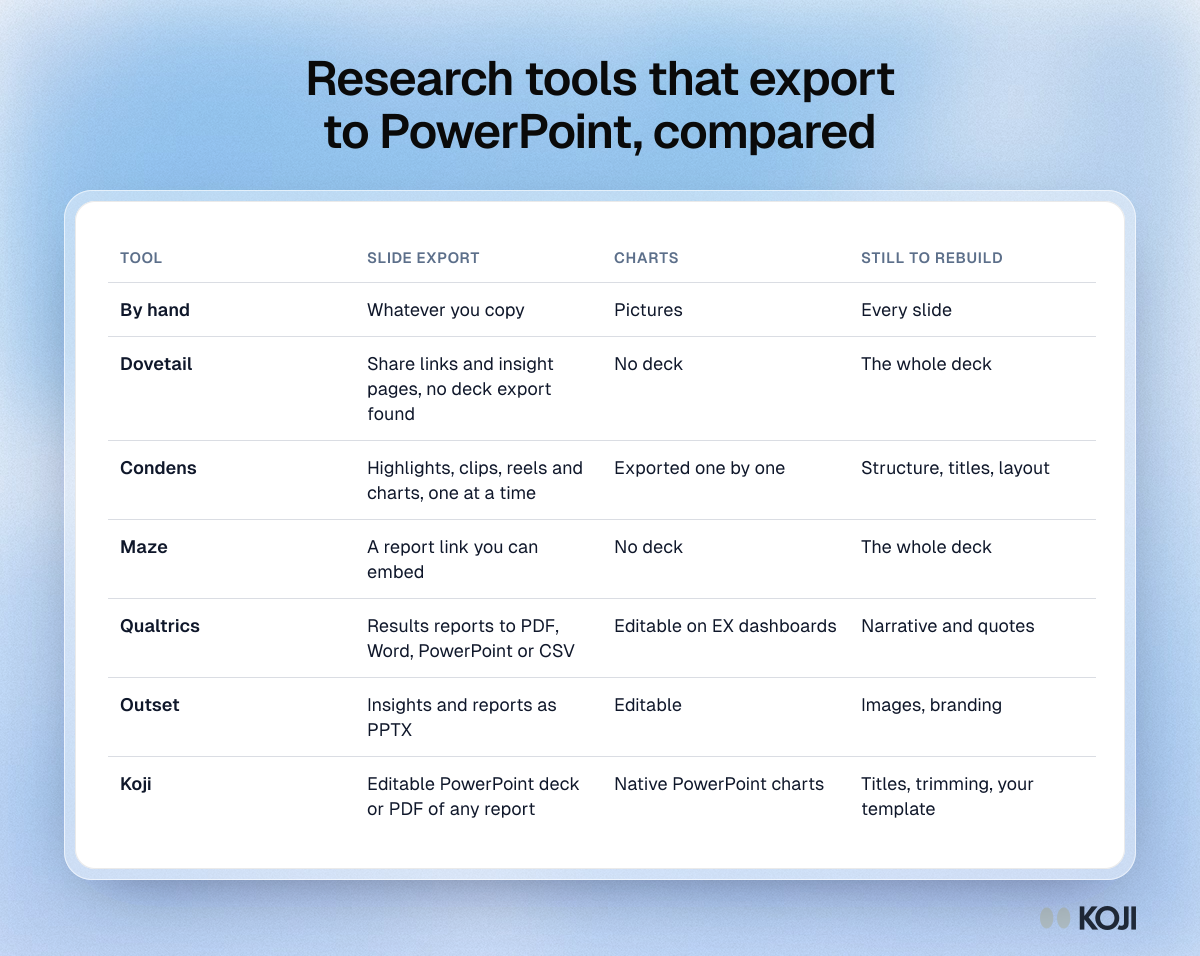
Here's what each tool's own documentation says, checked in November 2026. Features change often, so test an export on your own study before you commit.
| Tool | What you can export for a presentation | Charts in the deck | What you still rebuild |
|---|---|---|---|
| Doing it by hand | Anything you copy | Pictures (screenshots) | Every slide |
| Dovetail | Share links and insight pages. We found no PowerPoint export in its help docs, and a request for one sits on Dovetail's public feedback board | No deck | The whole deck |
| Condens | Highlights you drag or paste into slides, exported clips, highlight reels and charts. Google Slides decks can be embedded inside Condens | Exported one by one | Structure, titles, layout |
| Maze | A shareable report link you can embed in other tools | No deck | The whole deck |
| Qualtrics | Results reports to PDF, Word, PowerPoint or CSV. Its dashboards (EX) offer an "editable PPTX" option | Editable on EX dashboards. For Results reports, the docs don't say | Narrative and quotes |
| Outset | Insights and reports as PPTX, with text, charts and image placeholders, all editable in PowerPoint per its help centre | Editable | Images, branding |
| Koji | An editable PowerPoint deck or a PDF of any study report | Native PowerPoint charts | Titles, trimming, your template |
A note on fairness: repository tools like Dovetail and Condens are built for long-term evidence storage across many studies, and that's a different job from producing a readout. If you already have a repository you like, the hand-built route on top of it is a fine choice. The comparison above only covers how quickly findings turn into slides.
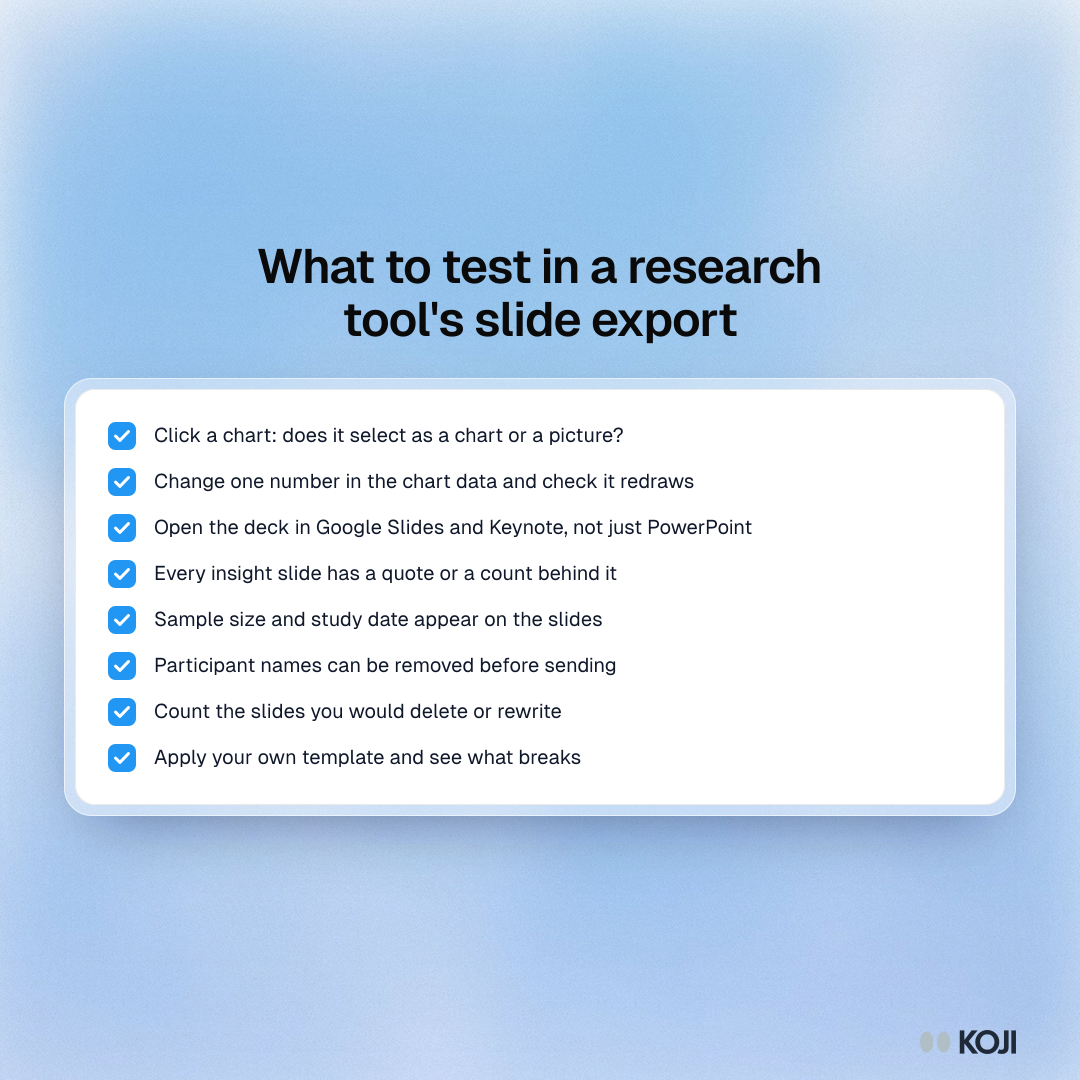
What to test in any export
Download a sample deck from each tool on your shortlist and open it in the tool your audience uses. It takes about ten minutes per tool and tells you more than any feature page.
- Click a chart. If it selects as a picture, you can't fix a label or a number without going back.
- Change one number in a chart's data. It should redraw.
- Open the deck in Google Slides and Keynote as well as PowerPoint, if anyone you send it to uses them.
- Check each insight slide for a quote or a count behind it. A claim with no evidence will get questioned in the room.
- Look for the sample size and the date of the study on the slides.
- Check names. Do quotes carry a participant's real name, and can you remove it before sending?
- Count the slides you would delete or rewrite. Over half means the export is a starting point, not a deck.
- Apply your own template and see what breaks.
Who the deck is for, and what that changes
The right export depends on who opens it.

Photo by Flipsnack on Unsplash
- A board or investors want three to five findings, the sample, and what you will do about it. A PDF is safer here: it looks the same everywhere and nobody edits it by accident. Our 7-slide customer research readout shows the structure.
- Your own team at a planning meeting needs to argue with the findings. Editable slides win, because the PM will cut, merge and re-title slides for their roadmap.
- A client, if you run an agency, expects your branding. Editable charts matter most here, since you'll restyle every one of them.
- Someone who will read it later, alone, is better served by a link to the full report than by any deck. Koji's publishing and sharing guide covers that route.
For more on structure and delivery, see presenting research findings.
How Koji's deck download works
Koji runs AI-moderated voice and text interviews, analyses them, and writes a report for each study. Every report has a download menu with two options.
PowerPoint. An editable deck that opens in PowerPoint, Keynote and Google Slides. It follows the report:
- A cover with the study's cover photo, title and participant count
- An at-a-glance slide: who took part and the headline numbers
- An executive summary
- One slide per key insight (up to eight), each with a supporting quote from a participant
- One slide per question, with the summary beside a native PowerPoint chart: bars, doughnuts and distributions you can restyle or edit
- Persona slides, when the study found personas
- Recommendations, three to a slide
PDF. The full report as you see it in Koji, laid out on A4, ready to attach.
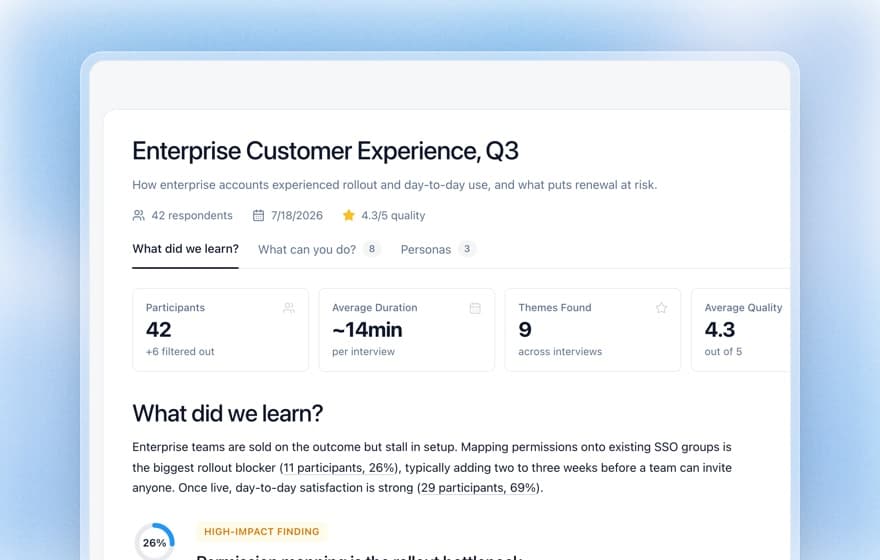
You can change the cover photo and the report title on the report itself before you download, so the deck opens with a headline that says what you found.
What you still do. The deck is a strong first draft, not a finished board pack. Read every insight against its quotes, cut the slides your audience doesn't need, add the limits of the study, and move it into your template if you have one. Quote slides show who said each quote, so check for names before the deck leaves your team, and see anonymizing customer interview data for how to handle them.
If you want to try it on a real study, the guide to generating research reports walks through the report, and exporting research data covers raw transcripts and CSVs if you'd rather build your own charts.
Which route fits you
- You run one or two studies a quarter and have a company template: hand-built is fine. Keep the tool for analysis.
- You already rely on a repository: keep it, and budget the hours for slides, or pair it with a tool that drafts the deck.
- You run surveys at scale: a survey suite's export covers the charts. You'll add the reasons by hand.
- You run interviews and need a readout this week: use a tool that builds the deck from the analysis, then edit. That's the gap Koji's download closes.
Try it on your next study
Start a free Koji account, run a short interview study, and download the report as slides when the first interviews are in. You'll see the native charts and the quote on every insight slide, and you can judge the edit time yourself. Start from the Koji homepage.
Frequently Asked Questions
Which user research tools export to PowerPoint?
Of the tools we checked in November 2026, Qualtrics exports Results reports to PowerPoint, Outset exports insights and reports as PPTX, and Koji downloads any study report as an editable PowerPoint deck. Condens lets you move highlights, clips and charts into slides one at a time. We found no PowerPoint export in Dovetail's or Maze's help docs.
Are the charts in exported research decks editable?
It depends on the tool. Outset says everything in its export is editable in PowerPoint, Qualtrics offers an editable PPTX option for dashboards, and Koji's decks use native PowerPoint charts. Charts copied by hand or from screenshots are pictures. Click a chart in a sample export: if it selects as an image, you can't change its numbers.
Should I send research findings as a PDF or a deck?
Send a PDF to a board, investors or anyone who should read it as is, because it looks the same everywhere. Send editable slides to your own team or a client who'll reuse the findings in their own decks. For someone reading alone later, a link to the full report keeps every quote one click away.
Can I open a Koji report deck in Google Slides or Keynote?
Yes. The PowerPoint download opens in PowerPoint, Keynote and Google Slides, and its charts stay editable. You can also download the report as a PDF.
What should I check before sending an exported research deck?
Check every insight against its quote, add the sample size and the study's limits, remove participant names if the audience shouldn't see them, cut slides the audience doesn't need, and rewrite titles so each one states a finding.