Bar chart
False results in A/A tests, by how often you look
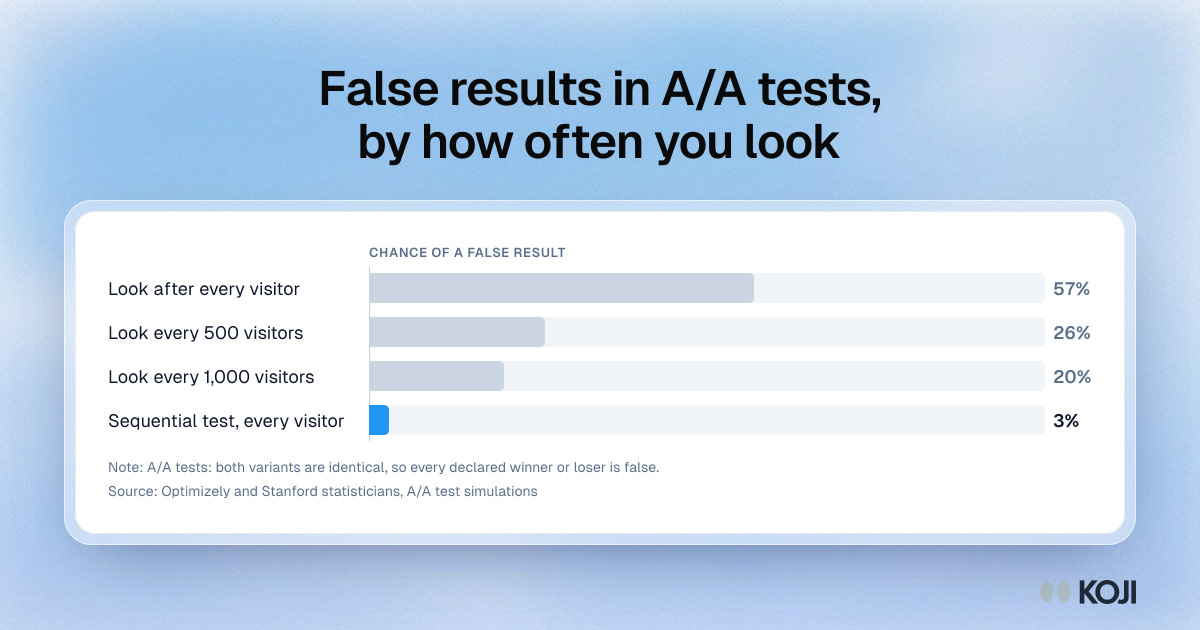
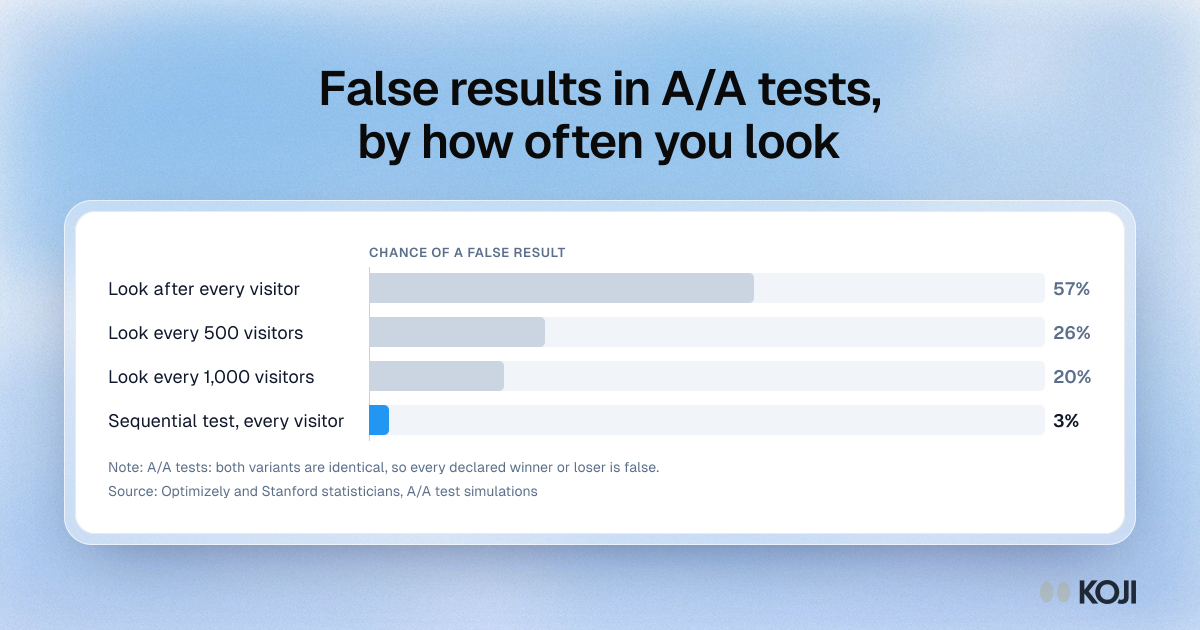
Bar chart from A/A test simulations Optimizely ran with Stanford statisticians, where both variants were identical so any declared winner or loser was false. Checking after every visitor gave a 57% chance of a false result, every 500 visitors 26% and every 1,000 visitors 20%. A sequential test checked after every visitor brought it down to 3%. Worth showing anyone who watches a live experiment dashboard.
Where this appears
What's in this bar chart
| False winner or loser | |
|---|---|
| Look after every visitor | 57% |
| Look every 500 visitors | 26% |
| Look every 1,000 visitors | 20% |
| Sequential test, every visitor | 3% |
A/A tests: both variants are identical, so every declared winner or loser is false.
Use this image
Free to use in your docs, decks and posts under CC BY 4.0, as long as you credit Koji with a link to this page. To embed it, paste this into your page:
<a href="https://www.koji.so/visuals/aa-test-false-result-rate-by-peeking-frequency"><img src="https://www.koji.so/visuals/aa-test-false-result-rate-by-peeking-frequency/aa-test-false-result-rate-by-peeking-frequency.png" alt="Bar chart of false results in A/A tests: 57% when checking after every visitor, 26% every 500, 20% every 1,000 and 3% with a sequential test" width="1200" height="630" /></a>
<p>Source: <a href="https://www.koji.so/visuals/aa-test-false-result-rate-by-peeking-frequency">False results in A/A tests, by how often you look</a>, Koji</p>
Related
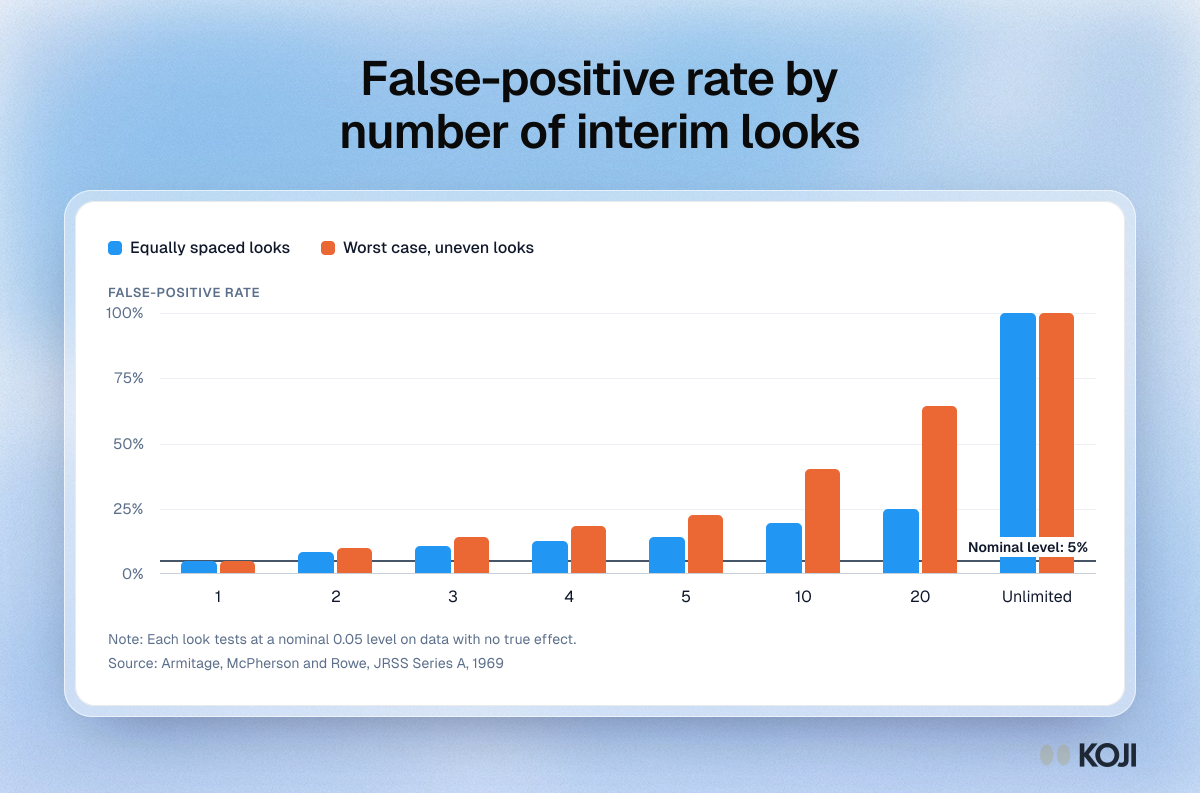
False-positive rate by number of interim looks
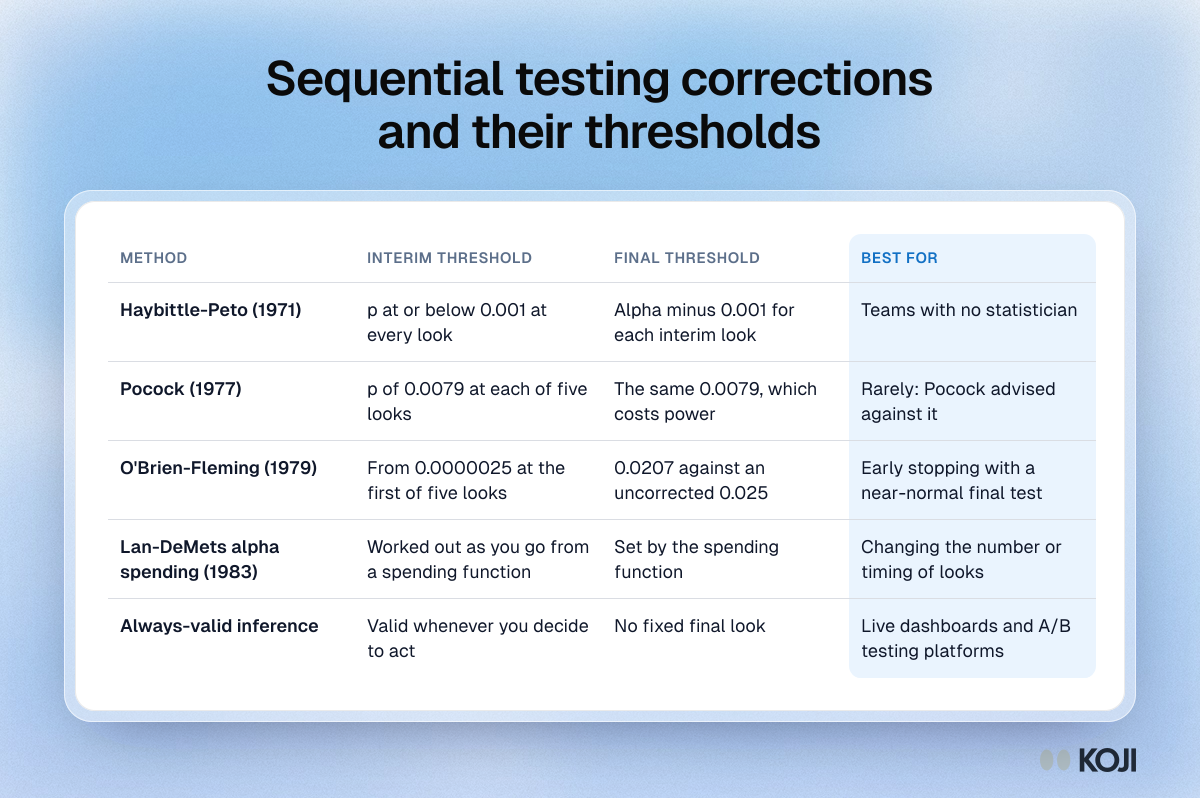
Sequential testing corrections and their thresholds
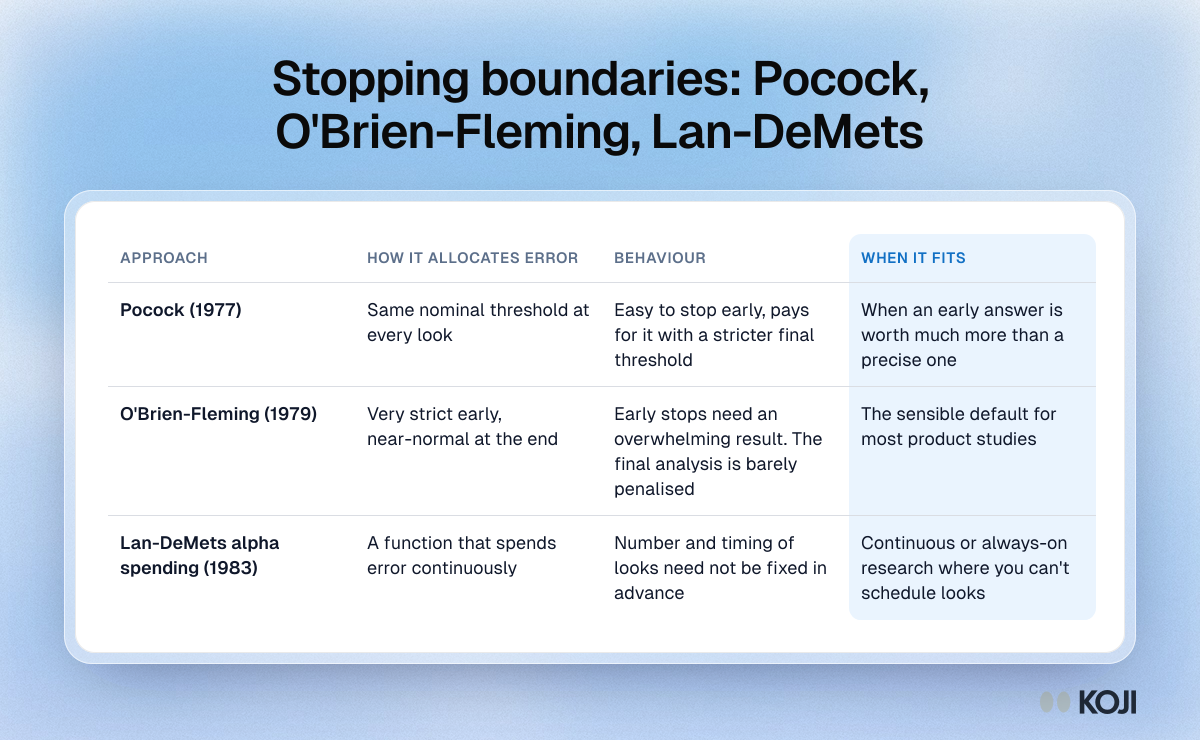
Stopping boundaries: Pocock, O'Brien-Fleming, Lan-DeMets
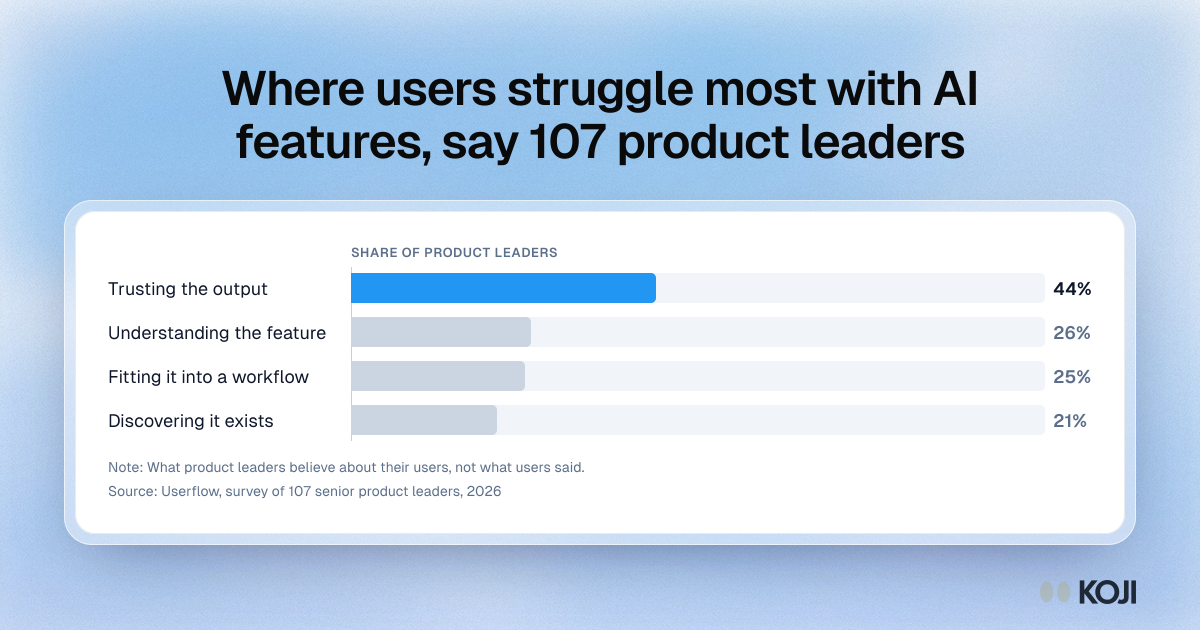
Where users struggle most with AI features, say 107 product leaders
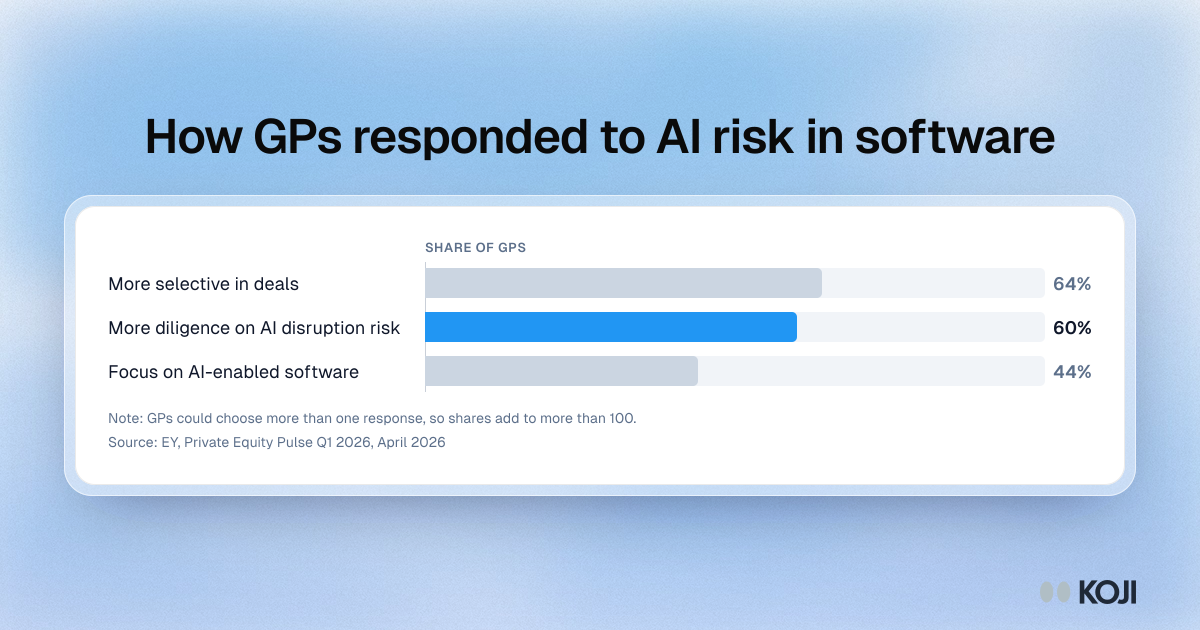
How GPs responded to AI risk in software
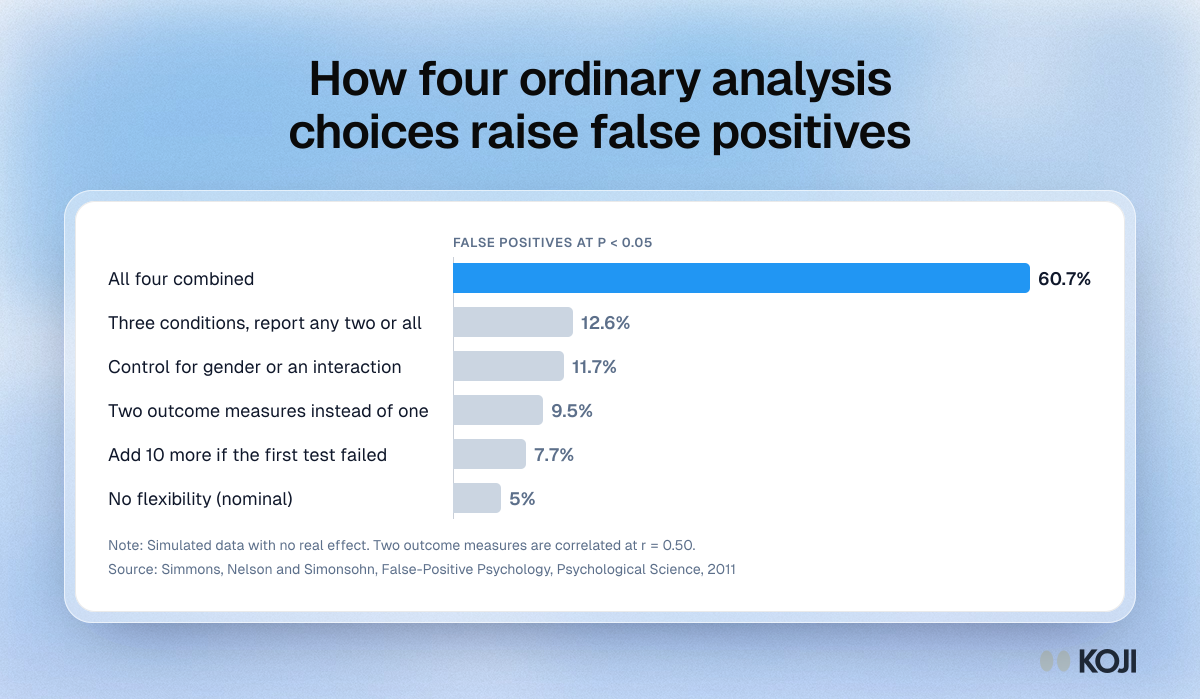
How four ordinary analysis choices raise false positives