Column chart
False-positive rate by number of interim looks
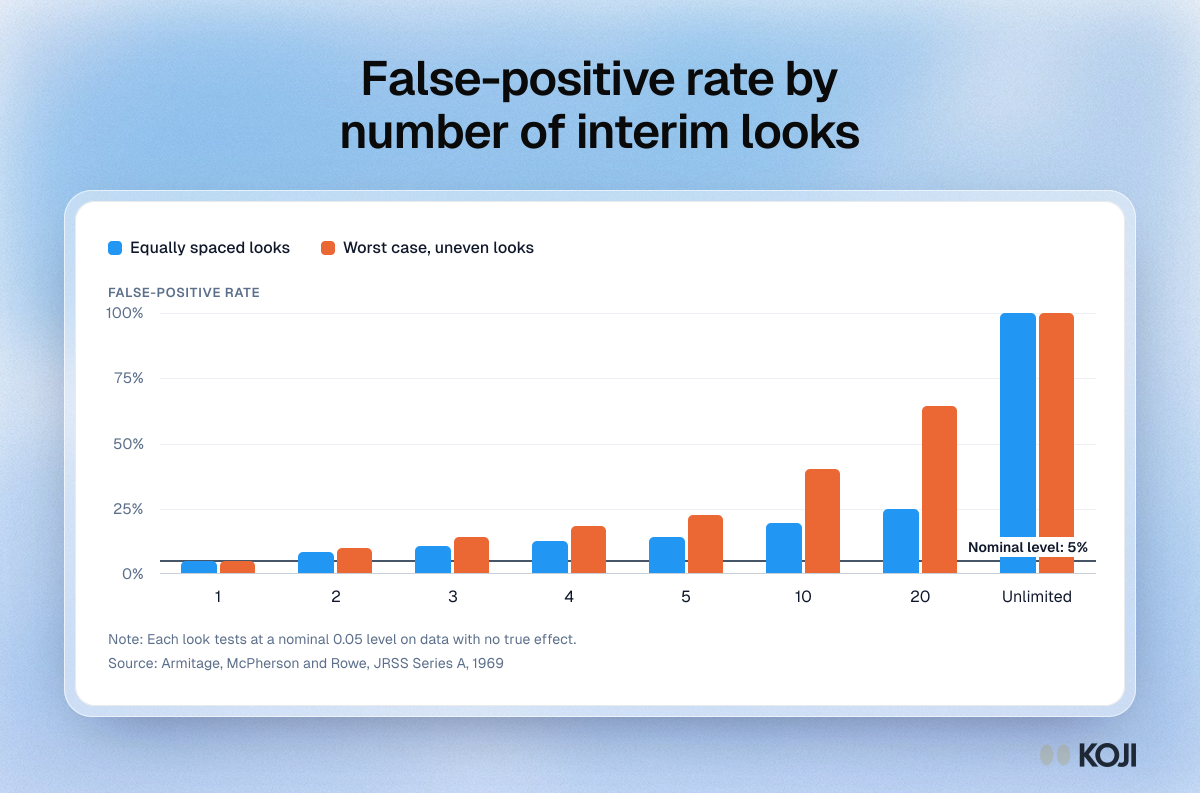
Column chart of how often repeated significance tests on accumulating data find an effect that is not there, from Armitage, McPherson and Rowe's 1969 paper. One look keeps the 5% rate. Two equally spaced looks raise it to 8.3%, twenty to 24.8% and unlimited looks to 100%, and unevenly spaced looks are worse at every step. Use it to explain why a live results dashboard needs a monitoring plan.
Where this appears
What's in this column chart
| Equally spaced looks | Worst case, uneven looks | |
|---|---|---|
| 1 | 5% | 5% |
| 2 | 8.3% | 9.8% |
| 3 | 10.7% | 14.3% |
| 4 | 12.6% | 18.5% |
| 5 | 14.2% | 22.6% |
| 10 | 19.3% | 40.1% |
| 20 | 24.8% | 64.2% |
| Unlimited | 100% | 100% |
Reference line: Nominal level, 5%.
Each look tests at a nominal 0.05 level on data with no true effect.
Use this image
Free to use in your docs, decks and posts under CC BY 4.0, as long as you credit Koji with a link to this page. To embed it, paste this into your page:
<a href="https://www.koji.so/visuals/false-positive-rate-by-number-of-interim-looks"><img src="https://www.koji.so/visuals/false-positive-rate-by-number-of-interim-looks/false-positive-rate-by-number-of-interim-looks.png" alt="Column chart of the false-positive rate as interim looks increase at a nominal 5%: 8.3% with two looks, 24.8% with twenty and 100% with unlimited looks" width="1200" height="793" /></a>
<p>Source: <a href="https://www.koji.so/visuals/false-positive-rate-by-number-of-interim-looks">False-positive rate by number of interim looks</a>, Koji</p>
Related
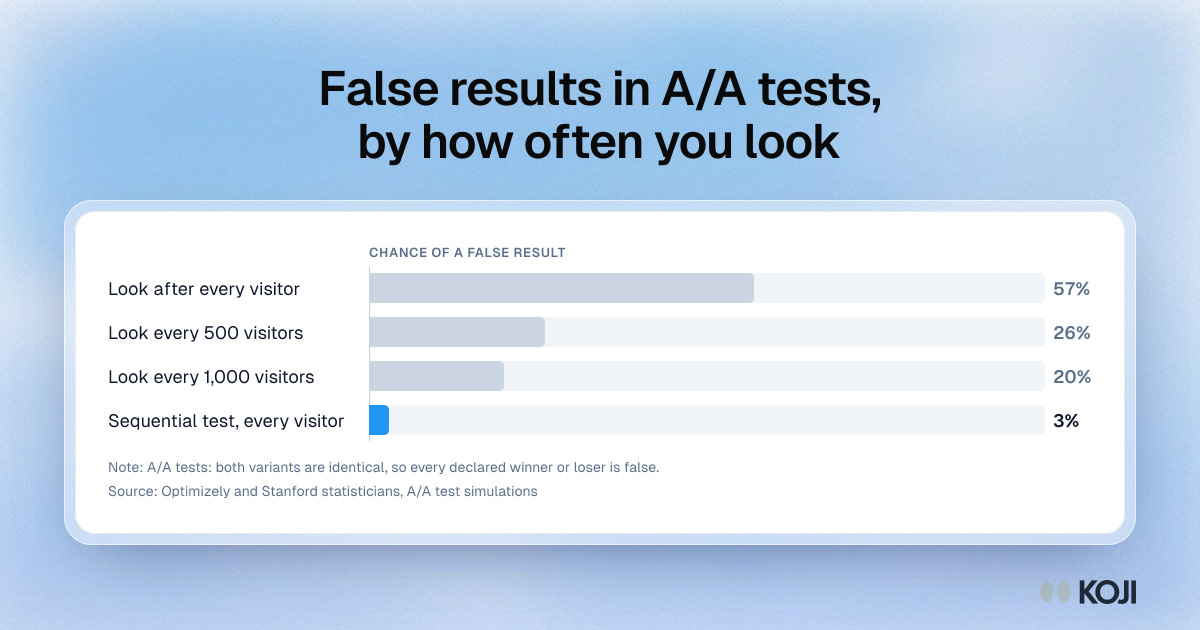
False results in A/A tests, by how often you look
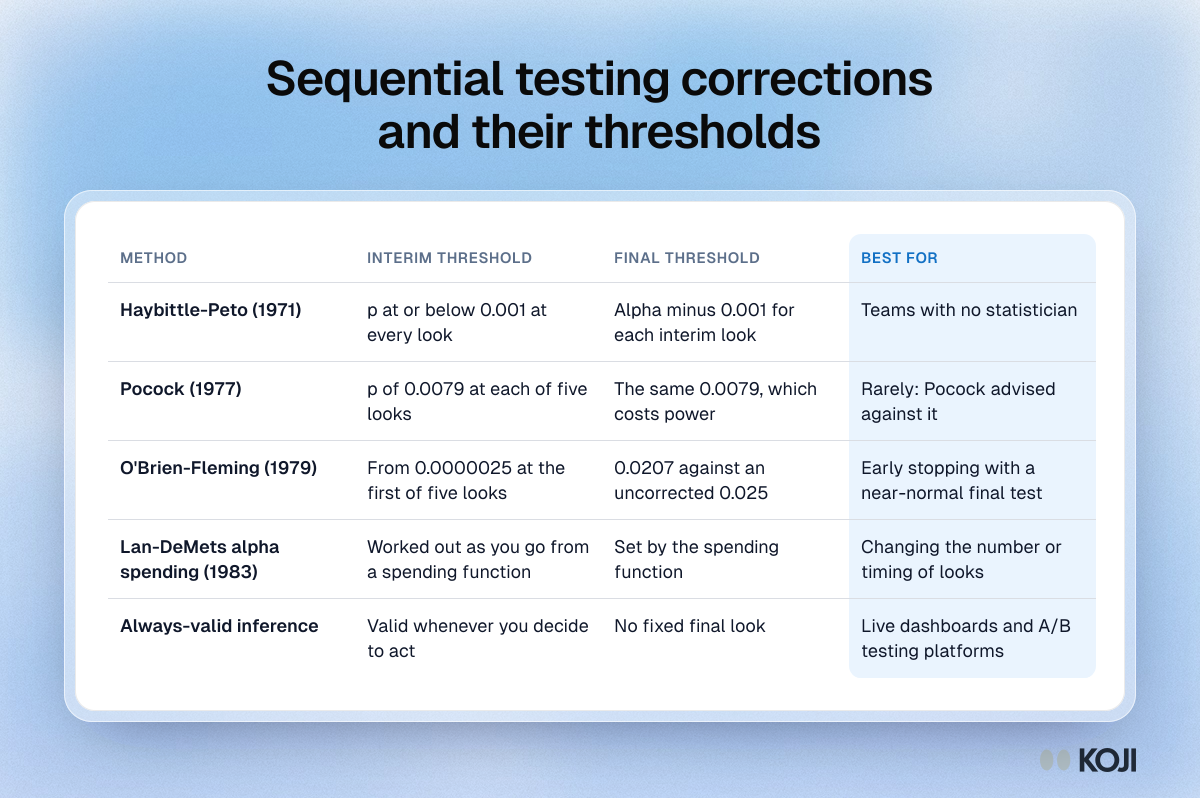
Sequential testing corrections and their thresholds
How many psychologists admit each questionable research practice
Stopping boundaries: Pocock, O'Brien-Fleming, Lan-DeMets
UX researchers working as a team of one, 2019 to 2025
Usability problems found by 5, 10 and 15 users