Column chart
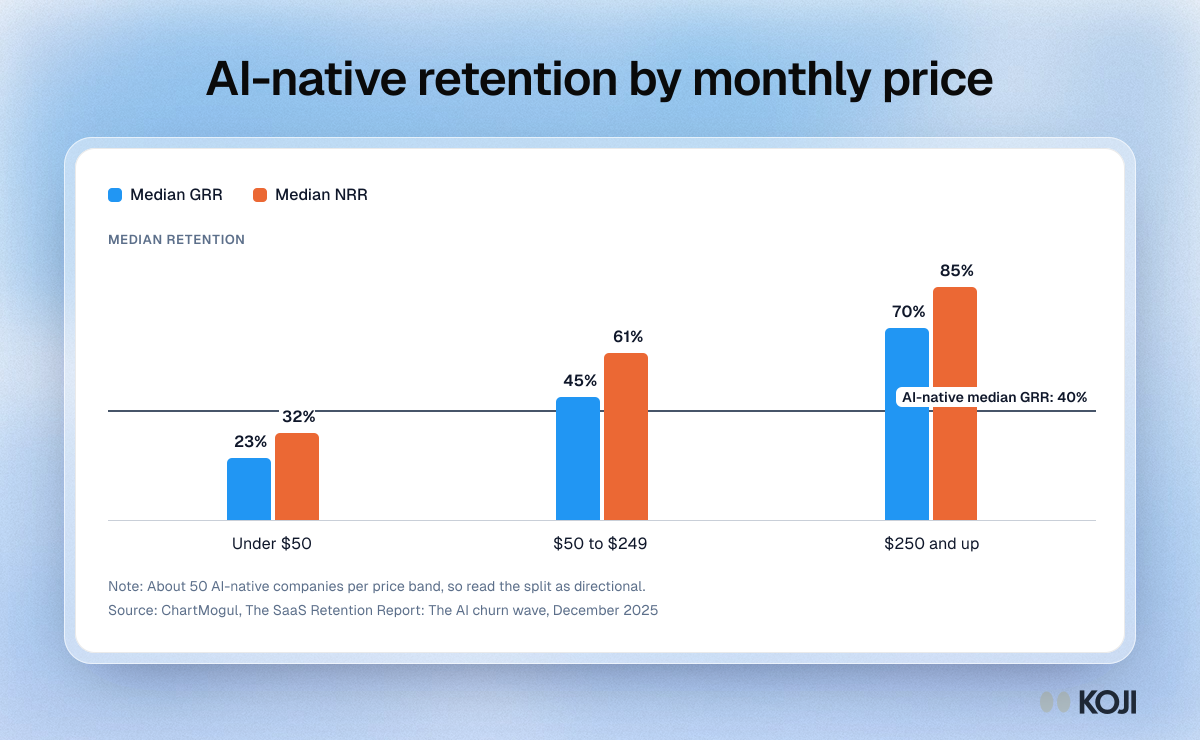
AI-native retention by monthly price
Median gross and net revenue retention for AI-native companies, by monthly list price
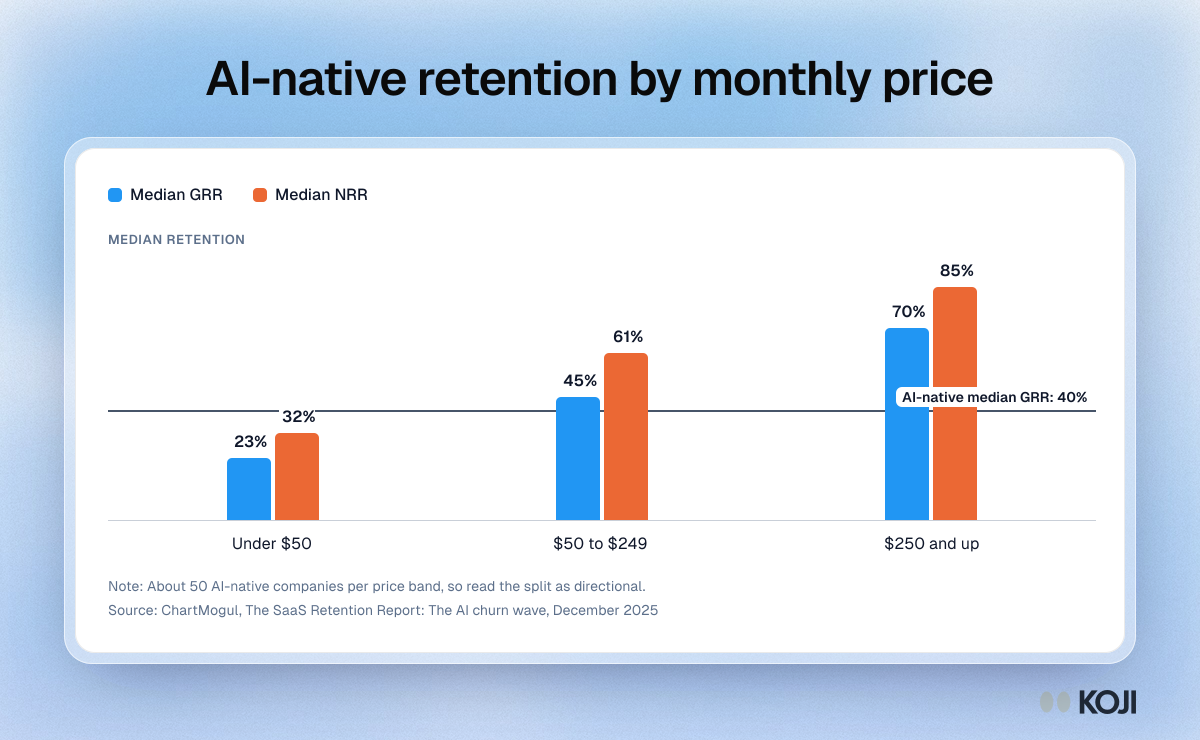
Median gross and net revenue retention for AI-native software companies, split by monthly list price, from ChartMogul's 2025 retention study of about 200 AI-native companies with at least $250k ARR. Cheaper products kept far less revenue. Founders can use it to judge how exposed their plan is when a frontier lab ships an overlapping feature, and Koji helps them interview customers to find out who is actually at risk.
Where this appears
What's in this column chart
| Median GRR | Median NRR | |
|---|---|---|
| Under $50 | 23% | 32% |
| $50 to $249 | 45% | 61% |
| $250 and up | 70% | 85% |
Reference line: AI-native median GRR, 40%.
About 50 AI-native companies per price band, so read the split as directional.
Use this image
Free to use in your docs, decks and posts under CC BY 4.0, as long as you credit Koji with a link to this page. To embed it, paste this into your page:
<a href="https://www.koji.so/visuals/ai-native-retention-by-price-band"><img src="https://www.koji.so/visuals/ai-native-retention-by-price-band/ai-native-retention-by-price-band.png" alt="Column chart of AI-native median retention by monthly price: GRR of 23% under $50, 45% at $50 to $249 and 70% at $250 and up" width="1200" height="740" /></a>
<p>Source: <a href="https://www.koji.so/visuals/ai-native-retention-by-price-band">AI-native retention by monthly price</a>, Koji</p>