Bar chart
How developers rate AI coding tools in 2025
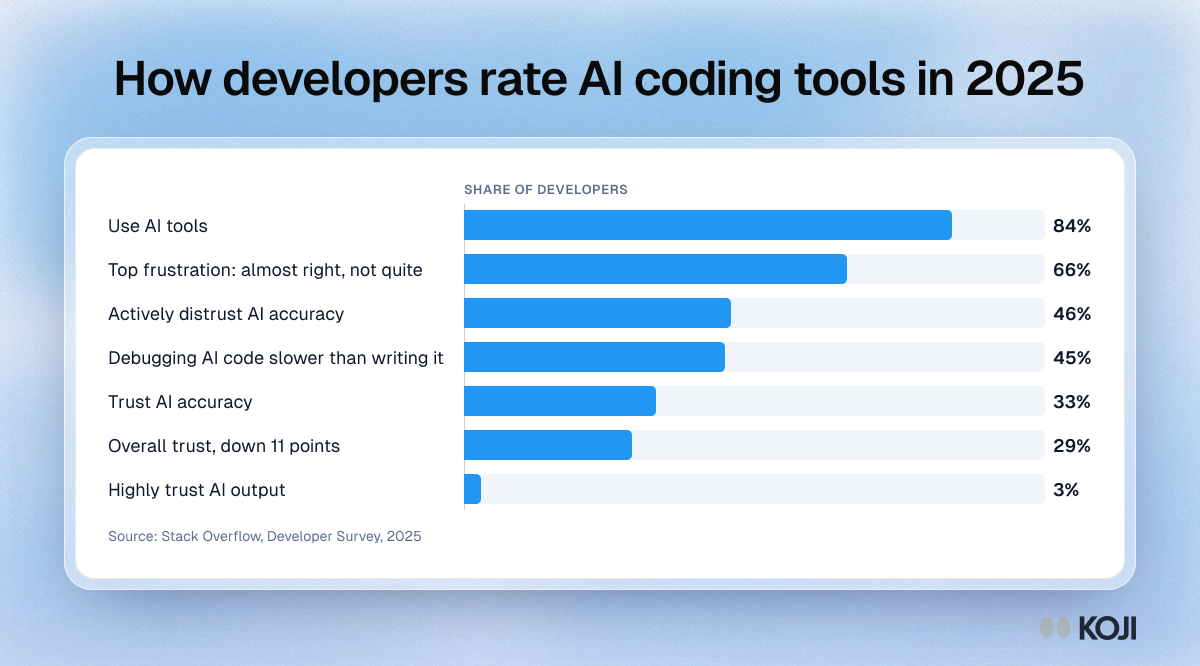
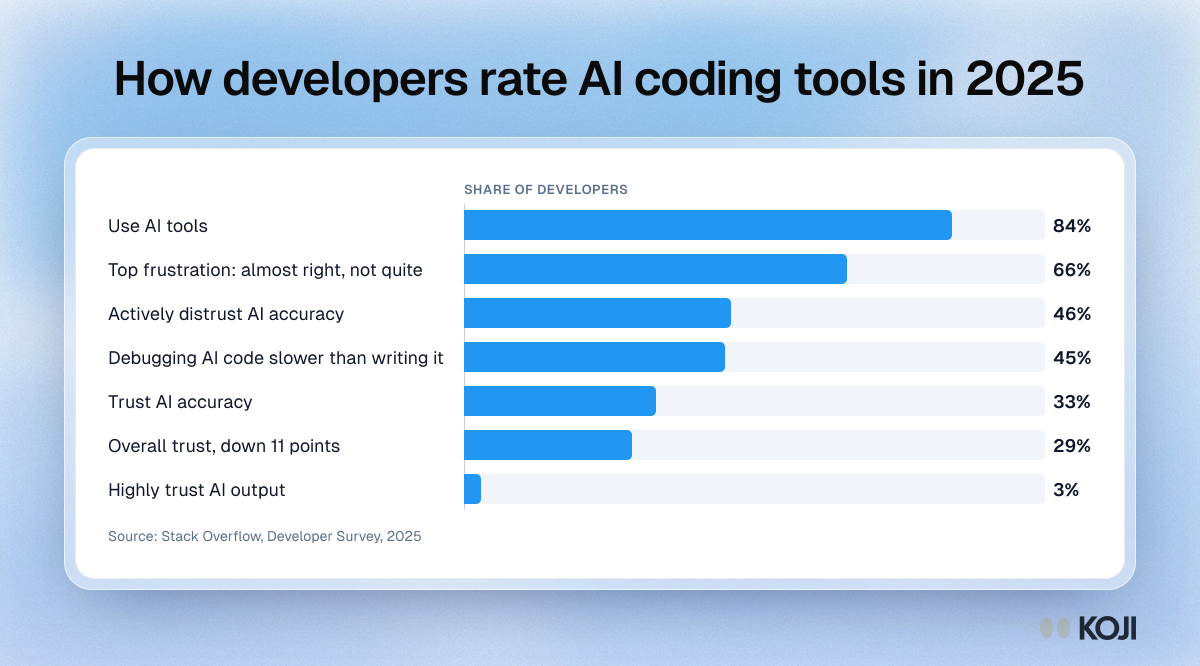
A bar chart of what the 2025 Stack Overflow Developer Survey found about AI coding tools: 84% adoption, 66% frustrated by answers that are almost right, 46% who distrust AI accuracy against 33% who trust it, 45% who find debugging AI code slower, overall trust down 11 points to 29%, and 3% who highly trust the output. Engineering and platform leads can use it to explain why adoption numbers alone say little about value. Koji interviews with engineers can ask for the last time an AI suggestion cost more time than it saved.
Where this appears
What's in this bar chart
| Share of developers | |
|---|---|
| Use AI tools | 84% |
| Top frustration: almost right, not quite | 66% |
| Actively distrust AI accuracy | 46% |
| Debugging AI code slower than writing it | 45% |
| Trust AI accuracy | 33% |
| Overall trust, down 11 points | 29% |
| Highly trust AI output | 3% |
Use this image
Free to use in your docs, decks and posts under CC BY 4.0, as long as you credit Koji with a link to this page. To embed it, paste this into your page:
html
<a href="https://www.koji.so/visuals/developer-ai-tool-trust-stack-overflow-2025"><img src="https://www.koji.so/visuals/developer-ai-tool-trust-stack-overflow-2025/developer-ai-tool-trust-stack-overflow-2025.png" alt="Bar chart from the 2025 Stack Overflow Developer Survey: 84% of developers use AI tools, but only 33% trust their accuracy and 3% highly trust the output." width="1200" height="666" /></a>
<p>Source: <a href="https://www.koji.so/visuals/developer-ai-tool-trust-stack-overflow-2025">How developers rate AI coding tools in 2025</a>, Koji</p>