Benchmark range
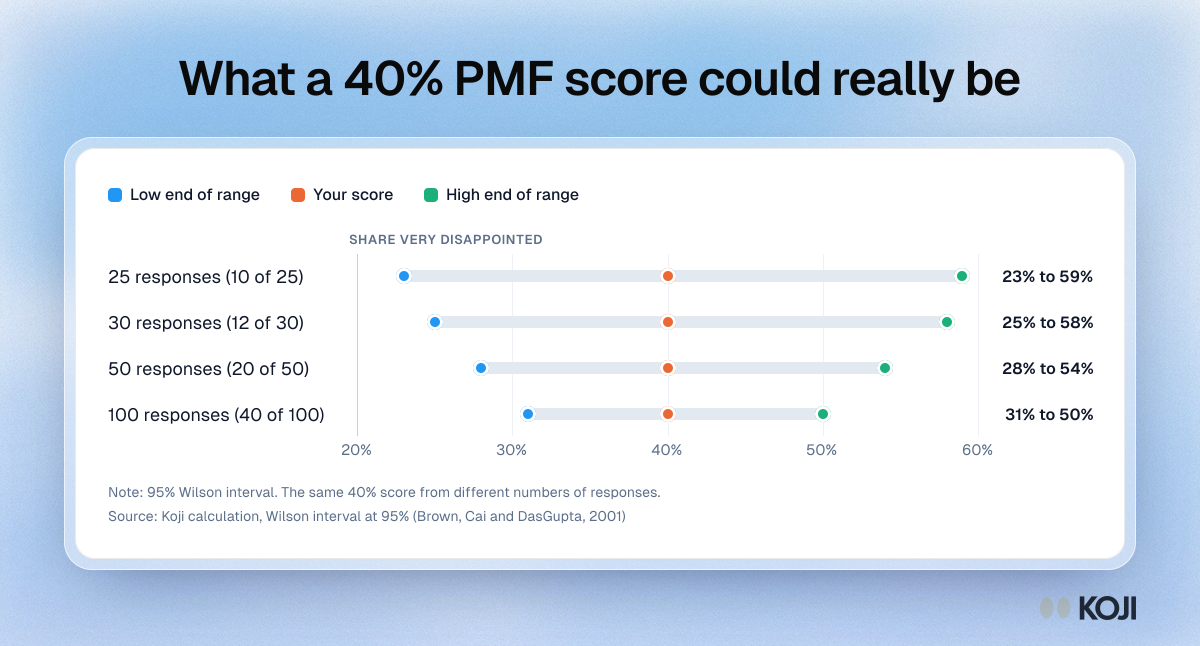
What a 40% PMF score could really be
The 95% range around a Sean Ellis score, by number of responses
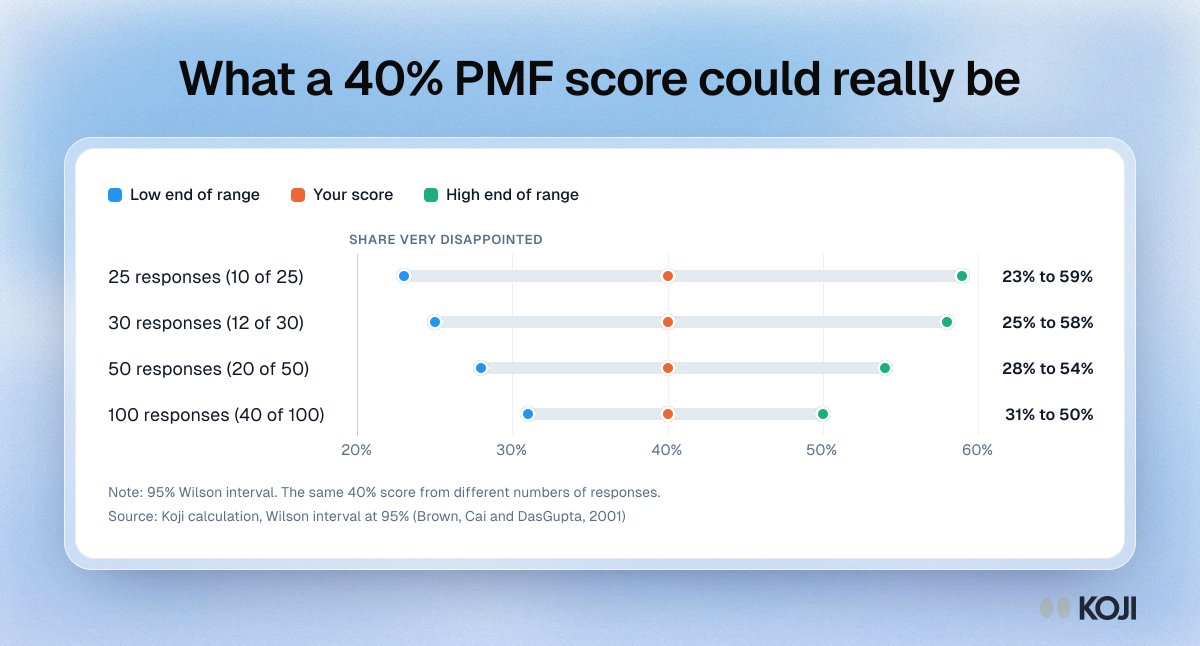
A chart for founders reading a product-market fit survey from a small sample. It shows the 95% Wilson interval around a 40% very disappointed score at 25, 30, 50 and 100 responses, so you can see how wide the real range is before you call it fit or no fit. Use it to report your own score as a range to a co-founder or investor. Koji runs the Sean Ellis question as a structured question inside an AI interview, so each answer comes with the reason behind it.
Where this appears
What's in this benchmark range
| Low end of range | Your score | High end of range | Range | |
|---|---|---|---|---|
| 25 responses (10 of 25) | 23% | 40% | 59% | 23% to 59% |
| 30 responses (12 of 30) | 25% | 40% | 58% | 25% to 58% |
| 50 responses (20 of 50) | 28% | 40% | 54% | 28% to 54% |
| 100 responses (40 of 100) | 31% | 40% | 50% | 31% to 50% |
95% Wilson interval. The same 40% score from different numbers of responses.
Use this image
Free to use in your docs, decks and posts under CC BY 4.0, as long as you credit Koji with a link to this page. To embed it, paste this into your page:
<a href="https://www.koji.so/visuals/pmf-score-40-percent-real-range-by-responses"><img src="https://www.koji.so/visuals/pmf-score-40-percent-real-range-by-responses/pmf-score-40-percent-real-range-by-responses.png" alt="Range chart of the 95% Wilson interval around a 40% PMF score: 23% to 59% at 25 responses, 25% to 58% at 30, 28% to 54% at 50 and 31% to 50% at 100." width="1200" height="646" /></a>
<p>Source: <a href="https://www.koji.so/visuals/pmf-score-40-percent-real-range-by-responses">What a 40% PMF score could really be</a>, Koji</p>