Your PMF score came back under 40%, maybe 28%, maybe 19%, and you only had 30 or so people answer. What do you do next? The short answer: don't treat the number as a verdict yet. Clean the sample down to active users, read the score as a range, split the "very disappointed" group by who they are, and interview the group that would miss you most. By the end of this playbook you can do that in about two weeks, with the questions to ask, the rules for deciding and a plan for each result.
If you haven't run the survey yet, start with the Sean Ellis test guide and come back with a number.
When you need this
You ran the product-market fit survey. You asked active users "How would you feel if you could no longer use this product?" and fewer than 40% said "very disappointed." Now you're stuck between two bad readings: "no fit, so pivot" and "too few answers, so ignore it." Both are guesses.
You're probably here if your score is somewhere between 15% and 39% from fewer than 50 answers, a handful of users love the product while the rest shrug, and you're about to spend on growth or a hire without knowing who it's for.
Guessing here is expensive, and the cost shows up later than it used to. SimpleClosure, which handles wind-downs for venture-backed startups, reported that Series A companies rose from about 6% to about 14% of all the shutdowns it handled in 2025, a 2.5x jump, and that the companies closing were older and had raised more money [4]. In the first half of 2026, SaaS was the largest category of its shutdowns, at 27.3% [5]. Raising a round doesn't settle the fit question. It raises the stakes.
The method in brief
The survey tells you whether enough people need you. It can't tell you who they are or why. So you pair it with two things: a bit of honest arithmetic on a small sample, and 10 to 15 interviews with the people the survey points you to.
The 40% line comes from Sean Ellis, who devised the question. Rahul Vohra, who used it to steer Superhuman, recounts that Ellis found companies that struggled to grow almost always scored under 40% [1]. It's a benchmark from experience, not a law.
Superhuman is the clearest public example of what to do with a low score. Its first score was 22%. Vohra's team looked at who the very disappointed users were, narrowed the target to people like them, and the score for that group was 33% before they changed a line of code. After that they split the roadmap: half on what their fans loved, half on what held back the "somewhat disappointed" users who valued the same main benefit. The score went to 47%, then 56%, then 58% over the next three quarters [1].
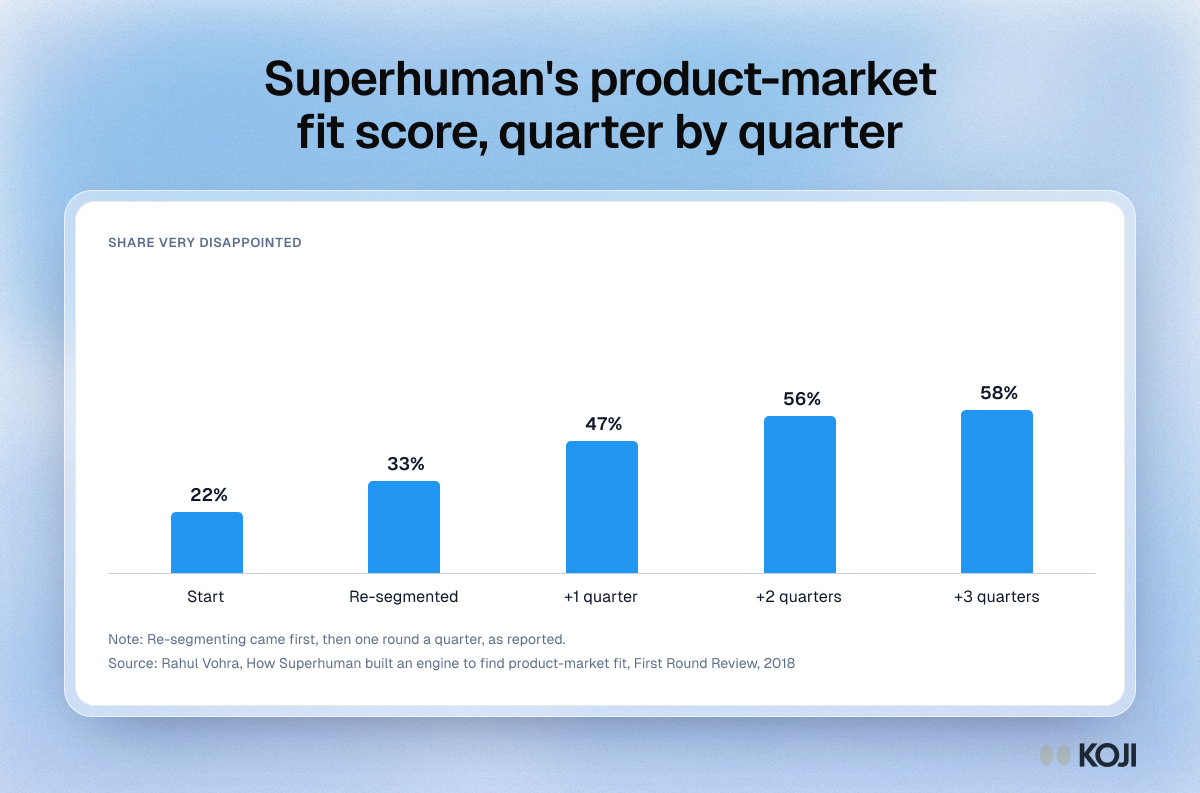
Notice where the first jump came from: picking who to count. That's the move most founders skip, and it's the core of this playbook. For the interview side, the product-market fit interviews guide covers the method, and how many interviews are enough covers sample size in more depth.
Step by step
1. Clean the sample before you read it
Anyone who signed up, poked around once and left will say "not disappointed," and they're right: they never relied on it. Those answers are about activation, not fit.
Keep people who have used the product at least twice in the last two weeks, or whatever "active" honestly means for your product (a weekly report tool might use a month). Drop the rest and recount. If you can't tell who was active, add one screening question next time ("When did you last use [product]?") and only count people who pass.
Don't swing the other way and survey only your ten biggest fans.
2. Read the score as a range, not a point
With 30 answers, one person changing their mind moves your score by more than three points. So a 40% from 25 people and a 40% from 100 people are not the same finding.
The honest way to say this is a confidence interval. For small samples, statisticians recommend the Wilson interval over the textbook formula, which misbehaves when n is small [2]. Here's what a 40% score could really be, at 95% confidence, by number of answers:
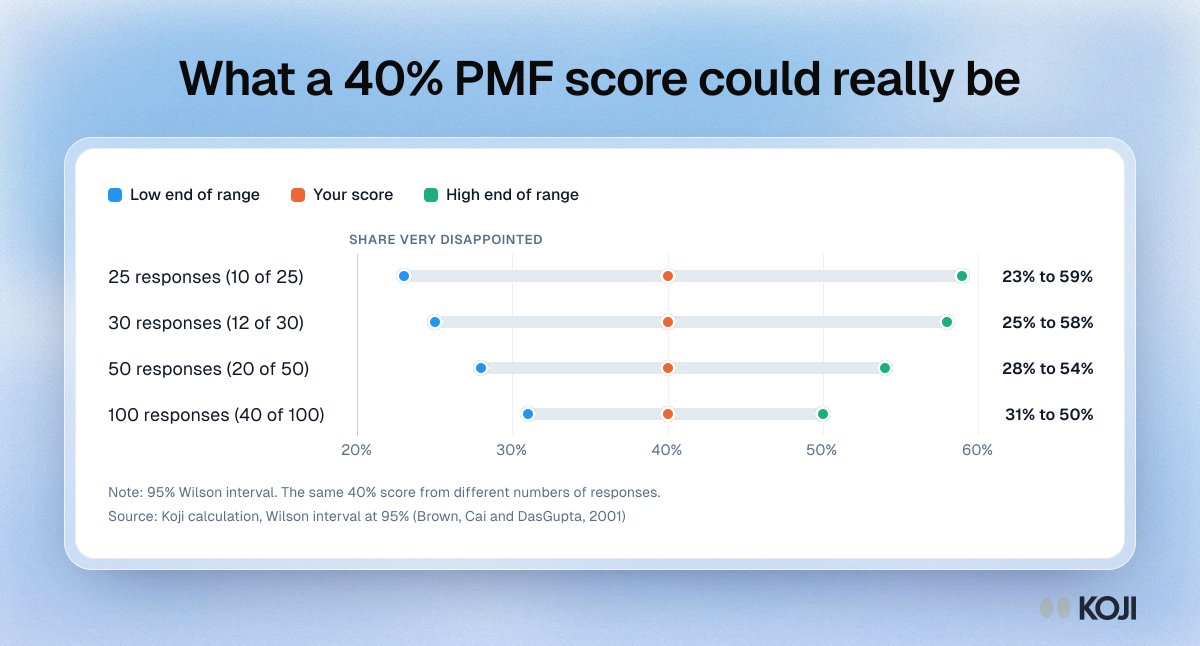
At 25 answers, a "40%" is anywhere from 23% to 59%. A 28% from 25 answers (7 people) runs from 14% to 48%. So a low score from a small sample means "probably not yet," not "definitely never." It also means a 41% from 25 answers isn't proof you've made it.
Two rules come out of this. Under 30 answers, always report the range next to the score. And if the top of the range is below 40%, you don't have fit with the group you surveyed. The margin of error guide explains the arithmetic.
3. Split the very disappointed by who they are
This is the step that moved Superhuman's number, and it's where a low overall score usually hides good news. Take everyone who said "very disappointed" and look at what they have in common. Try these cuts, one at a time:
- Role or job title
- Company size or type
- The use case they bought for
- How they found you
- How long they've been a customer
You're looking for a group where the share of very disappointed is far above your overall score. A blended 26% can be one group at 58% and another at 9%. When you find one, write a short description of that person in plain words: who they are, what they were doing before you, what they use you for. That's your candidate high-expectation customer, Vohra's term for the most discerning person in the group that loves you [1].
Be careful with small groups: four of five is a lead, not a finding. Look for a group of at least 8 people, then go and talk to them.
4. Interview the people who would miss you, and the ones nearly there
Now you need the why, and a survey can't give it to you. Interview two groups:
- 10 to 15 very disappointed users from your candidate group. A systematic review of saturation studies found that 9 to 17 interviews were usually enough to hear the full range of themes when the group is fairly similar and the question narrow [3]. That's your situation.
- 6 to 8 somewhat disappointed users who value the same main benefit. These are the people closest to tipping over, and their blockers are your roadmap.
Ignore the "not disappointed" group for now. Vohra's advice was blunt: they're far from loving the product and building for them pulls you away from the people who do [1].
Ask about real events, not opinions. Here's a question bank you can reuse:
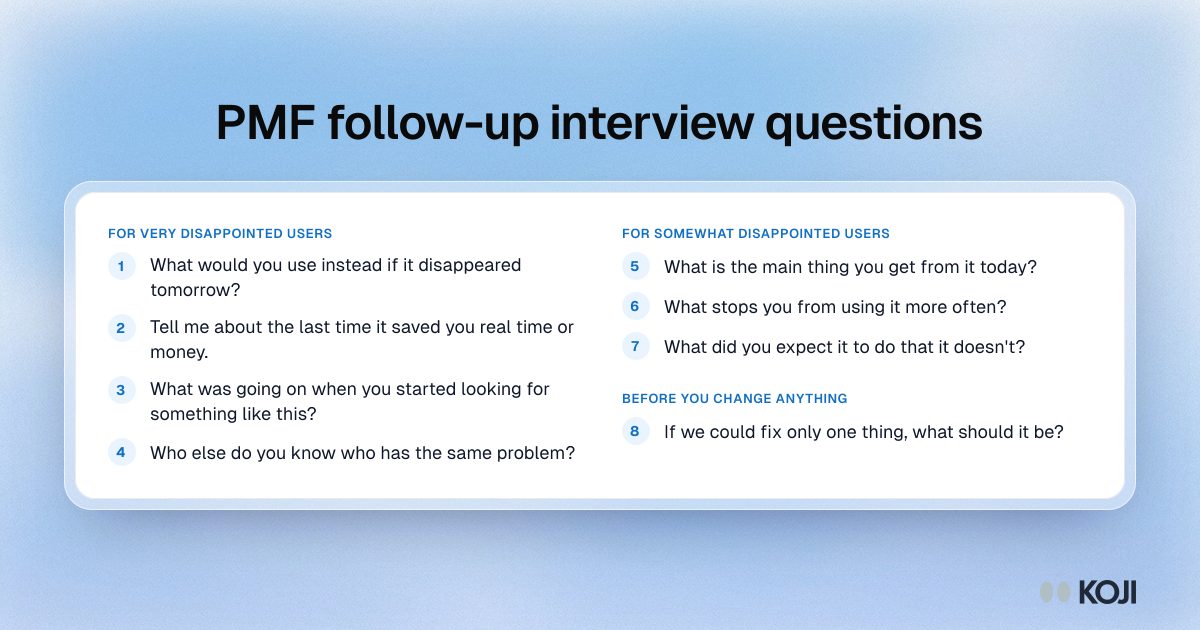
Follow every general answer with "Can you tell me about the last time that happened?" A story beats a rating. And note the words they use for the benefit: if six people say "I stopped chasing no-shows," that phrase belongs on your homepage.
5. Decide, then run the survey again
Write down your decision rules before you read the interview notes, so you can't talk yourself into anything. Then make one of the calls in the next section and re-run the same survey, with the same "active" rule, in about a quarter. The score is a metric you move, not a grade you get once.
A worked example
Say you're a two-person team selling scheduling software to physiotherapy clinics. You've got about 80 paying accounts. You send the PMF survey and 46 people answer. Your score is low and you're tempted to call it a pivot.

Photo by Azwedo L.LC on Unsplash
First you clean the sample. Twelve of the 46 haven't logged in for a month, so they go. That leaves 34 active users, and 9 of them said "very disappointed." That's 26%, and the Wilson range is 15% to 43%. Not fit yet, but not hopeless either.
Then you split the 9. Seven run clinics with three or more therapists. Two are solo practitioners. Look at each group as a whole: 7 of the 12 multi-therapist clinics are very disappointed (58%, range 32% to 81%), against 2 of the 22 solo practitioners (9%, range 3% to 28%). The solo group's whole range sits below 40%. The clinic group is promising, but with 12 people the bottom of its range is still under the bar, so you need the interviews.
You interview 10 clinic owners and 6 somewhat disappointed clinic managers. The owners keep telling the same story: before you, someone spent Monday mornings rebuilding the rota and phoning patients who didn't show. Your reminders and the shared rota gave them that morning back. The managers like the same things but say the product falls down when a therapist works across two locations, so they keep a spreadsheet on the side.
So you narrow your ICP to clinics with three or more therapists and rewrite the homepage around "no more Monday rota rebuild." You spend half the next quarter on multi-location support for the managers and half on reminders and the rota for the owners. You stop selling to solo practitioners. And you put the survey back in the diary for next quarter, counting only clinics.
Reading the results and deciding
The decision rules, in order:
- The top of your overall range is below 40% and no group of 8+ scores 40% or more. You don't have fit with anyone yet. Go back to problem interviews: who has this problem worst, and is it painful enough to pay for? Don't spend on growth.
- One group of 8+ scores 40% or more, and the interviews tell one consistent story. You've found your candidate ICP. Narrow your positioning and your roadmap to them, and re-run the survey in a quarter counting only that group.
- One group scores well, but the interviews tell several different stories. Your segment is too broad. Split it again by use case and interview the largest sub-group.
- Somewhat disappointed users name the same blocker again and again. That's your next build. Fix it, tell them, and watch whether they move up next quarter.
- Your score is 40% or more, but from under 30 answers. Celebrate quietly. Report the range, keep collecting answers, and check retention before you call it.
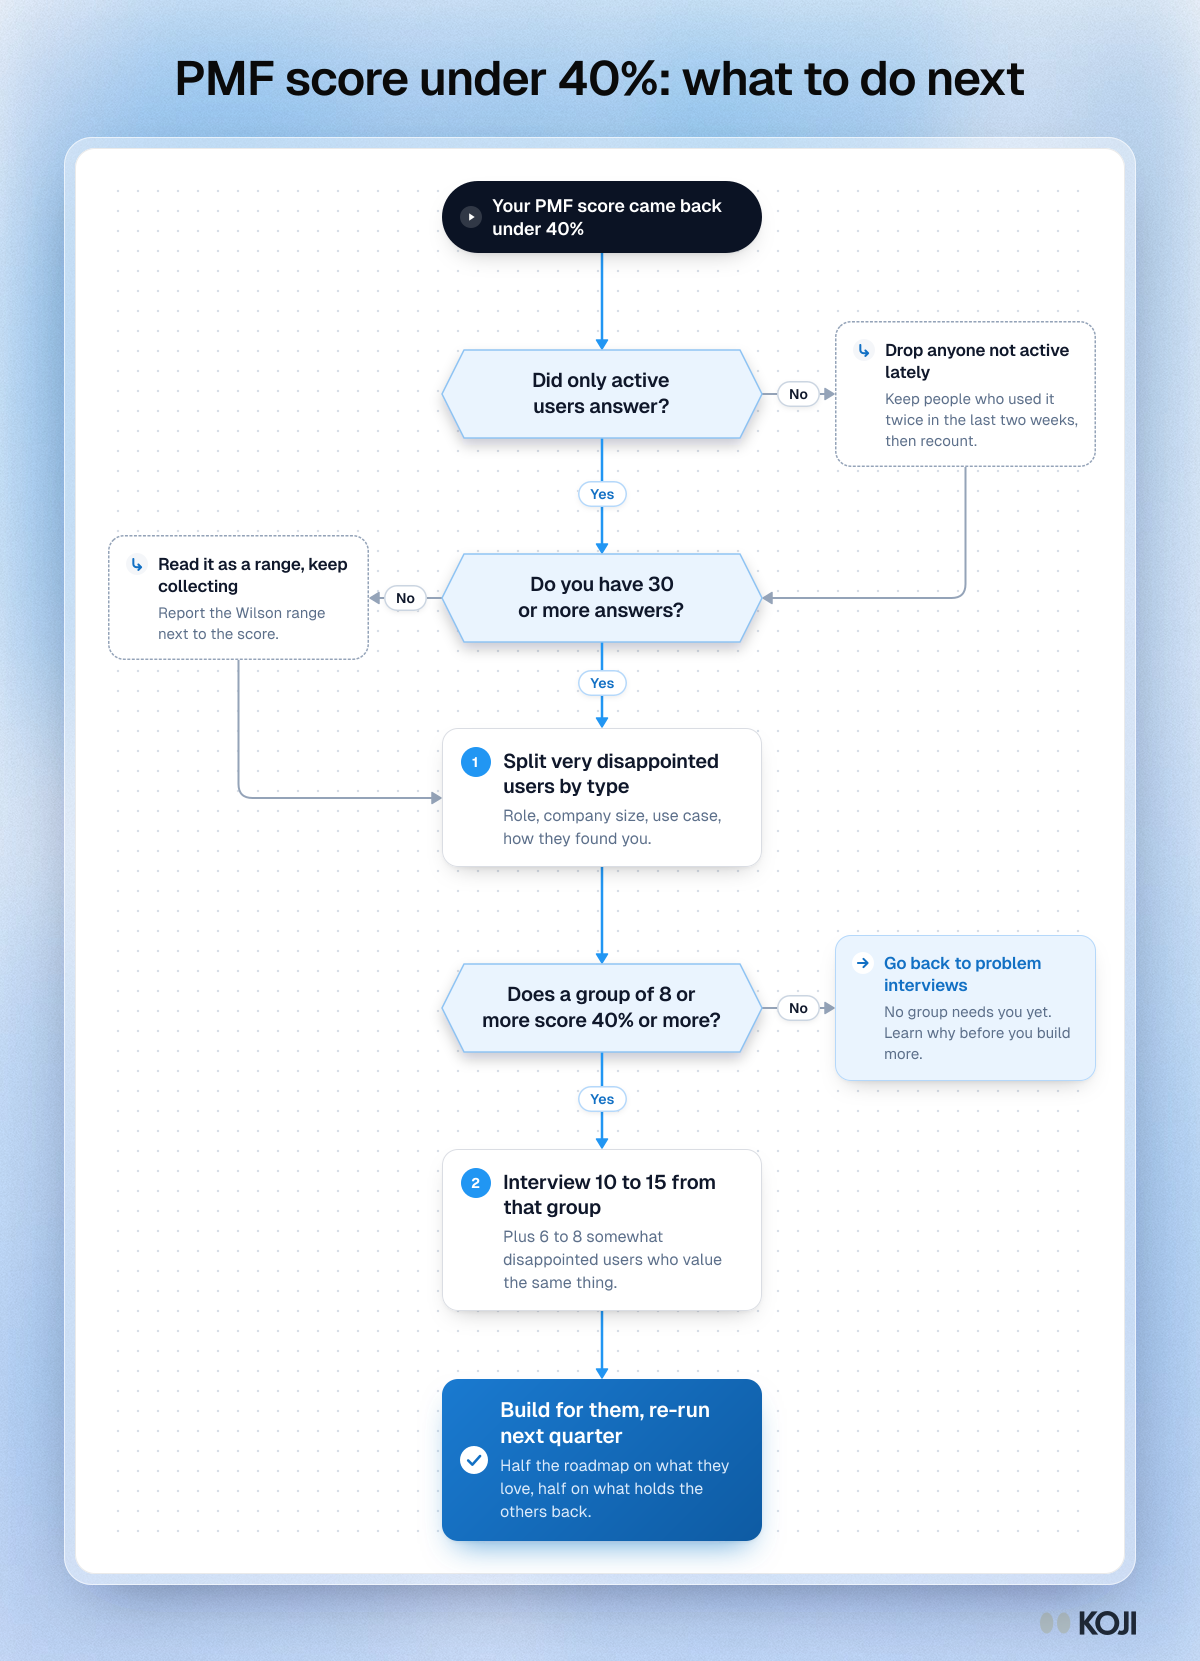
This flowchart is the same logic, ready to share with a co-founder:
Run it this week with Koji
You can do all of this by hand with a form, a spreadsheet and calendar invites. If you'd rather run the survey and the interviews in one place, here's the setup in Koji.
Set up the survey and the follow-up in one study
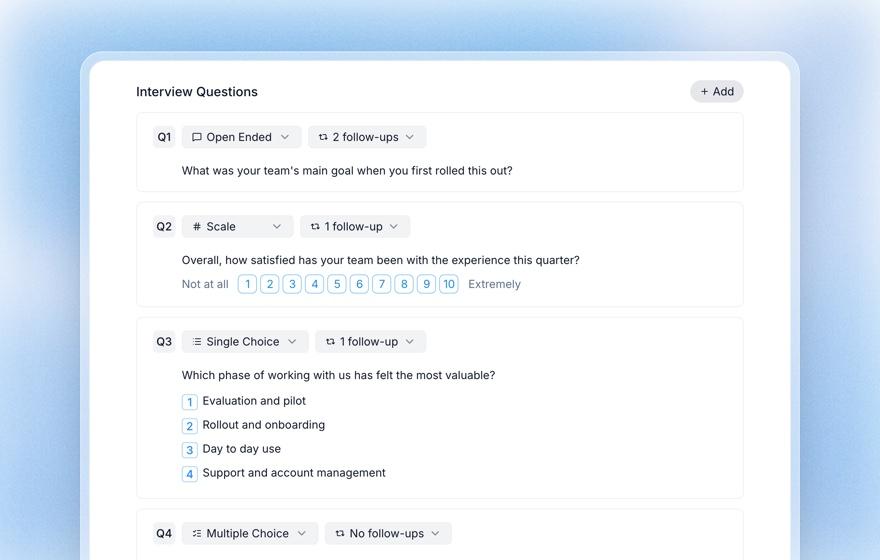
Start a study and tell the research assistant what you want to learn ("which users would miss us most, and why"). It drafts a brief. Then check the questions:
- Add the Sean Ellis question as a single choice question with three options: Very disappointed, Somewhat disappointed, Not disappointed. Koji asks it as written and then follows up on the answer, so a "very disappointed" gets "What would you do instead?" in the same conversation. You get the score and the story from one person, without booking a call.
- Add a single choice question for the cut you care most about (role, team size or use case), so every answer arrives tagged, and an open question for the main benefit.
Make sure only active users count
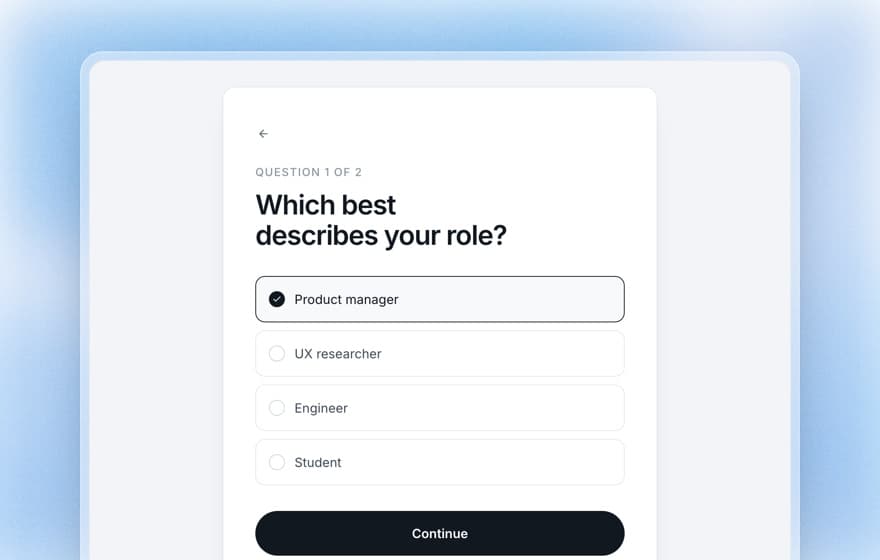
Add a screening question such as "When did you last use [product]?" and mark the older answers as not qualifying. Everyone answers it before the interview starts, whatever link they came in by, and anyone who doesn't qualify is turned away politely. That's step 1 done for you.
Send it and read it
Share the interview link in an in-app message or an email to your active users. You can also import a list from a CSV so each person gets their own link, and on a paid plan Koji can send the invitations and reminders for you. People answer by text or voice, whenever it suits them.
In the results, each person's answer to the disappointment question shows as its own column beside their other answers and themes, so you can read the very disappointed group's interviews together and see what they share. The report charts the share for each answer, with the quotes behind each theme.
A free account starts with 10 credits, and a text interview uses one (a voice interview uses three), so you can try the whole setup on your first ten users before you decide anything. When you're ready to share what you found, download the report as an editable slide deck or a PDF for your co-founder, your board or your next investor update.
Common mistakes
Surveying everyone who ever signed up. Lapsed users drag the score down and tell you nothing about fit. Count active users only.
Averaging across very different customers. A blended score hides the group that loves you. Always split before you decide.
Building for the not disappointed. It feels like fixing the biggest problem. It usually means building for people who will never need you.
Changing the question or the filter between rounds. If you want to track the score, keep the wording and the "active" rule identical every quarter.
When research will mislead you
The PMF survey measures how people feel about losing the product. Feelings and behaviour usually agree, but not always. Someone can be very disappointed and still churn at renewal because their budget moved. So pair the survey with what people do: retention by cohort, how often they come back, whether they refer others, whether they'd sign an annual contract.
Interviews have their own trap. People are confident about why they do things, and often wrong. A classic review of the psychology research found that people regularly give plausible reasons for their choices that weren't the real cause [6]. That's why the questions above ask for the last time something happened, not for a rating or a reason in the abstract. When an interview story and your usage data disagree, trust the data and go back with a sharper question.
And if some of your very disappointed users are former colleagues, take them out and recount.
Where this fits
This decision sits in the "finding product-market fit" stage of the founder's research playbook. The step before it is usually learning why new users stall: if most people never get to the value, your PMF score is measuring onboarding, not fit. The step after it is rewriting your homepage in your customers' words, using the language your very disappointed users gave you. If you want a quick way to interview a whole cohort, see interviewing your existing customers without booking thirty calls, and when the segment is clear, price your product with 30 customer conversations. For more on research at this stage, see Koji for founders.
FAQ
Is 40% really the bar for product-market fit? It's a benchmark from Sean Ellis's experience, not a statistical threshold [1]. It's useful because it's simple and widely used, so you can compare over time. Treat 40% as the aim, and judge your number with its range and alongside retention.
How many responses do I need for a PMF survey? Aim for 30 or more active users before you read the score at all, and report the range below 50. With 100 answers, a 40% score still runs from about 31% to 50% [2]. If you can't get 30, skip the score and run 10 to 15 interviews instead.
My PMF score is 28%. Should I pivot? Not yet. First drop inactive users, then split the very disappointed by who they are. If no group of 8 or more people scores 40% or more and the top of your overall range is under 40%, then it's time to go back to problem interviews before you build more.
Who should I survey for the Sean Ellis test? People who have used the product enough to rely on it, for example at least twice in the last two weeks. Not trial users who left, and not only your biggest fans.
What should I ask in a PMF follow-up interview? Ask very disappointed users what they'd use instead, the last time the product saved them time or money, and what made them start looking. Ask somewhat disappointed users what they get from it today and what stops them using it more. The question bank above has all eight.
Your next step
Pull your active users from the last two weeks, send them the Sean Ellis question with one follow-up, and split whatever comes back by role or company size. If you'd like the survey and the interviews in one place, start a study in Koji and use the setup above.
References
- Rahul Vohra. "How Superhuman Built an Engine to Find Product/Market Fit." First Round Review, 2018. https://review.firstround.com/how-superhuman-built-an-engine-to-find-product-market-fit
- Lawrence D. Brown, T. Tony Cai and Anirban DasGupta. "Interval Estimation for a Binomial Proportion." Statistical Science, 16(2), 2001. https://doi.org/10.1214/ss/1009213286
- Monique Hennink and Bonnie N. Kaiser. "Sample sizes for saturation in qualitative research: A systematic review of empirical tests." Social Science & Medicine, 292, 2022. https://doi.org/10.1016/j.socscimed.2021.114523
- SimpleClosure. "The 2025 Startup Shutdown: More Capital, Later Stages, and the First AI Reckoning." Business Wire, December 2025. https://www.businesswire.com/news/home/20251223595831/en
- SimpleClosure. "State of Shutdowns: H1 2026." SimpleClosure, 2026. https://simpleclosure.com/blog/insights/state-of-shutdowns-h1-2026
- Richard E. Nisbett and Timothy D. Wilson. "Telling more than we can know: Verbal reports on mental processes." Psychological Review, 84(3), 1977. https://doi.org/10.1037/0033-295X.84.3.231
Further reading
- Rahul Vohra, "How Superhuman Built an Engine to Find Product/Market Fit" (First Round Review). The original account of segmenting a low score and turning it into a roadmap. Read it for the survey questions and the half-and-half roadmap. https://review.firstround.com/how-superhuman-built-an-engine-to-find-product-market-fit
- Sean Ellis test: the 40% rule (Koji). How to set up and run the survey itself, if you haven't yet.
- Product-market fit interviews (Koji). The interview method in more depth, with an analysis framework for the notes.
- Brown, Cai and DasGupta, "Interval Estimation for a Binomial Proportion" (Statistical Science). Technical, but the clearest case for why small-sample percentages need a better interval than the textbook one. https://doi.org/10.1214/ss/1009213286