Bar chart
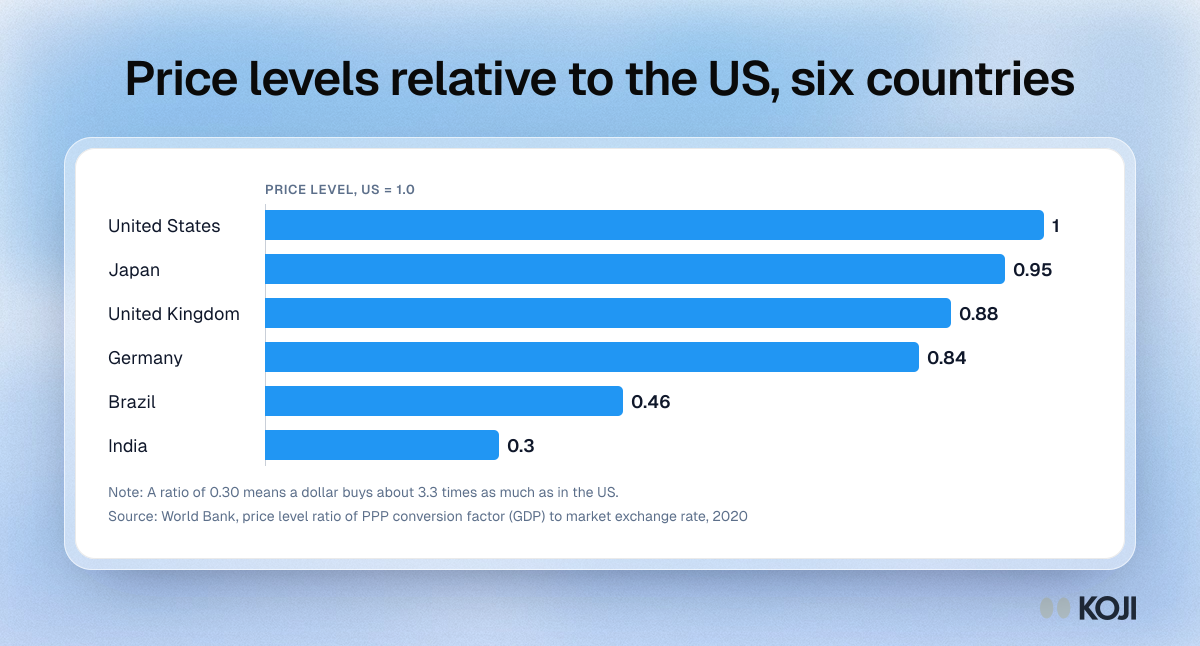
Price levels relative to the US, six countries
How far the same reward goes in each market, from the World Bank price level ratio
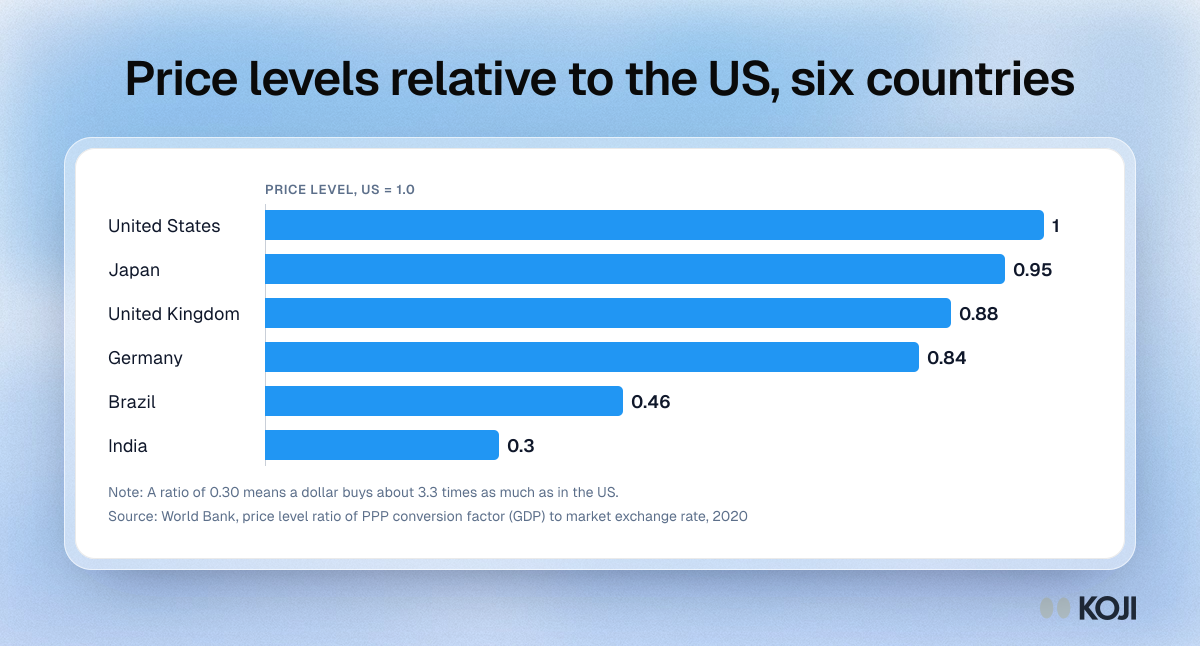
World Bank price level ratios for six countries, relative to the United States, for researchers setting participant incentives across markets. A lower ratio means the same amount buys more locally. Use it as a starting point for scaling consumer incentives, with a floor so amounts stay respectful. Koji lets participants in any supported country claim the same reward as a gift card, prepaid card or donation.
Where this appears
What's in this bar chart
| Price level ratio | |
|---|---|
| United States | 1 |
| Japan | 0.95 |
| United Kingdom | 0.88 |
| Germany | 0.84 |
| Brazil | 0.46 |
| India | 0.3 |
A ratio of 0.30 means a dollar buys about 3.3 times as much as in the US.
Use this image
Free to use in your docs, decks and posts under CC BY 4.0, as long as you credit Koji with a link to this page. To embed it, paste this into your page:
html
<a href="https://www.koji.so/visuals/price-levels-relative-to-us-world-bank-2020"><img src="https://www.koji.so/visuals/price-levels-relative-to-us-world-bank-2020/price-levels-relative-to-us-world-bank-2020.png" alt="Bar chart of World Bank price level ratios relative to the United States in 2020: US 1.0, Japan 0.95, UK 0.88, Germany 0.84, Brazil 0.46, India 0.30" width="1200" height="646" /></a>
<p>Source: <a href="https://www.koji.so/visuals/price-levels-relative-to-us-world-bank-2020">Price levels relative to the US, six countries</a>, Koji</p>