Bar chart
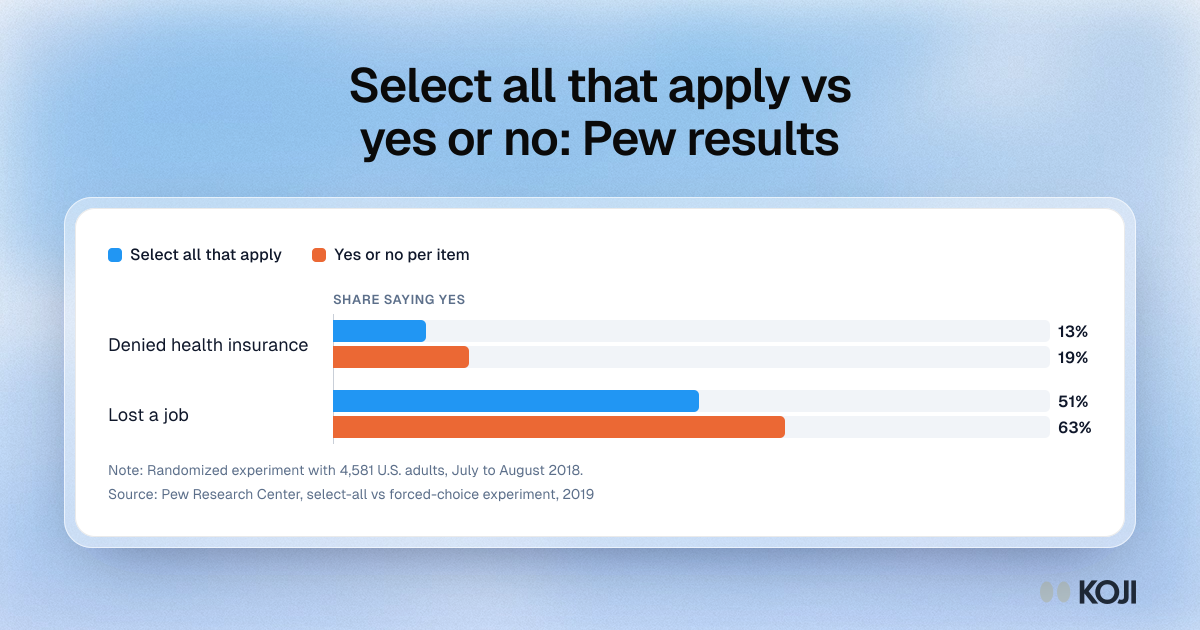
Select all that apply vs yes or no: Pew results
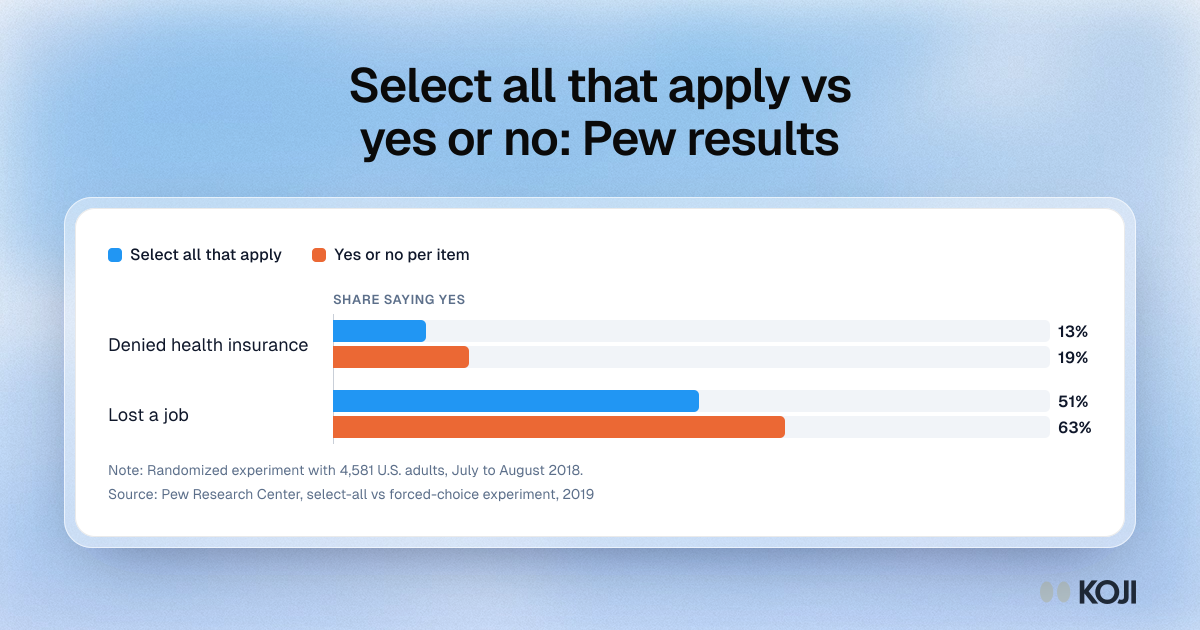
Two items from a Pew Research Center experiment that asked the same questions as a select-all checklist or as one yes or no question per item. The yes or no version gave higher shares: 19% vs 13% for being denied health insurance and 63% vs 51% for losing a job. Use it to show why select-all lists under-count when you need the share for each item.
Where this appears
What's in this bar chart
| Select all that apply | Yes or no per item | |
|---|---|---|
| Denied health insurance | 13% | 19% |
| Lost a job | 51% | 63% |
Randomized experiment with 4,581 U.S. adults, July to August 2018.
Use this image
Free to use in your docs, decks and posts under CC BY 4.0, as long as you credit Koji with a link to this page. To embed it, paste this into your page:
html
<a href="https://www.koji.so/visuals/select-all-vs-forced-choice-pew-results"><img src="https://www.koji.so/visuals/select-all-vs-forced-choice-pew-results/select-all-vs-forced-choice-pew-results.png" alt="Bar chart from Pew Research Center comparing select-all and forced-choice answers: health insurance denial 13% vs 19%, job loss 51% vs 63%." width="1200" height="630" /></a>
<p>Source: <a href="https://www.koji.so/visuals/select-all-vs-forced-choice-pew-results">Select all that apply vs yes or no: Pew results</a>, Koji</p>