Reference table
What to measure after a simulation session
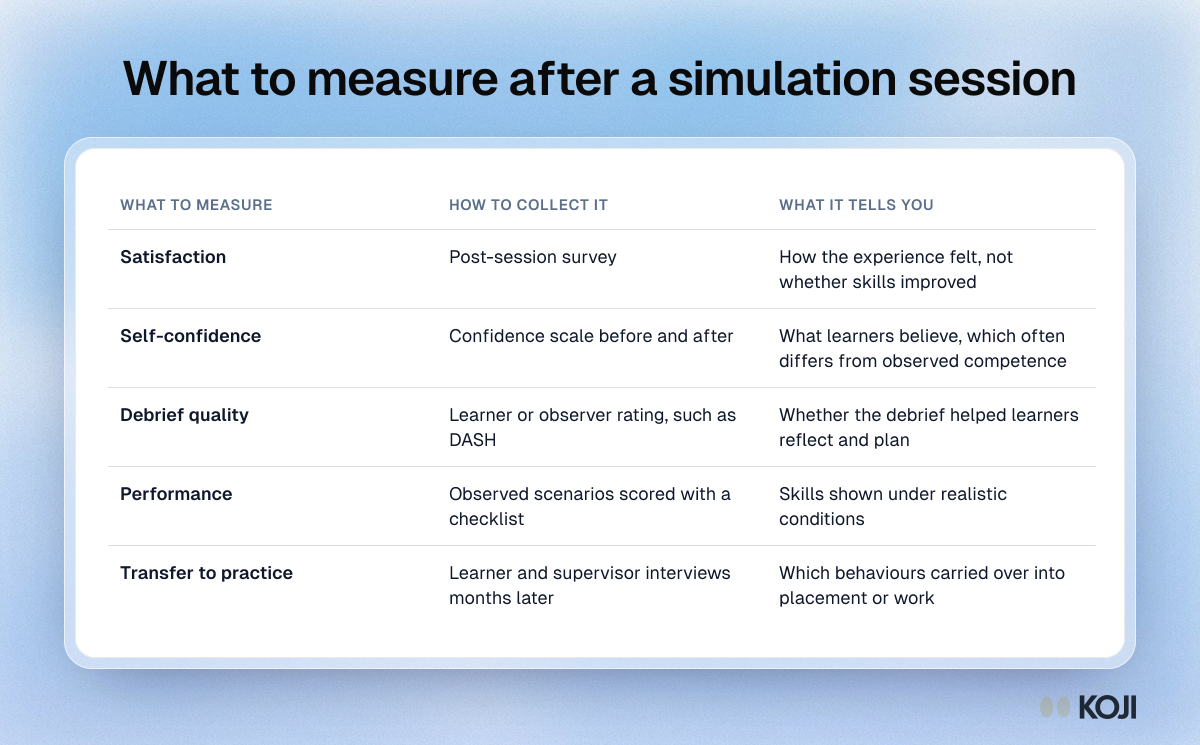
A table for programme teams evaluating simulation-based learning in health, business, engineering or maritime education. It sets out five things to measure, how to collect each one and what each can and cannot tell you, so a post-session survey is read for what it is. Koji for Education can run the learner and supervisor interviews in the last row at scale.
What's in this reference table
| What to measure | How to collect it | What it tells you |
|---|---|---|
| Satisfaction | Post-session survey | How the experience felt, not whether skills improved |
| Self-confidence | Confidence scale before and after | What learners believe, which often differs from observed competence |
| Debrief quality | Learner or observer rating, such as DASH | Whether the debrief helped learners reflect and plan |
| Performance | Observed scenarios scored with a checklist | Skills shown under realistic conditions |
| Transfer to practice | Learner and supervisor interviews months later | Which behaviours carried over into placement or work |
Use this image
Free to use in your docs, decks and posts under CC BY 4.0, as long as you credit Koji with a link to this page. To embed it, paste this into your page:
<a href="https://www.koji.so/visuals/simulation-evaluation-what-to-measure-table"><img src="https://www.koji.so/visuals/simulation-evaluation-what-to-measure-table/simulation-evaluation-what-to-measure-table.png" alt="Table of what to measure after a simulation: satisfaction, confidence, debrief quality, observed performance and transfer to practice." width="1200" height="745" /></a>
<p>Source: <a href="https://www.koji.so/visuals/simulation-evaluation-what-to-measure-table">What to measure after a simulation session</a>, Koji</p>
Related
A 30-minute customer interview discussion guide
GMC Promoting excellence: evaluation evidence map
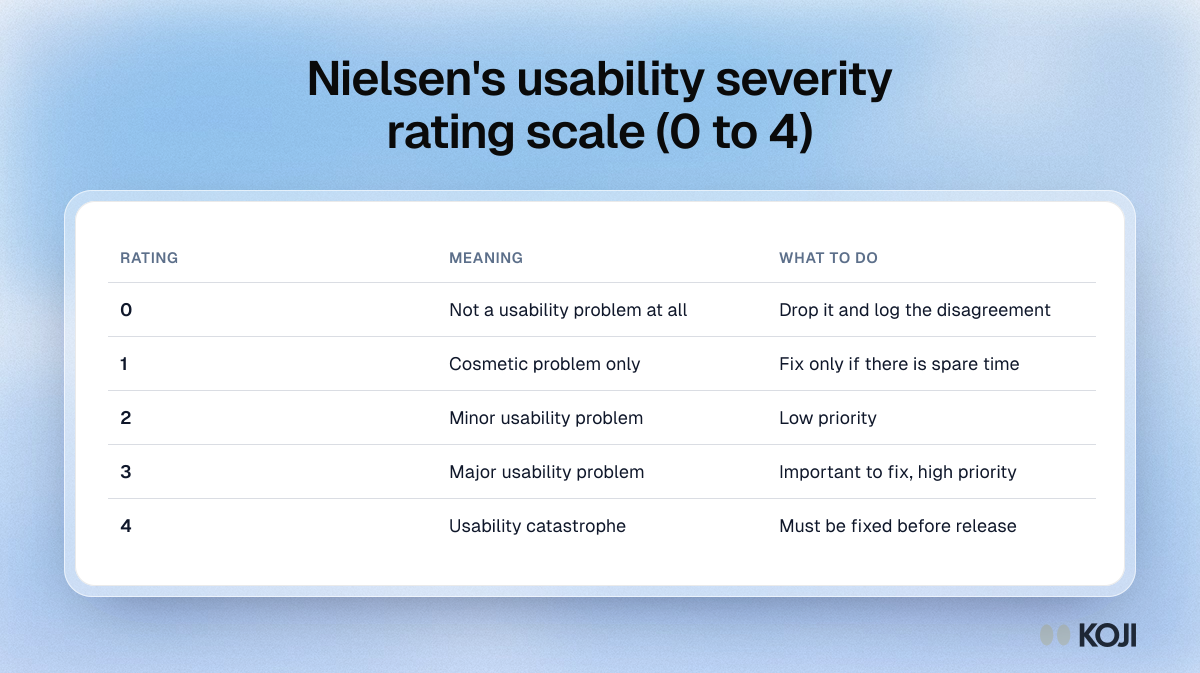
Nielsen's usability severity rating scale (0 to 4)
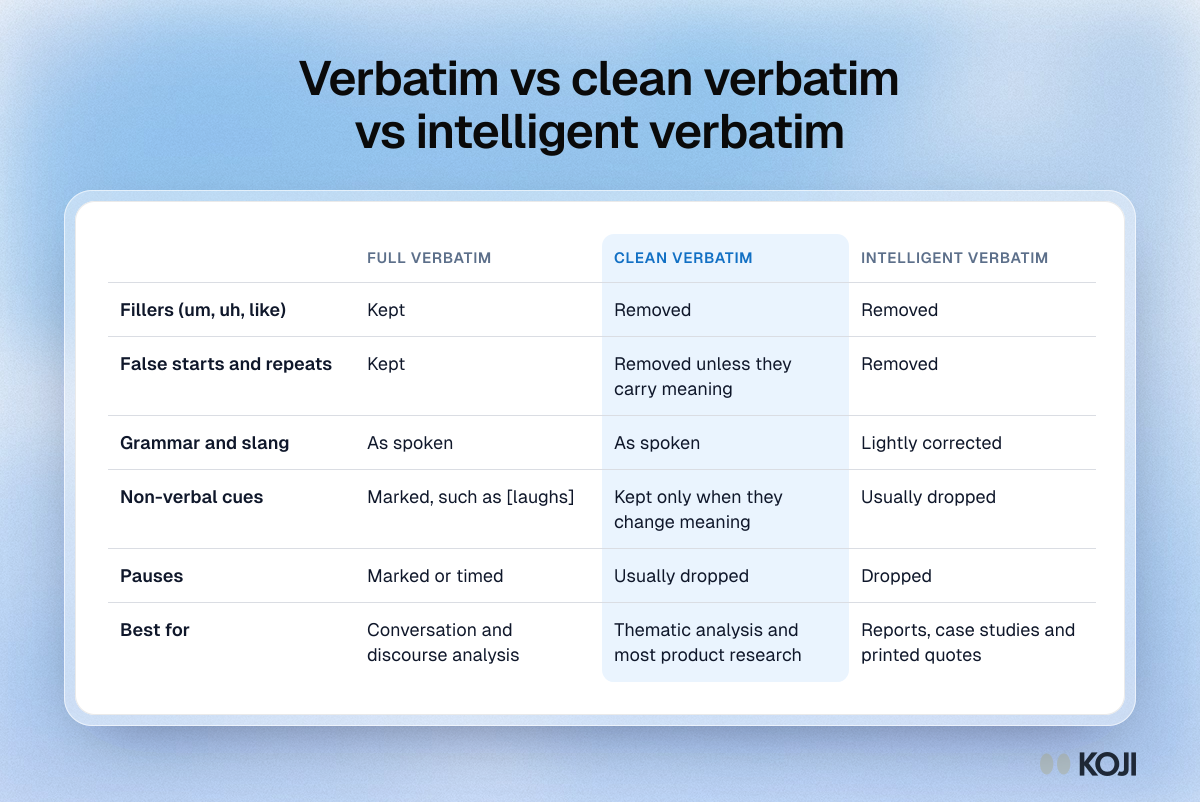
Verbatim vs clean verbatim vs intelligent verbatim
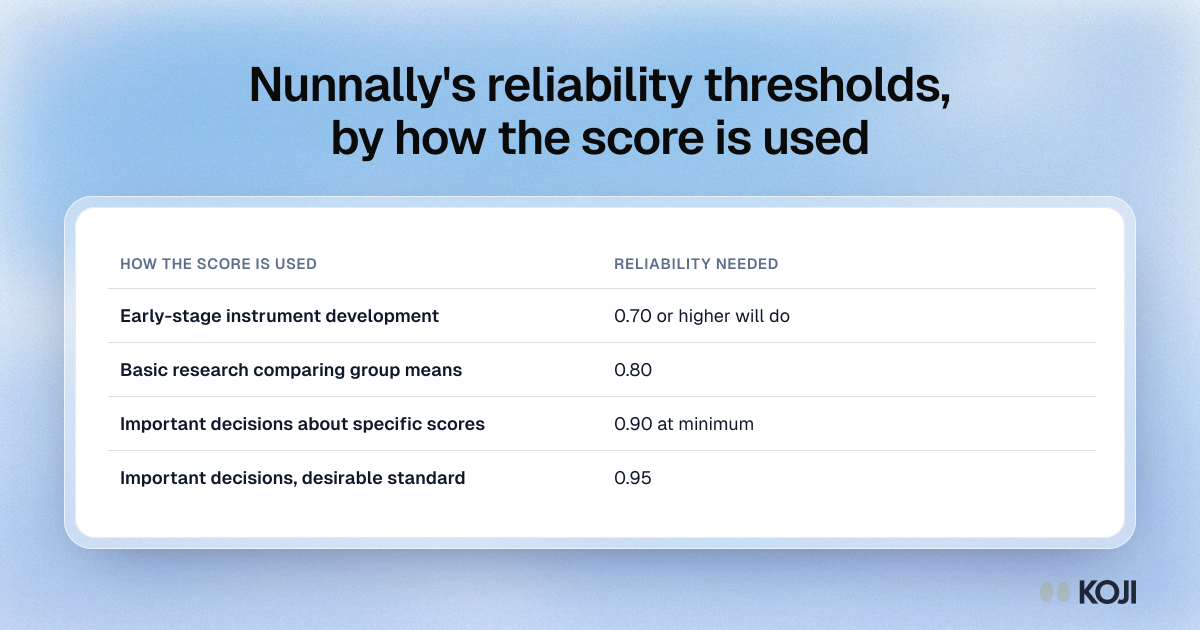
Nunnally's reliability thresholds, by how the score is used
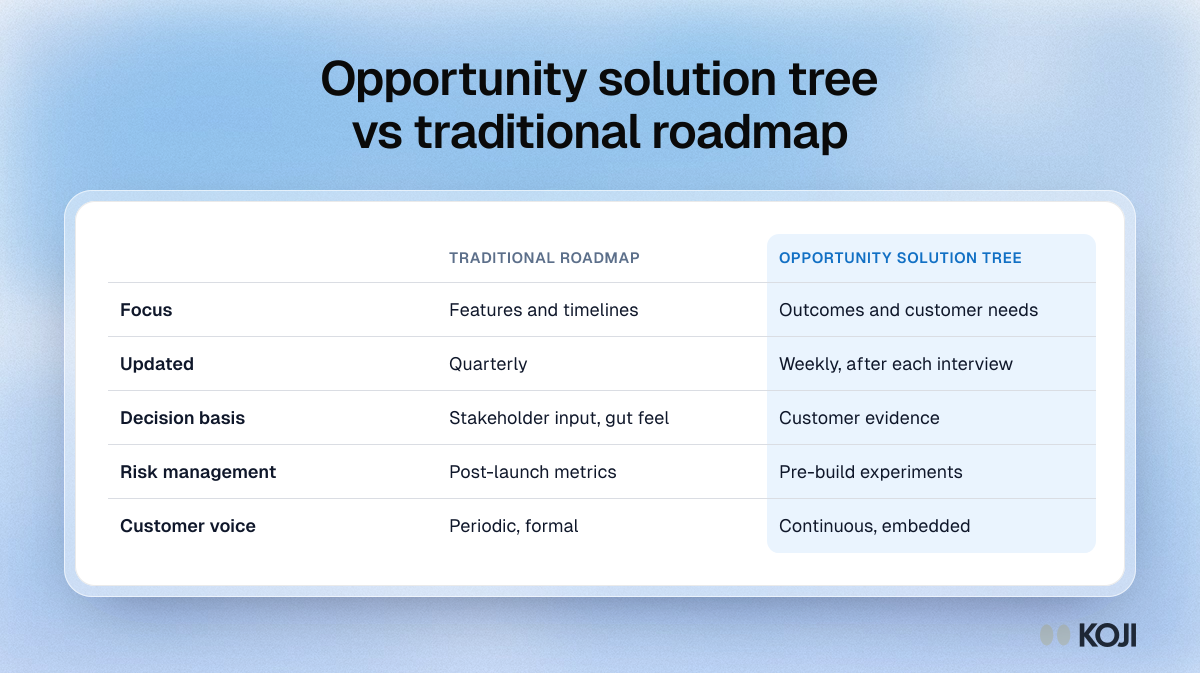
Opportunity solution tree vs traditional roadmap