Original research is the content asset that buyers read, sales teams forward and AI assistants quote, and most marketing teams still build it from a quick panel survey that gives them percentages and no reasons. Running the study as AI-moderated interviews, with a few structured questions inside each conversation, gets you the headline numbers and the quotes that explain them from the same people, in about six weeks. By the end of this playbook you will have a six-week plan, a sample-size rule, a copyable interview guide and a checklist for publishing a report people can trust and cite.
Why original research matters now
Your buyers are doing more of their research without you, and the sources they lean on are the ones that bring something new.
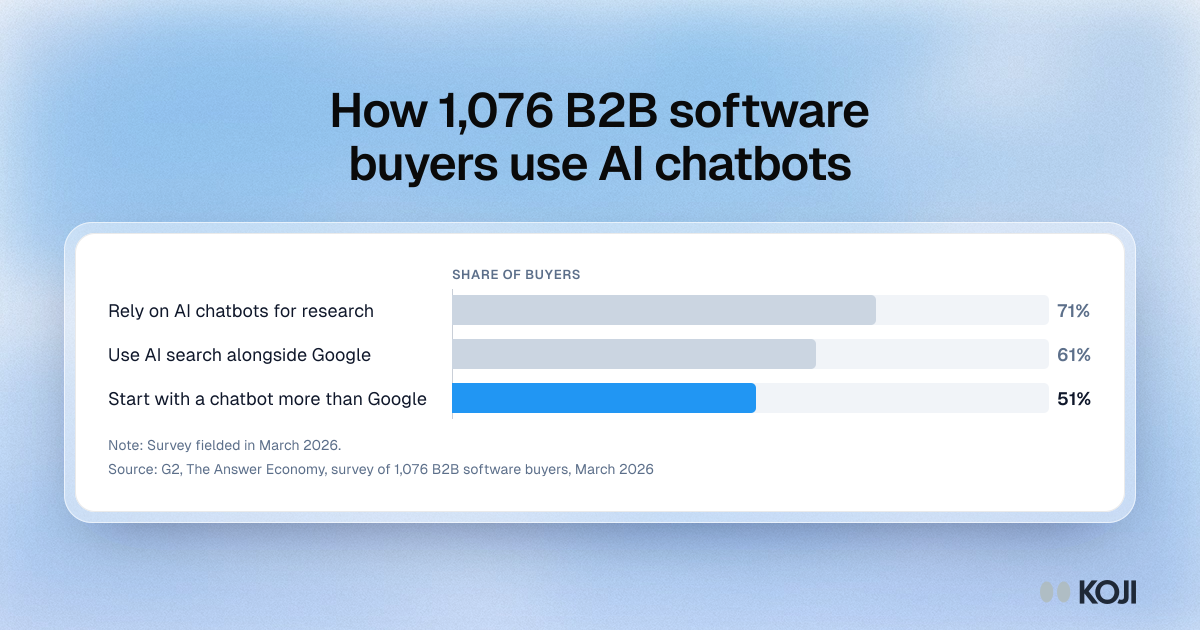
Buyers start in a chat window. In G2's 2026 AI search study of 1,076 B2B software buyers, surveyed in March 2026, 51% said they now start their research with an AI chatbot more often than with Google, up from 29% in G2's 2025 buyer survey. In the same study, 71% said they rely on AI chatbots for software research and 61% said they use AI search alongside Google (G2, 2026). Those assistants answer with whatever sources they can quote.
Statistics and quotations make a source easier to quote. The research team behind the GEO paper, presented at KDD 2024, tested ways of rewriting web content for generative search engines and found that methods such as adding statistics, quotations and cited sources raised a source's visibility in generated answers by up to 40% (Aggarwal et al., 2024). Your own data is a statistic nobody else has.
Thought leadership reaches the buyers sales never meets. Edelman and LinkedIn's 2025 B2B Thought Leadership Impact Report, based on nearly 2,000 business professionals, found that 63% of "hidden buyers" (people who shape a decision without being the named contact) spend more than an hour a week reading thought leadership, close to the 64% of target buyers, and that 71% of hidden buyers have little or no contact with sales teams (Edelman, 2025). For many people on the buying committee, your report is the only pitch they will see.
The budget is not growing. Gartner's 2026 CMO Spend Survey of 401 marketing leaders put average marketing budgets at 7.8% of company revenue, against 7.7% in 2025 (Gartner, 2026). A five-figure agency study is a hard ask. A study your team can run itself is not.
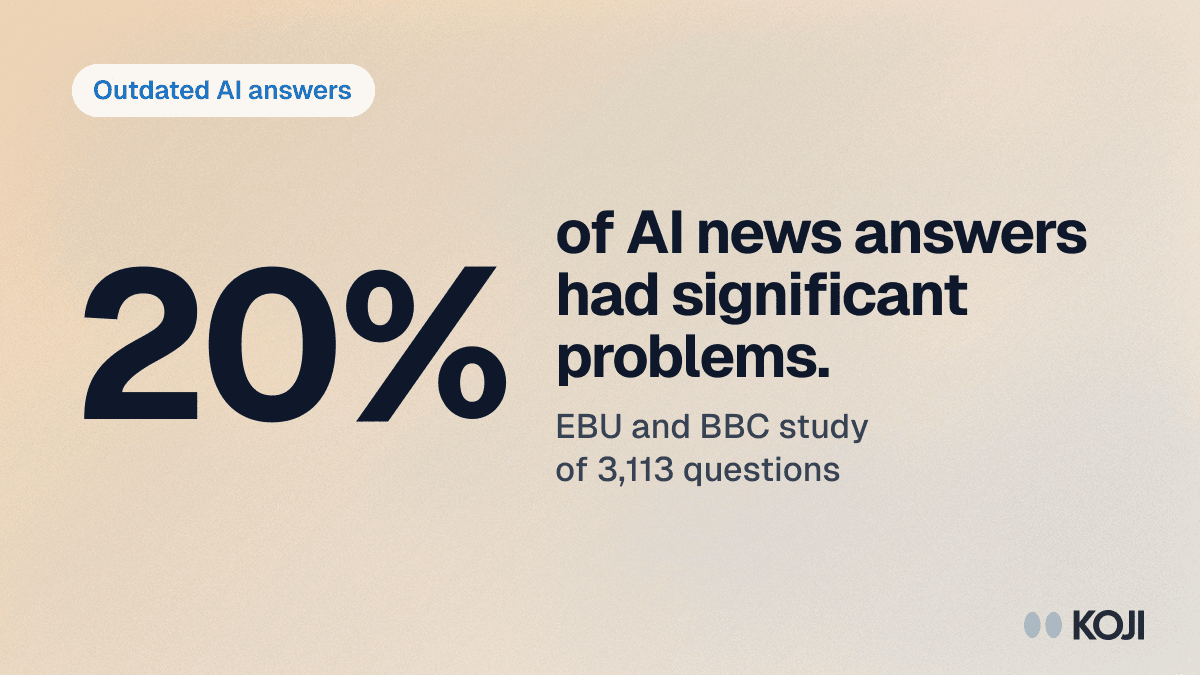
There is a catch. Cheap data is easy to get and easy to get wrong. Pew Research Center tested online opt-in samples and found that 12% of respondents under 30 said they were licensed to operate a nuclear submarine, a share Pew puts at essentially zero in reality (Pew Research Center, 2024). Publish a number like that under your logo and a competitor, a journalist or an AI answer will repeat it with your name on it. The cost of not doing original research is that your category's story gets told with someone else's data. The cost of doing it badly is worse.
What good looks like
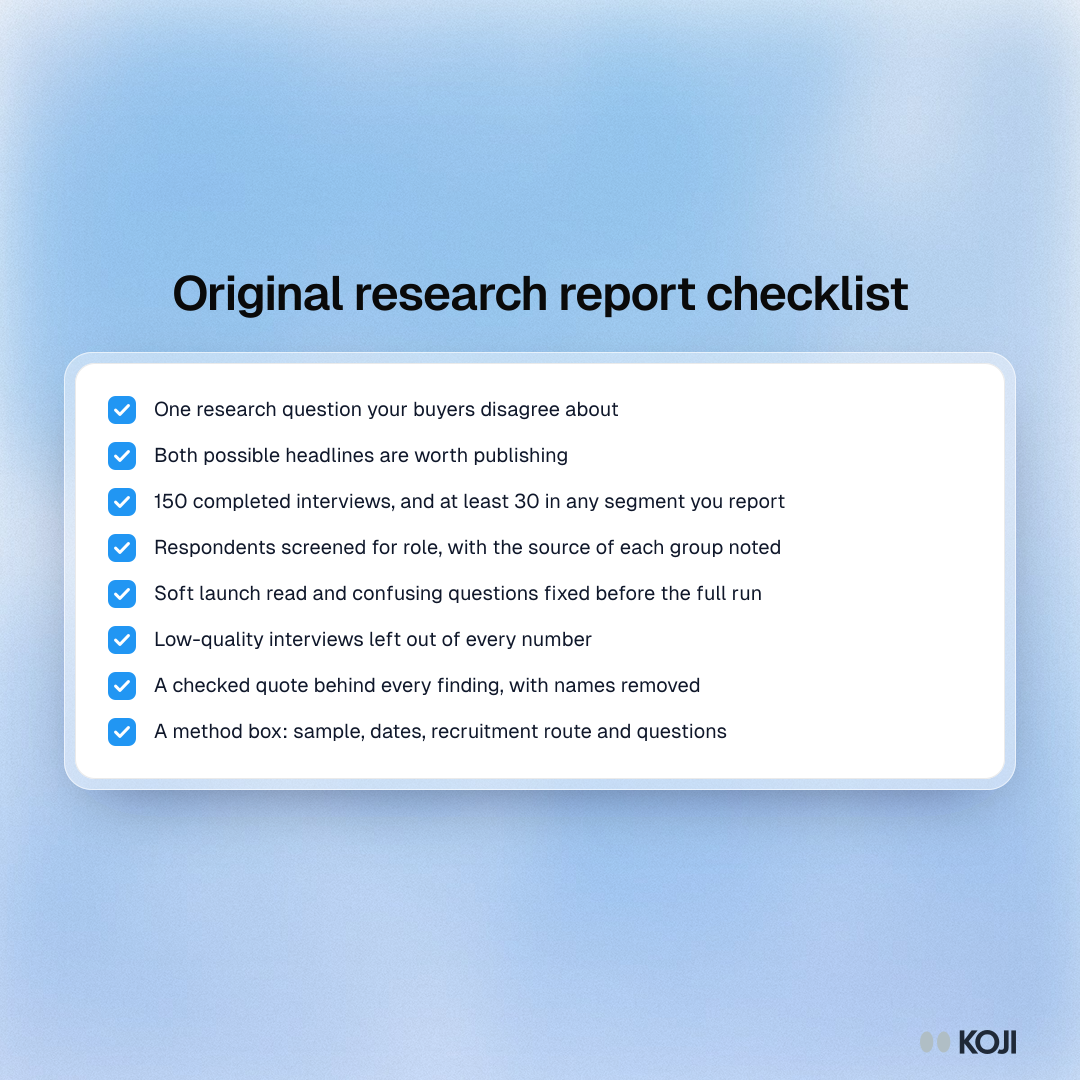
We call the method below the Cite-Ready Report. It takes six weeks from question to publication and rests on one idea: every number you publish should have the reasons behind it, in the respondents' own words.
Pick a question your buyers argue about. "How are mid-market HR teams onboarding new hires in 2027?" is a topic. "Do HR teams that run onboarding in one tool keep new hires longer, and what makes them switch?" is a question with a finding at the end of it. Good report questions have three properties: your buyers disagree about the answer, your own product data cannot answer it, and the answer would change what someone does next quarter.
Write the headline before you field. Draft the headline you hope to publish, then the headline you would publish if the opposite came back. If both are worth publishing, the question is good. If only one is, you are running a campaign, not research, and readers can tell.
Get the sample size right for what you will claim. A share from a sample of 100 carries a margin of error of about ±9.8 points at 95% confidence. At 150 it is about ±8.0, at 200 about ±6.9 and at 400 about ±4.9 (the standard formula for a proportion near 50%). Our rule: 150 completed interviews for an industry report, and no published percentage for any segment with fewer than 30 people. If you want to compare three company sizes, that is 30 or more in each, so plan the quotas before you launch. Our survey sample size guide has the full tables, and the guide to minimum base sizes for segment reporting covers when a small group is too small to show.
Talk to the market, not only your customers. A study of your own customers is useful, but call it what it is: "What 150 of our customers told us". An industry report needs people who have never heard of you. Use a panel or a list of named professionals, screen for the role, and say in the method box where people came from.
Pair every number with a why. Ask the structured question, then let the interviewer follow up on the answer. Say your study finds that 62% rate their onboarding as poor. On its own that is a stat. "62% rate it as poor, and the most common reason is that IT and HR use different start dates" is a finding someone will quote.
Publish your method. Who you spoke to, how you found them, when, how many, which questions and how you checked quality. A method box costs you a paragraph and is what separates a report from a press release.
Common mistakes that sink a report:
- Leading questions written to prove the product's pitch. Readers and journalists spot them at once.
- Surveying only customers and calling it "the industry".
- Publishing a percentage for a segment of 12 people.
- Reporting averages of 1 to 10 scales with no distribution behind them.
- Quotes picked to flatter the sponsor, with the awkward ones left out.
- No quality checks, so bogus and speed-through answers end up in the headline.
- Six months between fieldwork and publication, so the data is old by launch.
The six-week plan
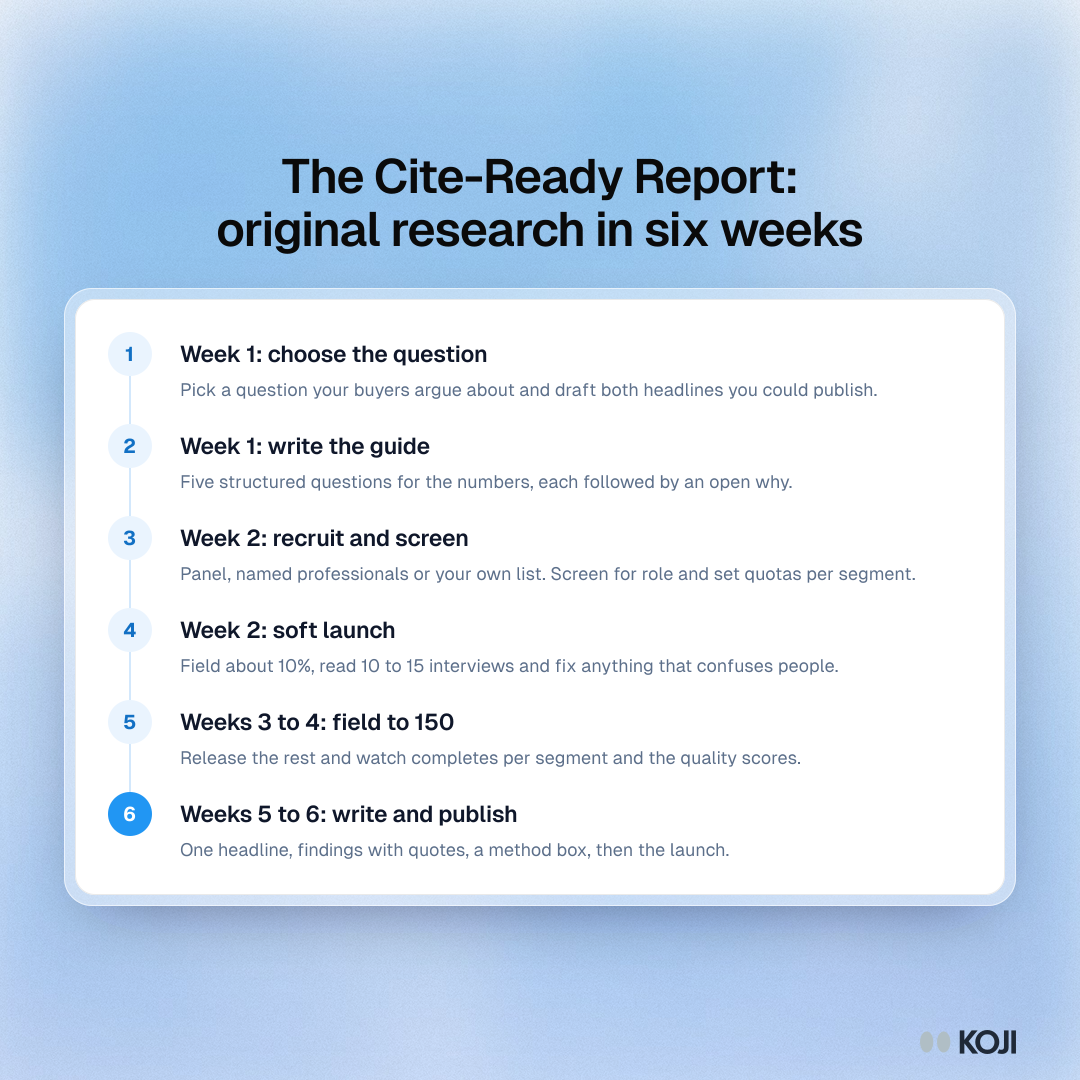
Here is the whole method on one page. Week 1 is the question and the guide, week 2 is recruiting and the soft launch, weeks 3 and 4 are fieldwork, and weeks 5 and 6 are writing and design.
How to set it up in Koji, step by step
-
Start a study from the research box. There is no template for original research, so start from the dashboard's "What do you want to research?" box and paste the brief below. The research brief assistant drafts the goal, the audience and a first set of questions, and you can ask it to change any part. Paste this:
Original research for an industry report: how [role] at [company type] handle [topic] today, what they measure, what frustrates them and what they plan to change in the next 12 months. 150 interviews with people outside our customer base. Include 5 structured questions for headline numbers, each followed by a why.
-
Add structured questions where you need a number. Koji supports open-ended, scale, single choice, multiple choice, ranking and yes/no questions inside the conversation. Each one becomes a chart in the report, and the interviewer can still ask a follow-up about the answer. Turn on shuffled answer options for choice and ranking questions so the first option is not favoured. See the structured questions guide.
-
Add screening questions. Mark which answers qualify or rule someone out ("Which best describes your role?"). Every participant answers them before the interview, whatever route they came in by.
-
Choose text, voice or both. Text suits busy professionals answering between meetings. Voice gets longer stories. For a report, offer both. Turn on Remove personal details in the study's Privacy settings so names, emails and employers are taken out of transcripts before analysis; you are going to quote these people in public.
-
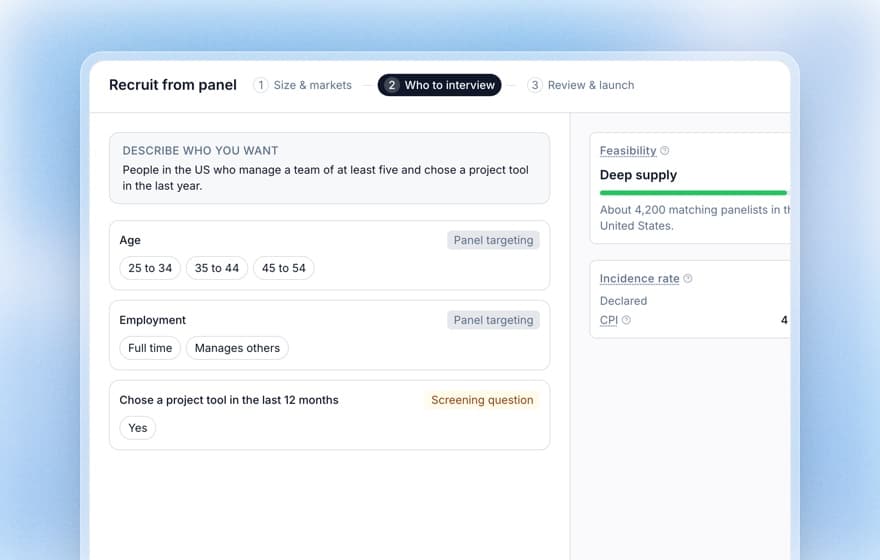
Recruit the people. You have three routes, and you can combine them:
- Koji's research panel (Panel recruit tab on the Interviews page): describe the audience in plain words, add targeting and see the price before you launch. Launch with a soft launch, which fields about 10% of the goal and pauses so you can read the first interviews before the rest run. See recruiting from Koji's panel.
- Find people (Participants page): search professional profiles by job title, seniority, company size, industry and location, preview who matches for free, and buy the number you need. Each person comes with a verified work email, ready to invite by recruitment email. Good for narrow B2B roles a consumer panel cannot reach. Check the rules on contacting people by email where you and they are based.
- Your own list: import a CSV of newsletter subscribers or community members and send personal invite links. Report these separately from the market sample.
Add an incentive if the audience is senior. Koji pays it as a gift card, prepaid Visa or donation after you approve each interview.
-
Read the soft launch, then release. Read 10 to 15 interviews. Are the screeners letting the right people through? Is any question confusing? If all is well, release the rest. If not, stop the recruitment instead (the unused credits come back), duplicate the study, fix it and launch again, so every published number comes from the same questions.
-
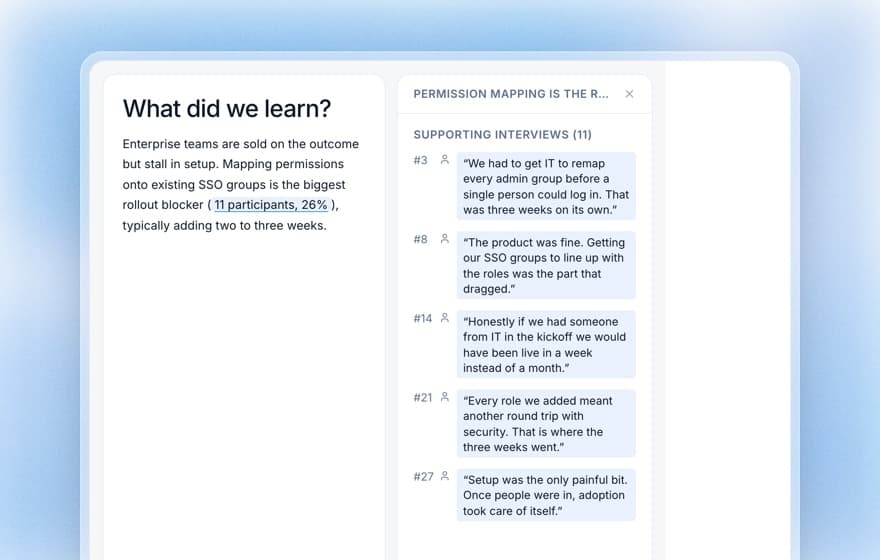
Read the report. Each interview gets a quality score from 1 to 5, and only interviews scoring 3 or more enter the report or use credits. The report shows a chart for each structured question, themes from the open questions with the share of participants behind each finding, and the supporting quotes one click away. Download it as an editable PowerPoint deck or a PDF for your designer.
Which plan. Panel recruitment and Find people need a paid plan. The Interviews plan (€79 a month, 79 credits, 3 seats) suits a team running a report: a text interview uses 1 credit and a voice interview 3, panel interviews are priced in the wizard before you launch, and Find people costs 1 credit per person delivered. Check current plans on the pricing page.
Copy this interview guide
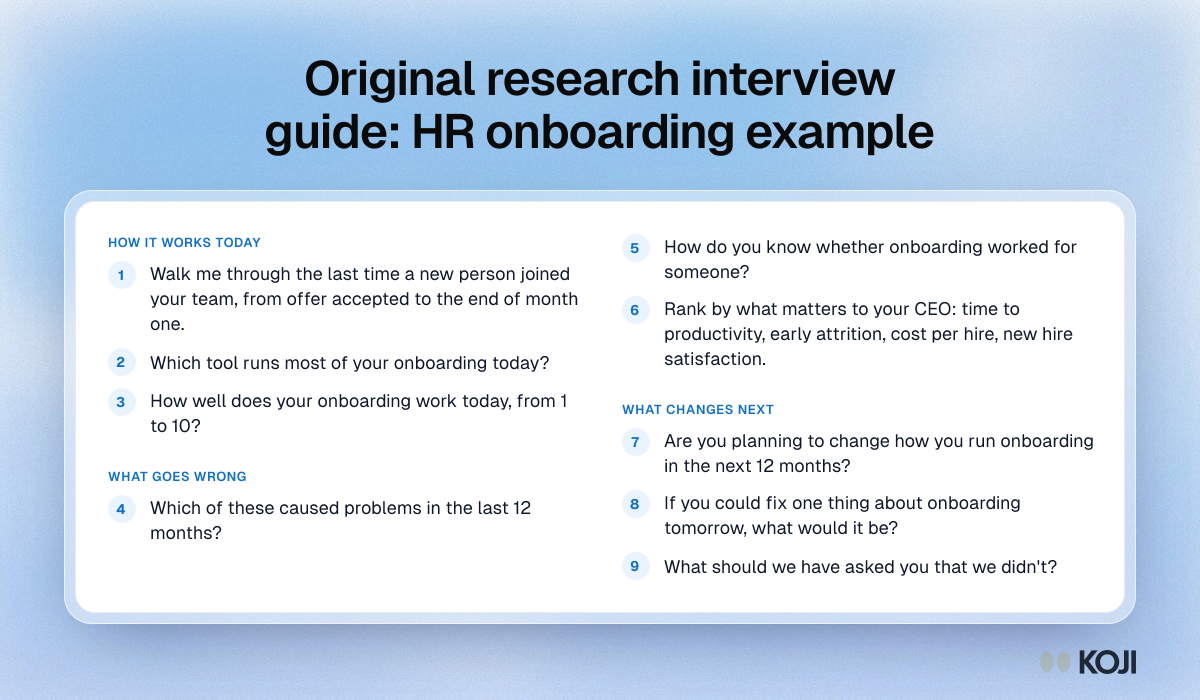
Paste this into any tool. It is written for the HR onboarding example, so swap the topic words for yours.
Opening line: "Thanks for joining. We're talking to HR leaders about how they bring new people on board. There are no right answers, and nothing you say will be linked to your name or company."
- Open. "Walk me through what happened the last time a new person joined your team, from offer accepted to the end of their first month." Probe: Where did it slow down?
- Single choice. "Which tool runs most of your onboarding today?" (HR system, separate onboarding tool, spreadsheets and email, no set process, other) Probe: Why that setup?
- Scale, 1 to 10. "How well does your onboarding work today?" Probe: What would move it up two points?
- Multiple choice. "Which of these caused problems in the last 12 months?" (equipment late, accounts not ready, unclear first tasks, manager not prepared, paperwork, none) Probe: Tell me about the worst one.
- Open. "How do you know whether onboarding worked for someone?" Probe: What do you report to leadership?
- Ranking. "Rank these by how much they matter to your CEO: time to productivity, early attrition, cost per hire, new hire satisfaction." Probe: Has that order changed this year?
- Yes/no. "Are you planning to change how you run onboarding in the next 12 months?" Probe: What would trigger it, and who decides?
- Open. "If you could fix one thing about onboarding tomorrow, what would it be?" Probe: What has stopped you so far?
Closing question: "What should we have asked you that we didn't?"
What you get
After six weeks you have three things.
The headline numbers, as charts per question, with the sample size beside each. They go straight into the report and the launch post.
The reasons, as themes with the share of participants behind each and the quotes underneath. These become the report's chapters and the pull quotes your designer lays out.
Segments, when you planned quotas. A line such as "companies over 500 staff rate onboarding three points lower" is the kind of line journalists and AI answers pick up.
How the team uses it the next week: content writes the report and a launch post from the findings; demand gen gates the full report and puts three charts in paid social; sales gets a one-page summary with the two findings that matter most to their buyers; PR pitches the headline with the method box attached. Then the study gets reused: duplicate it in a year with the same questions and you have a trend, which is the second report.
The same playbook elsewhere
The same approach, numbers plus reasons from one set of interviews, runs in other teams. Product managers use it for a quarterly planning evidence sprint before roadmap decisions. GTM teams use it to learn what buyers asked AI before they called, a natural extra chapter for your report. Inside marketing, the self-reported attribution playbook uses the same mix of structured and open questions to find where buyers heard about you. Browse every marketing playbook in the use-case library.
Why Koji for original research
| Koji (AI interviews) | Survey panel | Research agency | Manual interviews | |
|---|---|---|---|---|
| Numbers and reasons | Both, from the same people | Numbers, short open text | Both, separate phases | Reasons, few numbers |
| Time to results | Days of fieldwork | Days | Weeks to months | Weeks |
| Sample size | 150 or more is routine | Hundreds or thousands | Set by budget | 15 to 30 |
| Follow-up on answers | Every answer can be probed | None | In the qualitative phase | Yes, by hand |
| Quality checks | Score per interview, low scores left out | Attention checks | Agency process | Your judgement |
| Who does the analysis | Report drafted for you | You | Agency | You |
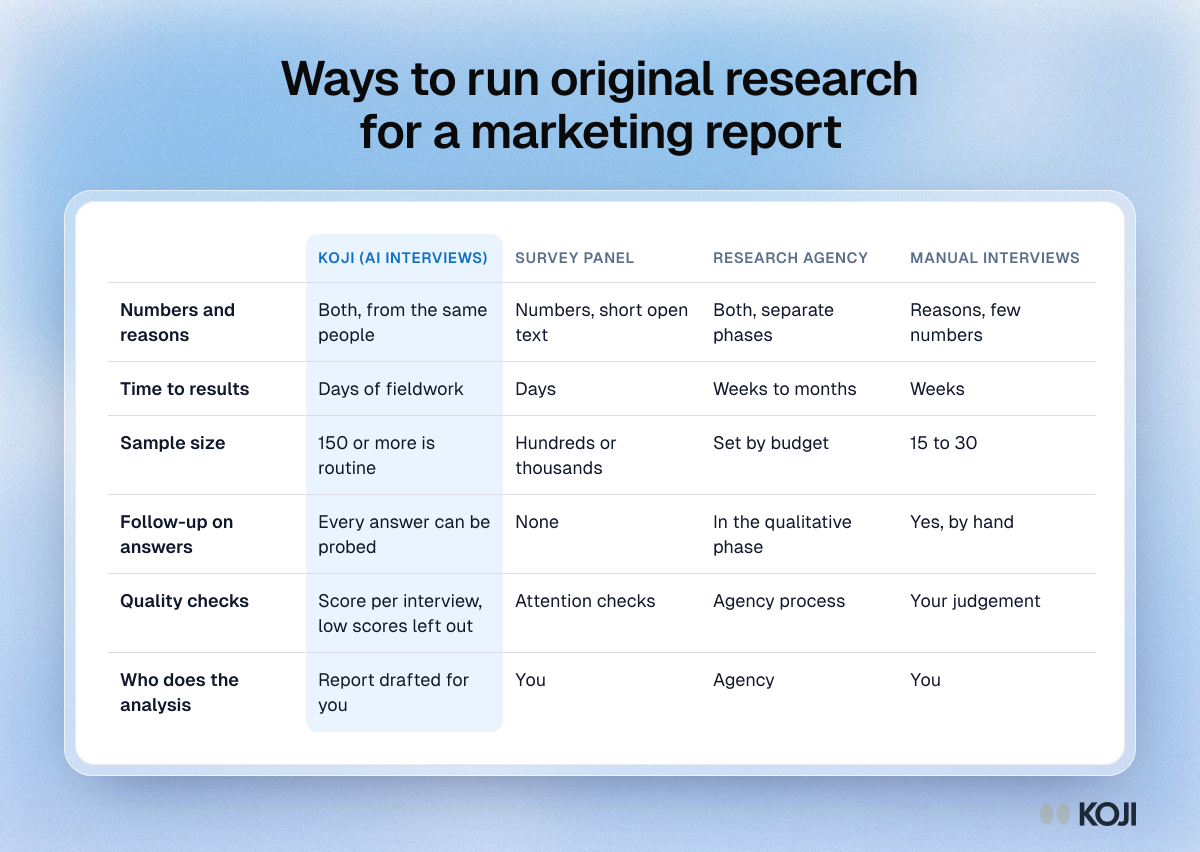
To be fair to the alternatives: survey panels are cheap per response. Pollfish lists pricing from $0.95 per response (Pollfish) and SurveyMonkey Audience from $1 per response (SurveyMonkey), with the final price depending on targeting and length. For a 2,000-person tracker with no need for reasons, a panel survey is the right tool. Agencies bring sampling expertise and a brand name journalists recognise; they rarely publish prices because each study is scoped.
Reasons Koji fits this job:
- Numbers and quotes come from the same interview. Structured questions sit inside the conversation, so every percentage has the follow-up answers behind it.
- You can reach people who have never heard of you, through the panel or Find people, and screen them before the interview.
- Low-effort interviews stay out. Interviews scoring below 3 for quality are not in the report and do not use credits.
- Every finding links to its evidence, so you can check a claim before it goes to print.
- The report leaves as a deck. Download it as an editable PowerPoint or a PDF and hand it to design.
Questions you might have about AI interviews
Will professionals talk to an AI interviewer about their work? They answer in text or voice, when it suits them, without booking a call. The welcome page says how long it takes, and you can say up front that answers are confidential. Take your own interview in the Preview tab first; previews are free and do not count as responses.

Photo by Microsoft Copilot on Unsplash
Can I trust the numbers enough to publish them? In text interviews, structured questions appear as buttons, sliders, checkboxes or drag lists, so the answer counted is the one the participant picked; in voice they are asked in conversation. If a figure is going in a headline, run the study in text, or report the text and voice answers side by side. Quality scoring keeps low-effort interviews out of the report, and you can report fraudulent or low-effort panel completes. You still own the final check: read the soft launch, and read the interviews behind any finding you put in a headline.
What about the participants' data? Turn on Remove personal details and names, emails, phone numbers, addresses and employers are taken out of the transcripts when each interview finishes. It can miss details, so read every quote before it goes in the report.
When Koji may not be the right fit
If your report's value is a precise national estimate, such as "38.2% of US adults", you need a probability-based sample and a statistician, not an online panel of any kind. If you need several thousand respondents for a tracker and no reasons, a survey panel is cheaper. And if the people you need are a dozen named executives, book the calls yourself; the relationship is worth more than the scale.
Metrics to track
- Completed interviews against target, and per segment.
- Average quality score and the share of interviews left out.
- Soft-launch changes made before release.
- Downloads and gated leads from the report.
- Backlinks, press mentions and citations in AI answers in the 90 days after launch.
- Pipeline influenced by people who downloaded or were sent the report.
FAQ
How many interviews do I need for an industry report? 150 completed interviews, with at least 30 in any segment you report on its own. At 150 the margin of error on a share is about ±8 points.
How long does it take? Six weeks: one to choose the question and write the guide, one to recruit and soft launch, two to field, two to write and design.
Can I use only my customers? Yes, but call it a customer study. An industry report needs people outside your customer base, recruited and screened the same way.
Should we interview by voice or text? Offer both. Text is easier for busy professionals; voice gives longer stories and better quotes.
Can AI assistants and journalists cite the report? They can if they can find the method. Publish a method box on the report page with the sample, dates, recruitment route and questions.
How do we publish quotes safely? Turn on Remove personal details, quote people by role and company size only, and read every quote before it goes in print.
Ready to start?
Sign up, paste the brief from step 1 into "What do you want to research?", and you will have a draft study in minutes. Read the Koji page for marketing teams for the other studies marketers run, or browse all marketing use cases.