Column chart
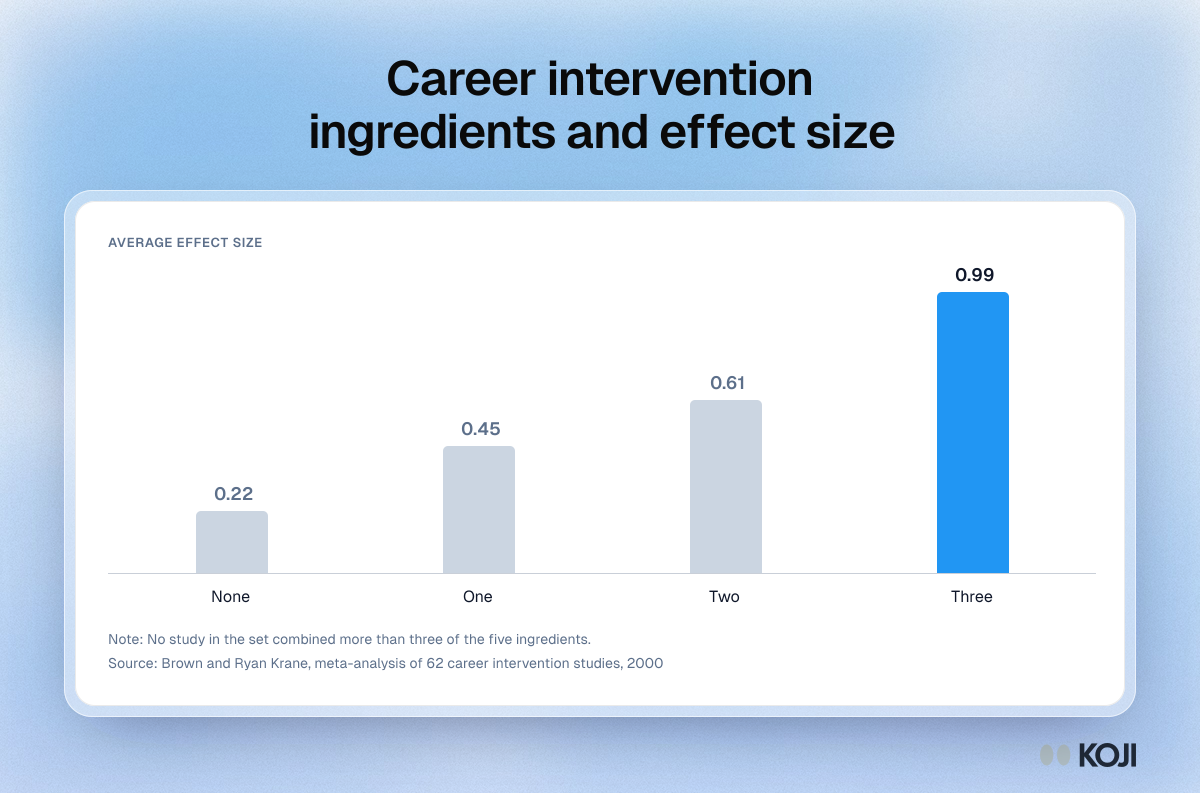
Career intervention ingredients and effect size
How the number of critical ingredients relates to the effect of career choice interventions
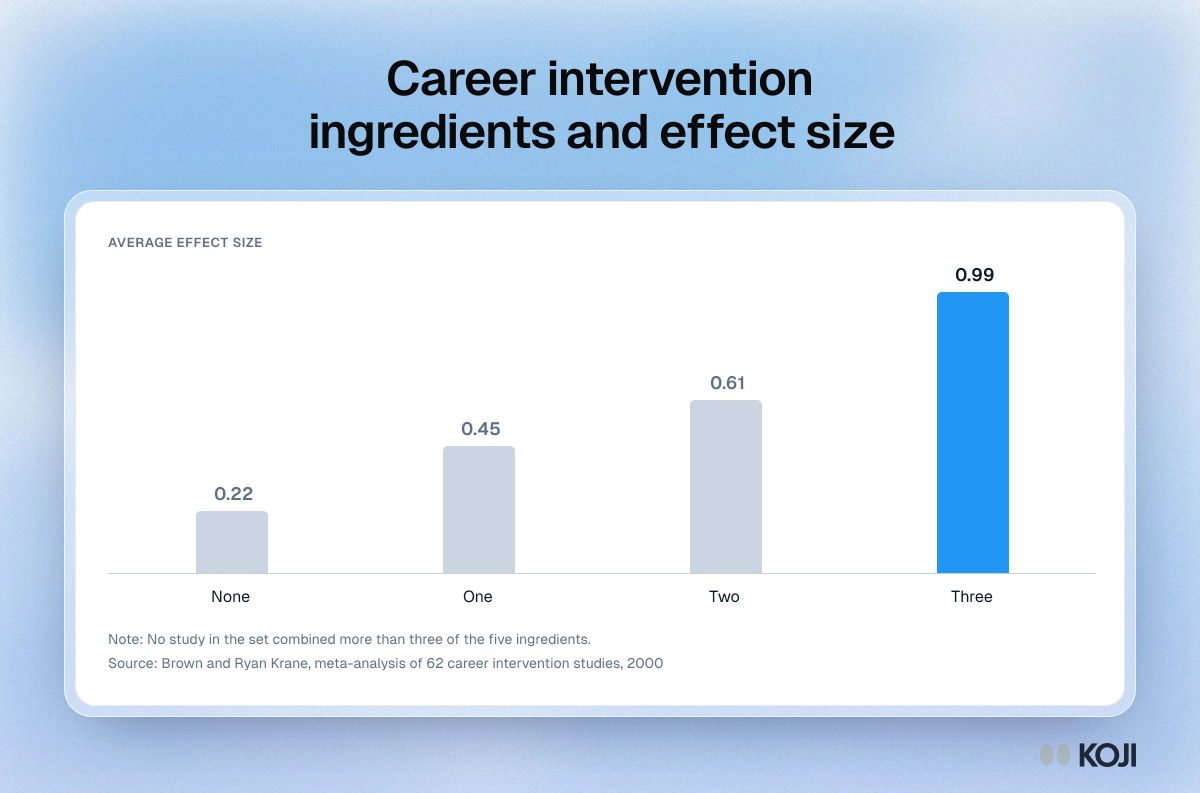
A column chart of results from Brown and Ryan Krane's meta-analysis of 62 career intervention studies. Interventions that used more of five critical ingredients (written exercises, individual feedback, world-of-work information, modelling and building support) had larger average effects. Careers services and quality teams can use it to check which ingredients their own offer includes before judging its outcomes. Koji can help gather what students say they took from each part of the service.
What's in this column chart
| Average effect size | |
|---|---|
| None | 0.22 |
| One | 0.45 |
| Two | 0.61 |
| Three | 0.99 |
No study in the set combined more than three of the five ingredients.
Use this image
Free to use in your docs, decks and posts under CC BY 4.0, as long as you credit Koji with a link to this page. To embed it, paste this into your page:
<a href="https://www.koji.so/visuals/career-intervention-critical-ingredients-effect-size"><img src="https://www.koji.so/visuals/career-intervention-critical-ingredients-effect-size/career-intervention-critical-ingredients-effect-size.png" alt="Column chart of average effect size by number of critical ingredients in a career intervention: 0.22 with none, 0.45 with one, 0.61 with two, 0.99 with three." width="1200" height="793" /></a>
<p>Source: <a href="https://www.koji.so/visuals/career-intervention-critical-ingredients-effect-size">Career intervention ingredients and effect size</a>, Koji</p>