Bar chart
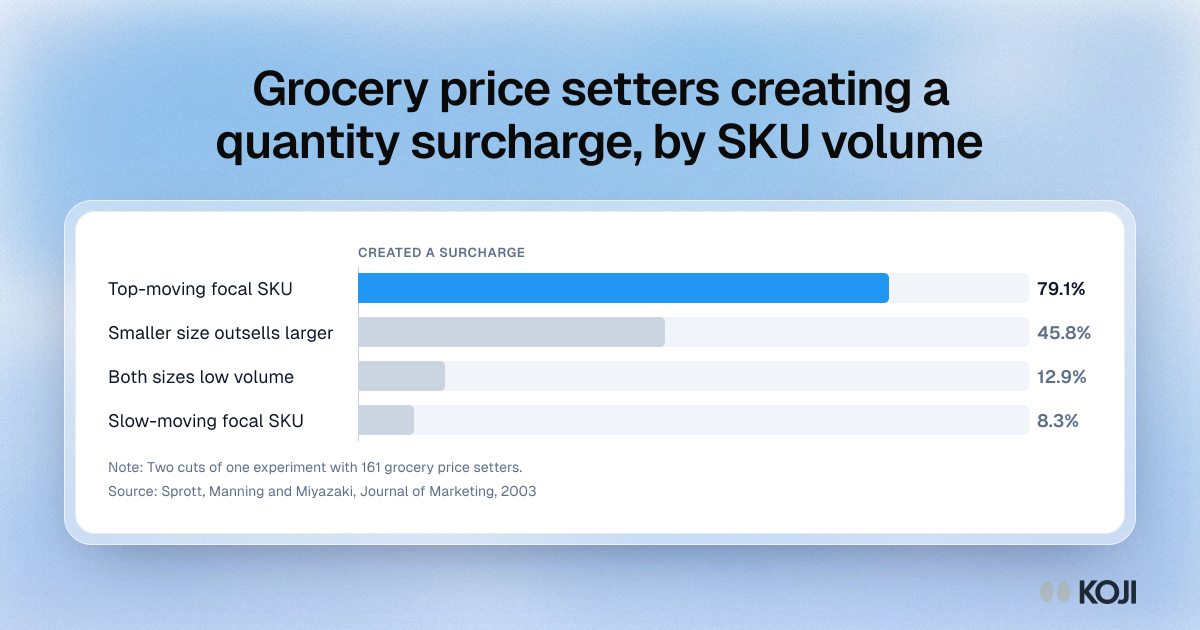
Grocery price setters creating a quantity surcharge, by SKU volume
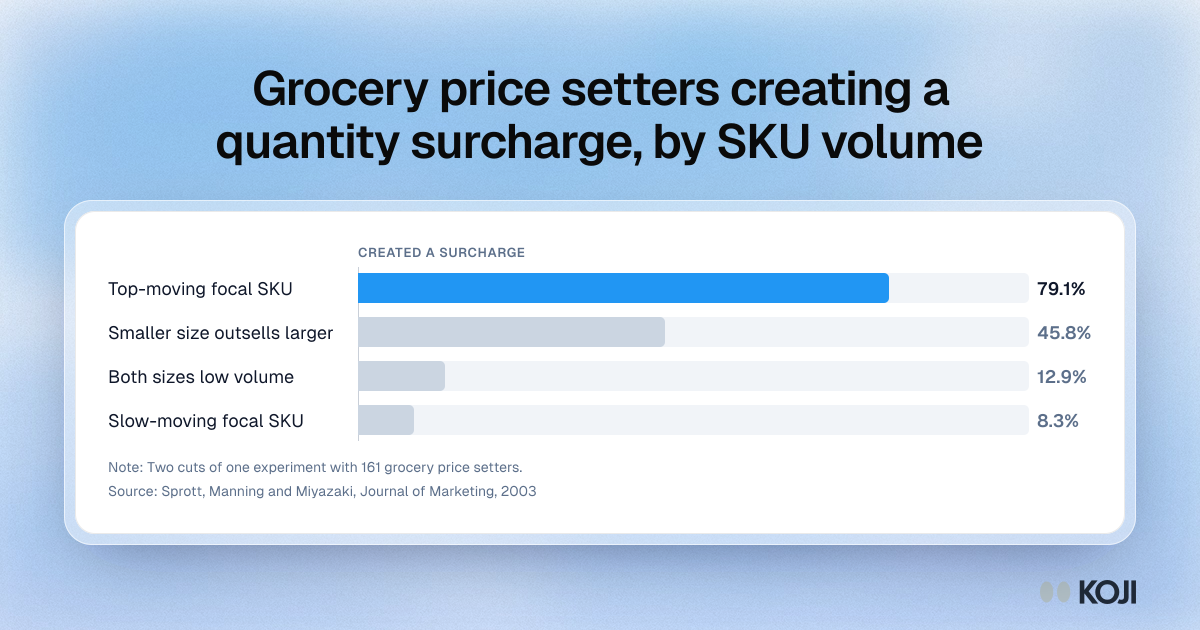
Results from an experiment with 161 grocery price setters who faced lower competitor prices. They created a quantity surcharge 79.1% of the time when the focal item was a top-moving SKU and 8.3% when it was slow-moving. When the smaller size sold far more than the larger, 45.8% created one, against 12.9% when both sizes sold little. Useful for brand teams who assume their pack ladder reaches the shelf intact.
Where this appears
What's in this bar chart
| Price setters | |
|---|---|
| Top-moving focal SKU | 79.1% |
| Smaller size outsells larger | 45.8% |
| Both sizes low volume | 12.9% |
| Slow-moving focal SKU | 8.3% |
Two cuts of one experiment with 161 grocery price setters.
Use this image
Free to use in your docs, decks and posts under CC BY 4.0, as long as you credit Koji with a link to this page. To embed it, paste this into your page:
html
<a href="https://www.koji.so/visuals/quantity-surcharge-rate-by-sku-sales-volume"><img src="https://www.koji.so/visuals/quantity-surcharge-rate-by-sku-sales-volume/quantity-surcharge-rate-by-sku-sales-volume.png" alt="Bar chart: grocery price setters created a quantity surcharge 79.1% of the time on a top-moving SKU vs 8.3% on a slow-moving one." width="1200" height="630" /></a>
<p>Source: <a href="https://www.koji.so/visuals/quantity-surcharge-rate-by-sku-sales-volume">Grocery price setters creating a quantity surcharge, by SKU volume</a>, Koji</p>