A redesign before-and-after study asks the same users the same short usability questions twice: once before the new design ships and again a few weeks after, with an interview around the scores so you learn why each one moved. Running it as AI-moderated interviews gives you the number and the reasons from the same people in the same session, at a sample size that can show a real change. By the end of this playbook you'll have a timeline counted back from launch, a sample-size rule, a copy-ready interview guide and the exact setup in Koji.
Say you're the only researcher on a product team, the redesign of the main dashboard ships in six weeks, and your VP of Product has already asked how you'll know it worked. You have six weeks, which is enough. The comparison is usually lost before launch, because nobody measured the old design.
Why the redesign before-and-after study matters now
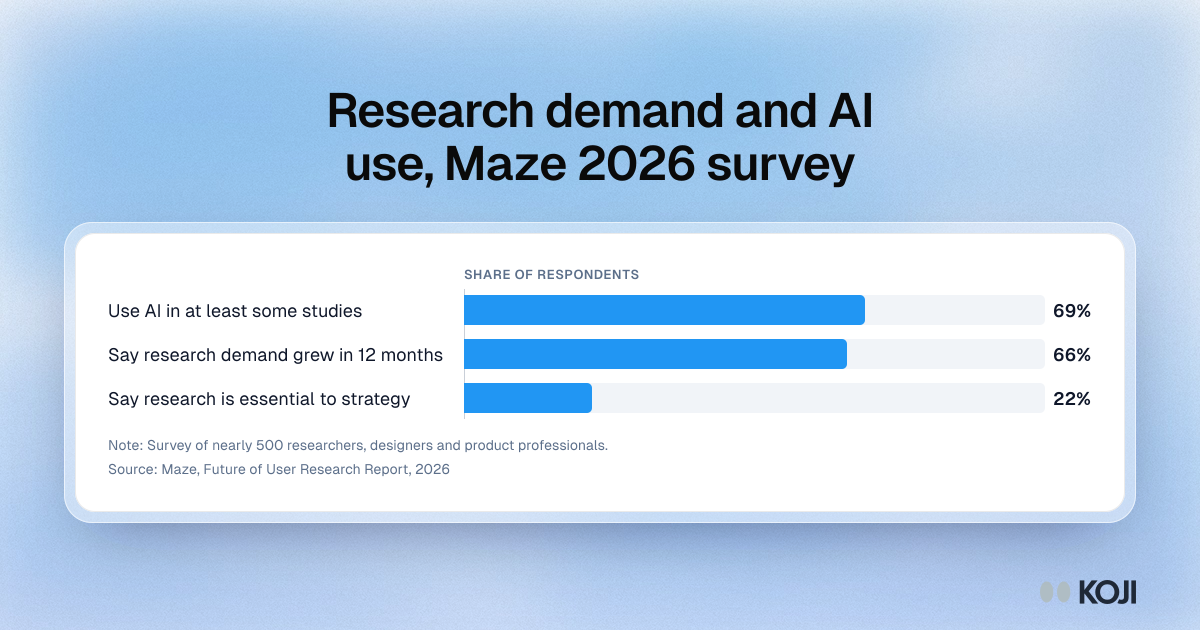
Demand for evidence is rising faster than research teams. In Maze's Future of User Research Report 2026, a survey of nearly 500 researchers, designers and product professionals, 66% said demand for user research had grown in the past 12 months, up from nearly 55% the year before (Maze, 2026). The same report found 69% use AI in at least some of their studies, and the share of organisations where research is essential to strategy rose from 8% to 22%.
A redesign is where that pressure lands. It's expensive, everyone has an opinion about it, and the launch week is loud. Nielsen Norman Group's long-standing point about change still holds: a wave of complaints about a new interface doesn't by itself show the new design is worse; it shows it's new, and people don't like relearning (NN/g, Users Hate Change). Google's team called this change aversion when they moved users from the Docs List to Google Drive, and treated it as something to plan for before launch rather than argue about after (Sedley and Müller, CHI 2013).
So you need a number that separates "unfamiliar" from "worse", and you need it from before launch. Nielsen Norman Group's survey of 557 UX and design professionals found design teams report their strongest impact on product usability, and struggle most to show impact on business metrics such as revenue and acquisition (NN/g, State of Design Teams). A clean before-and-after score is the most defensible way to show what research and design changed. Skip the baseline and the redesign gets judged on launch-week anecdotes, by whoever shouts loudest.
What good looks like
Here is how teams who do this well run it.
Measure perceived usability with a short, standard score. The System Usability Scale (SUS) is the familiar one: across roughly 500 studies MeasuringU puts the average SUS at 68, the 50th percentile (MeasuringU). But ten agreement items inside a conversation feels like a form. Use UMUX-Lite instead: two items on a 1 to 7 agreement scale ("This product's capabilities meet my requirements" and "This product is easy to use"), introduced by Lewis, Utesch and Maher at CHI 2013. A review of 16 published comparisons by Lah, Lewis and Šumak (2020) found SUS and UMUX-Lite differed by only 0.4 points on average (MeasuringU summary). Our UMUX-Lite guide has the scoring.
Interview the same people twice. This is the decision that matters most. MeasuringU's sample-size tables for SUS (standard deviation 17.7) show that to detect a 15-point difference at 90% confidence and 80% power you need about 11 people measured twice, or 38 people in two separate groups of 19 (MeasuringU). Their own caveat: the simple formulas underestimate below about 20 people. Our rule:
- Same people both rounds (preferred): recruit 30 in round 1 so 20 or more complete round 2.
- Different people each round: 40 or more per round, from the same segment.
- Fewer than 15 active users of the redesigned area: skip the score and run it as a qualitative debrief. A number from 8 people will mislead.
Wait out the change aversion. Re-measure no sooner than four weeks after launch, and no later than eight, while people still remember the old version. In week one you're measuring surprise.
Ask about the work, not the screens. Before launch, people can't compare anything. Ask them to walk through the last time they did the core task, then score. After launch, ask the same thing, then ask what's different.
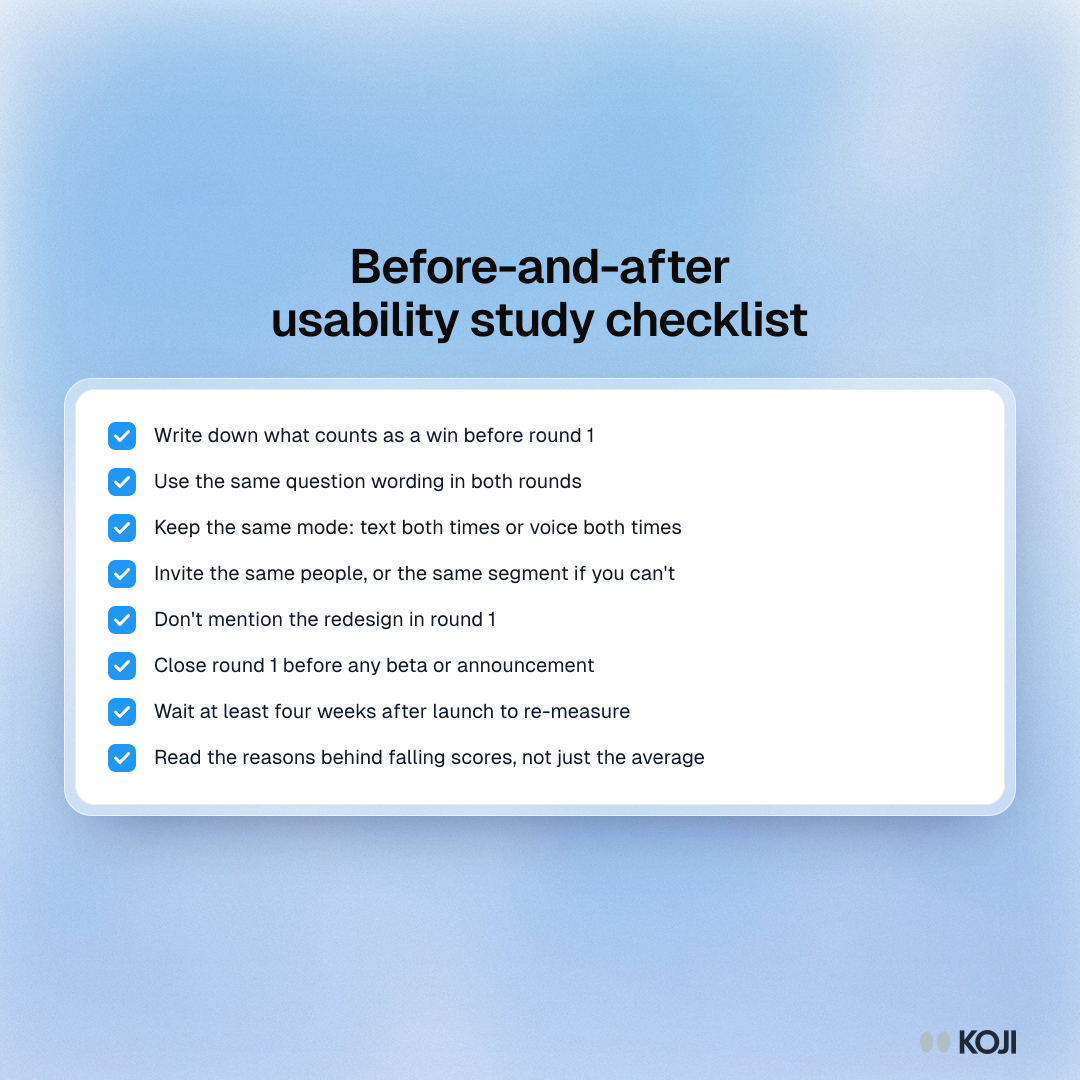
Pre-register what "worked" means. Write down, before round 1, the change you'll call a win (say, UMUX-Lite up by 10 points and no task rated harder). It stops the post-launch debate about what the numbers mean.
Common mistakes:
- Measuring only after launch, so there's nothing to compare to
- Changing a word of the questions between rounds
- Switching from text to voice, or panel to own users, between rounds
- Re-measuring in launch week
- Reading the average and never the reasons behind the low scores
- Telling round 1 participants a redesign is coming, which primes them
The before-and-after timeline
Counted back from launch day, this is the schedule we'd run.
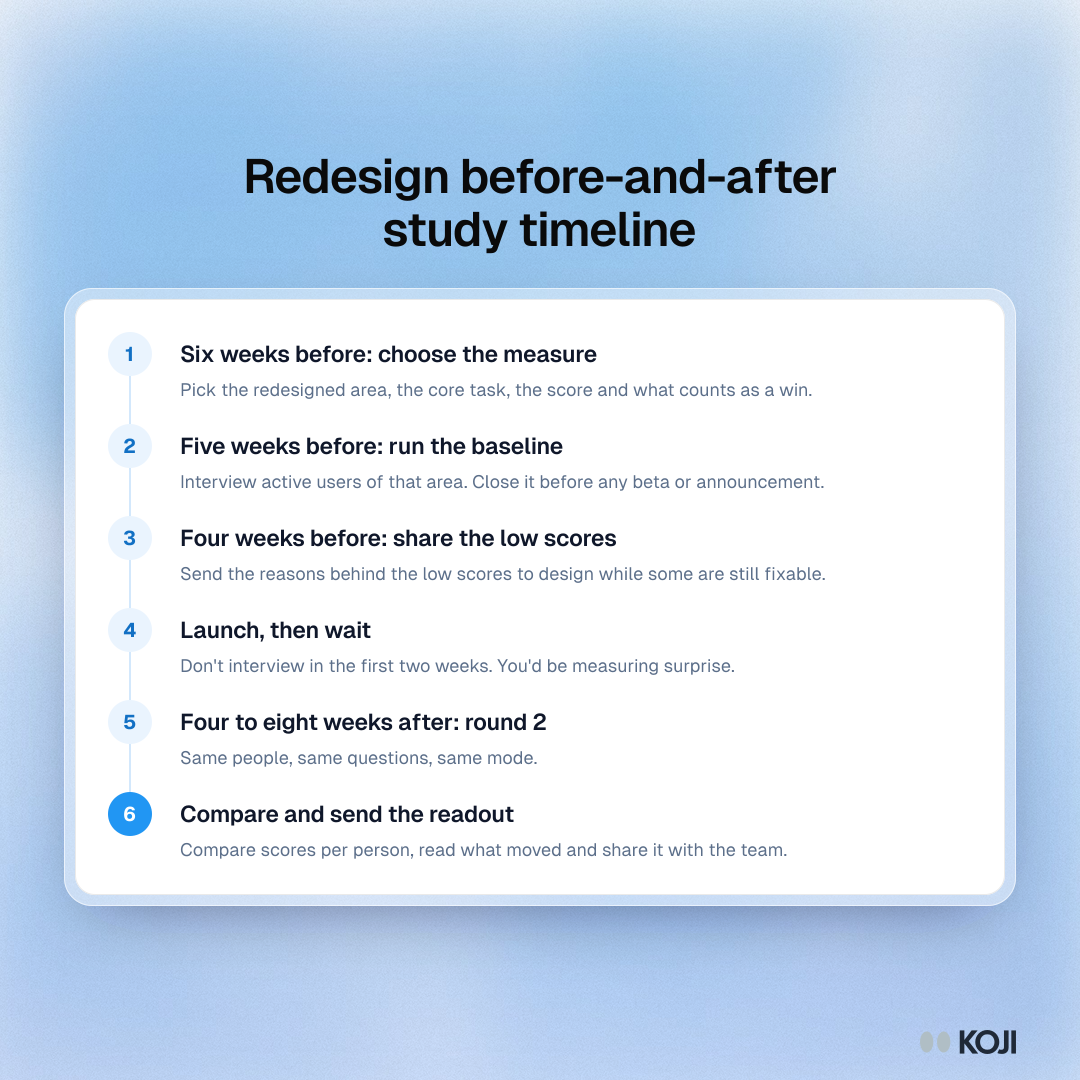
- Six weeks before: pick the redesigned area, the core task, the measure and the win condition.
- Five weeks before: run round 1 with active users of that area. Close it before any beta or announcement.
- Four weeks before: read the baseline and share the reasons behind the low scores with the design team. Some will still be fixable.
- Launch. Don't interview in the first two weeks.
- Four to eight weeks after: run round 2 with the same people, same questions, same mode.
- Then: compare per person, read what moved, and send the readout.
How to set up the study in Koji, step by step
Round 1 takes one setup, and round 2 is a copy of it.
- Start the study. From the dashboard's template gallery, filter to UX Researchers and pick Evaluative Post-Test Interviews. Or paste this brief into the "What do you want to research?" box: "Measure how easy and useful [area] is for active users before our redesign ships, and why, so we can compare the same people after launch."
- Shape the brief. Set the decision to inform ("Did the [area] redesign make the core task easier?"), the target participant (people who used [area] in the last 30 days) and a guardrail: the interviewer must not mention a redesign or new version.
- Add the structured questions. Add the two UMUX-Lite items as Scale questions on the 1 to 7 Agreement range, with "Strongly disagree" and "Strongly agree" as end labels. Turn on Score-aware probing so low and high scores get different follow-ups. Add a 1 to 7 Scale for how easy the core task was last time.
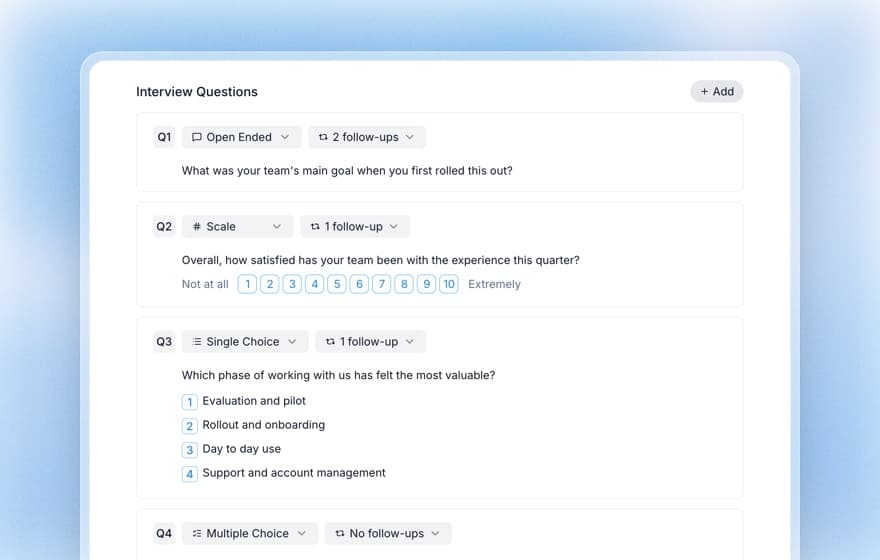
- Choose voice or text. Text interviews show the scale as buttons and cost 1 credit each; voice interviews ask the scale aloud and cost 3. Pick one and keep it for both rounds.
- Add a screening question. "When did you last use [area]?" with "In the last 30 days" as the only qualifying answer.
- Invite the same people. On the Interviews plan, import your list on the Self-recruit tab and give each person their own invite link, so every interview is tied to a person and you can invite exactly the same people to round 2. On Insights and up you can email audiences from Participants with reminders. Preview the interview yourself first: previews are free.
- Read the baseline. The report shows each scale question's mean, median and distribution, with the quotes behind each score. Export responses as CSV to compute each person's UMUX-Lite score.
- Run round 2. Duplicate the study from its card menu: you get a new draft with the same brief, intake and study settings. Check the voice or text setting, re-import the same list and invite.
Which plan? Free gives you 10 credits at signup, enough to pilot the guide. A 30-person text round uses about 30 credits, since only interviews that score 3 or more on quality use credits or reach the report (how quality scores work). Interviews (€79 a month, 79 credits, 3 seats) includes personal invite links, which you need to match people across rounds.
Copy this interview guide
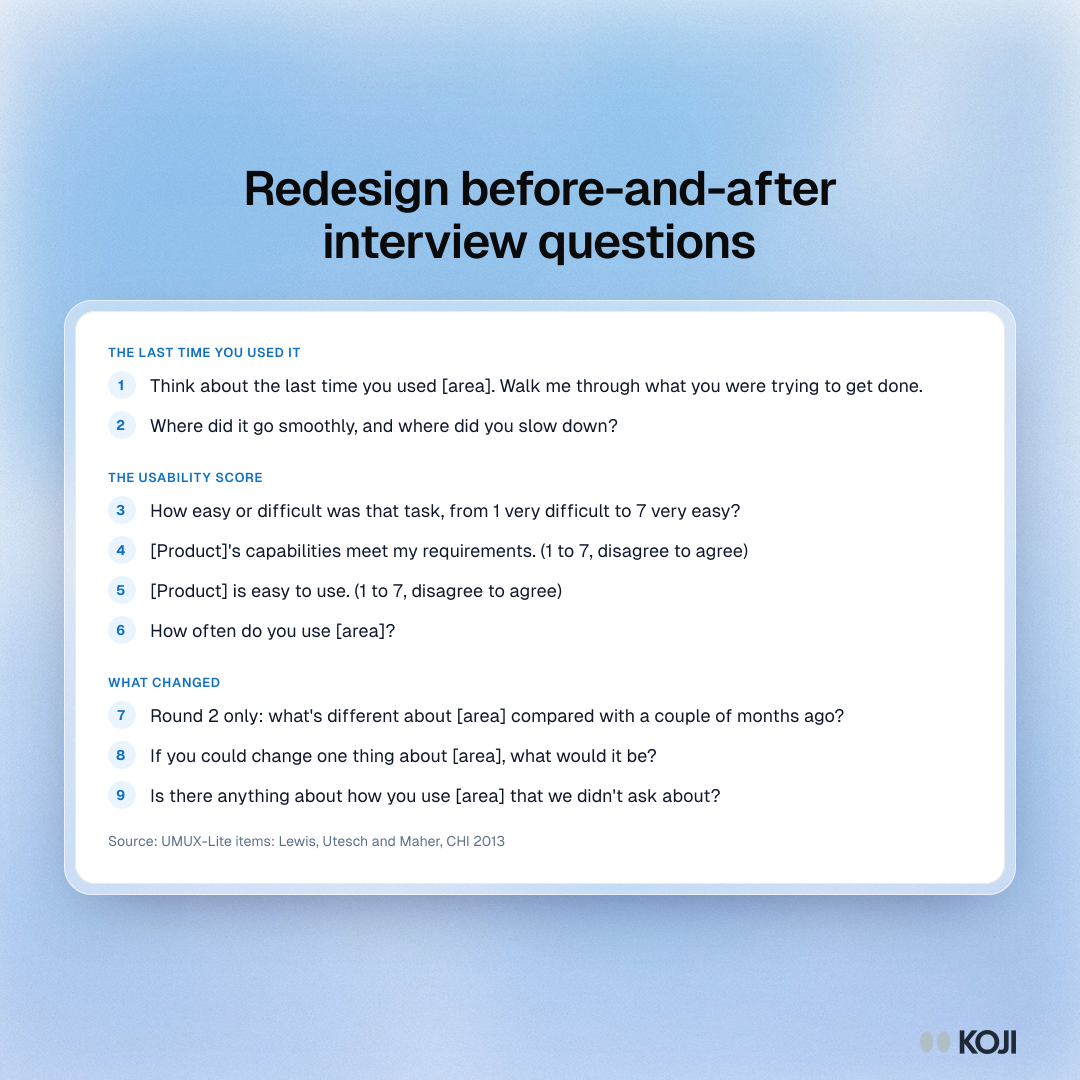
Paste this into any tool. Keep every word identical in round 2, except the one question marked as round 2 only.
Opening: "Thanks for making time. We want to hear how [area] works for you today. There are no right answers, and nothing you say will be traced back to you in what we share."
- Open. "Think about the last time you used [area]. Walk me through what you were trying to get done." Probe: "What happened right before that?"
- Open. "Where did it go smoothly, and where did you slow down?" Probe: "What did you do when you got stuck?"
- Scale 1 to 7. "How easy or difficult was that task, from 1 very difficult to 7 very easy?" Probe: "What would have made it one point easier?"
- Scale 1 to 7, agreement. "[Product]'s capabilities meet my requirements." Probe: "What's missing for you?"
- Scale 1 to 7, agreement. "[Product] is easy to use." Probe on low scores: "Tell me about a moment that made it hard."
- Single choice. "How often do you use [area]?" Daily, weekly, monthly, less often. No probe.
- Open, round 2 only. "What's different about [area] compared with a couple of months ago?" Probe: "Is that better, worse or just different for you?"
- Open. "If you could change one thing about [area], what would it be?" Probe: "Why that one?"
Closing: "Is there anything about how you use [area] that we didn't ask about?"
What you get
After round 2 you have two reports with identical questions, and a CSV per round you can join on each person's name. That gives you:

Photo by Fatemeh Rezvani on Unsplash
- The headline: the change in mean UMUX-Lite and in task ease for the same people, with the size of the change against the win condition you wrote down.
- The reasons, sorted by direction: quotes from people whose scores rose, fell and stayed flat. People whose score fell are your fix list for the next sprint.
- A per-segment read: split the change by how often people use the area. Daily users have the most habits to relearn, so read them on their own.
- A readout you can send: download the report as slides or a PDF for the design review, then lead with the per-person change and three quotes.
Your design partner should get the "fell" quotes the same day. Your VP gets the one-slide answer: did it work, for whom, and what's next.
The same playbook elsewhere
The before-and-after shape carries straight over. Product managers use it to measure a launch in its first 30 days, see the launch window interviews playbook. Customer success teams run the same pairing around a forced migration to a new version. And if your team is weighing AI moderation for this kind of study, the AI moderator pilot playbook shows how to test it against your own moderators first. More playbooks for researchers live at /use-cases/researchers.
Why Koji for redesign before-and-after studies
Here is how the realistic options compare on what this study needs.
| Survey tool with SUS | Unmoderated test platform | Moderated sessions | Koji | |
|---|---|---|---|---|
| Score and reasons from the same person | Score, optional comment | Score and recording | Yes | Yes, with follow-ups on every score |
| Follows up on a low score | No | No | Yes | Yes, score-aware probing |
| Same people in both rounds | With your own list | Depends on the panel | Yes, if you schedule it | Personal invite links per person |
| Sample size for a real comparison | Easy | Easy | Hard, moderator hours | Easy, interviews run in parallel |
| Same questions every time | Yes | Yes | Varies by moderator | Yes, structured questions |
| Analysis effort | Low for scores, high for comments | Hours of video | Hours of notes | Report with quotes per score |
| Tests tasks in the live product | No | Yes | Yes | No, asks about real use |
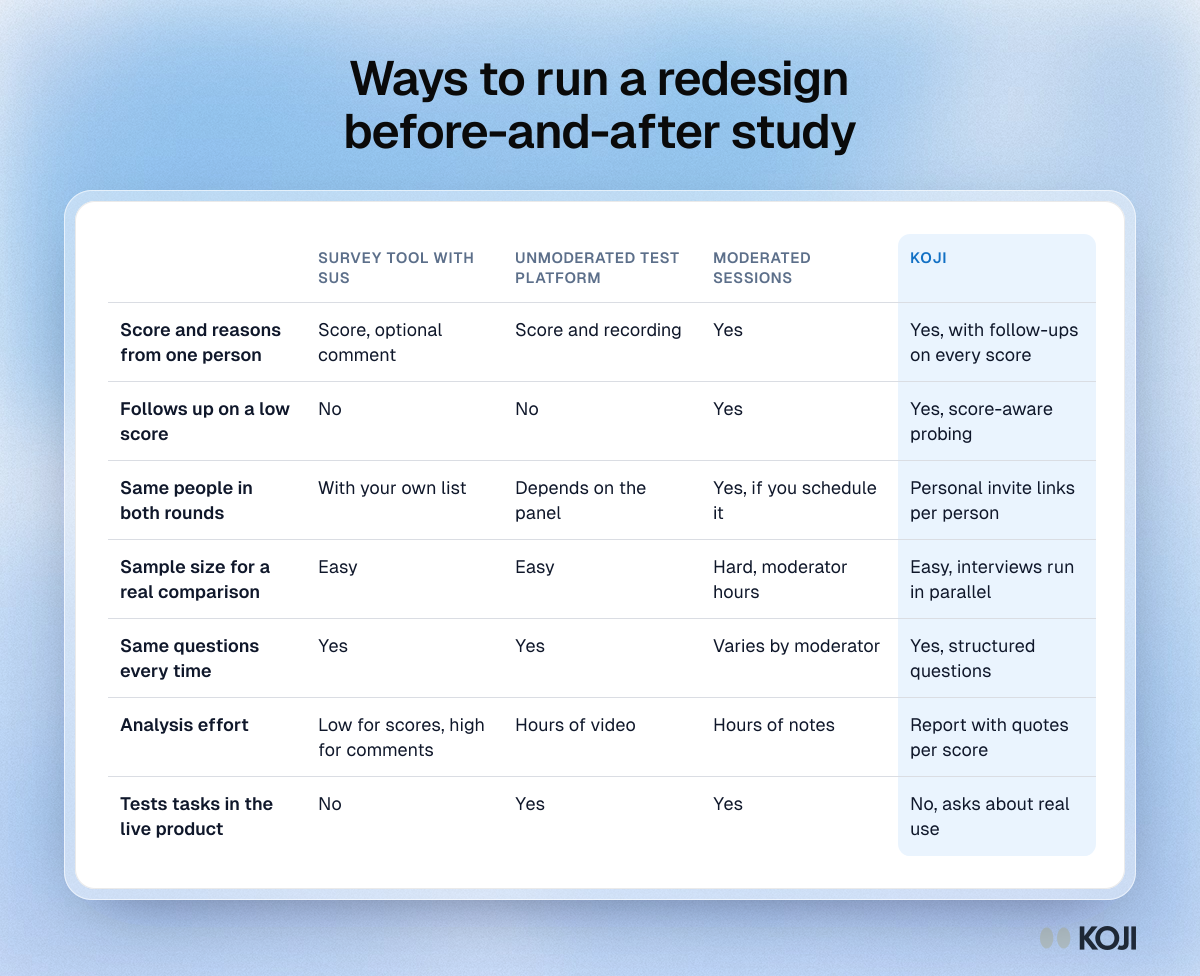
Why we'd run it in Koji:
- The score and the reason arrive together. Scale questions sit inside the conversation, and score-aware probing asks a 2 something different from a 7.
- Round 2 is a copy. Duplicating a study keeps the brief, intake and study settings, so you don't introduce wording drift.
- You can match people. Personal invite links tie each interview to a person, which is what makes the 11-versus-38 maths work in your favour.
- Low-effort interviews are filtered out. Interviews scoring under 3 on quality don't reach the report or use credits.
- The readout is built. Means, medians, distributions and the quotes behind each bucket, downloadable as slides.
Questions you might have about AI interviews
Will people answer a usability scale honestly to an AI? They answer the same scale they would in a form, and then explain it. The difference is the follow-up: a form gets "fine" as a comment, an interviewer asks what "fine" meant last Tuesday. Try it yourself in a free preview before you invite anyone.
Can an AI probe like I would? On a tightly scoped guide like this one, the follow-ups are short and specific: you set the depth per question, from none to three, and can write your own probing guidance. For open exploratory work, test it first; the pilot playbook shows how.
Where does participant data go? You can turn on a per-study setting that removes names, email addresses, phone numbers, postal addresses and employers from transcripts. Interviews tied to personal invite links skip the Anonymous badge, so say in your invitation that answers are linked to them for the comparison.
When Koji may not be the right fit
If the redesign changes a task you need to watch people do (a checkout flow, a form, a navigation tree), you need task-based usability testing with completion rates and recordings, and Koji doesn't record screens or time tasks. Run that in an unmoderated test platform, and use Koji alongside it for the scores and reasons from your wider user base. And if fewer than 15 people use the redesigned area, talk to them directly.
Metrics to track
- Change in mean UMUX-Lite per person, round 1 to round 2
- Change in task ease (1 to 7) per person
- Share of people whose score fell by 2 or more points on either item
- Round 2 completion rate among round 1 participants
- Number of "fell" reasons fixed within one sprint
- Support tickets about the area in the 8 weeks after launch, from your help desk
Frequently asked questions
How long after a redesign should I measure? Four to eight weeks after launch. Earlier and you measure change aversion; later and people no longer remember the old version well enough to compare.
Should I use SUS or UMUX-Lite? In an interview, UMUX-Lite. It's two items instead of ten, and across 16 published comparisons it differed from SUS by 0.4 points on average. Use SUS if you already have a SUS history for the product.
How many people do I need? About 11 measured twice can detect a 15-point change; two separate groups need about 19 each. Recruit 30 for round 1 so 20 finish round 2, since the formulas underestimate below 20.
Can I compare a prototype score with the live product? With care. A January 2026 study in Sensors found SUS on a Figma prototype gave a reliable early read of the live system's perceived usability, but in a 10-person test, and live products surface issues prototypes don't (Lorincz, Barišić and Vlahović, 2026). Treat it as a forecast, not the baseline.
What if scores drop? Read the reasons from the people whose scores fell before anyone reacts to the average. If the drop sits mostly with daily users, ask whether a shortcut or habit was lost, since that is often quick to fix.
Start your baseline this week
Sign up free, open the template gallery, start from Evaluative Post-Test Interviews and add the two UMUX-Lite items, or paste the brief from step 1. Run round 1 before the redesign ships. For more on how researchers use Koji, see Koji for researchers, and for the measurement itself, the SUS guide, usability benchmarking and user research for a redesign.