Column chart
How much control people need before they use an imperfect model
Letting people adjust a forecast by just 2 percentiles bought nearly all of the gain
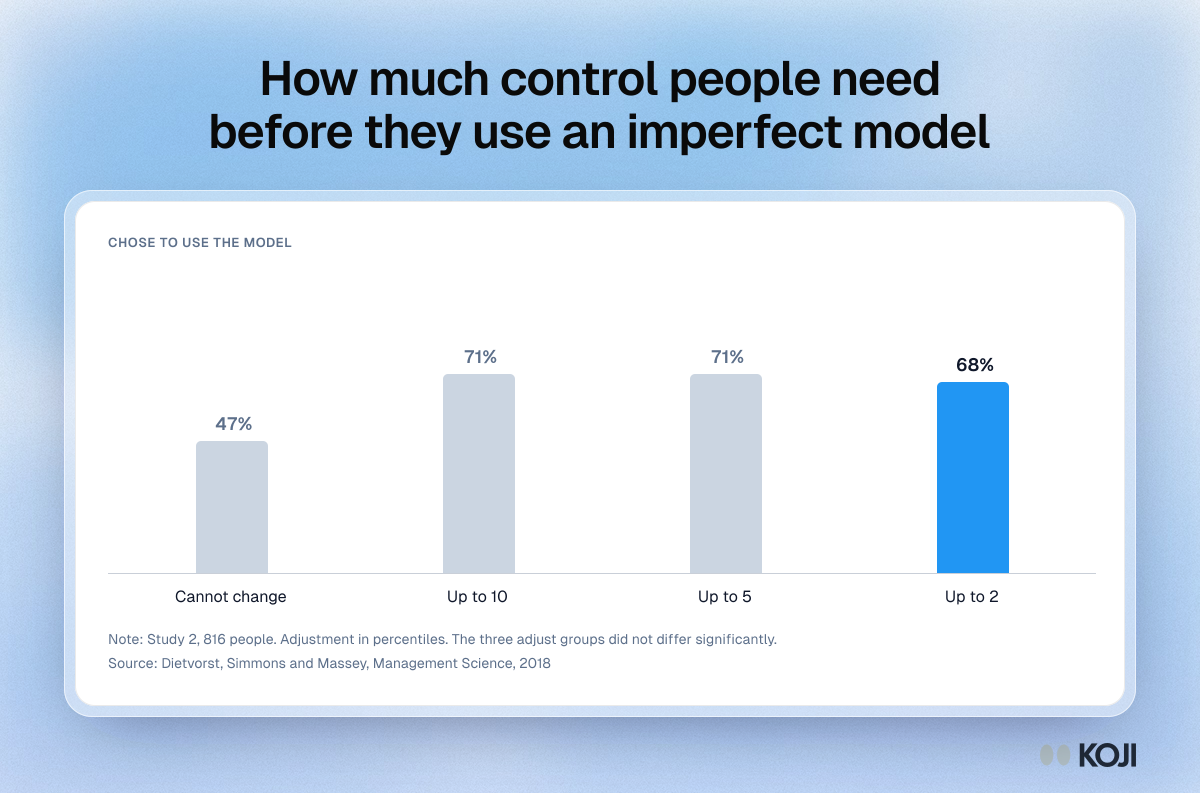
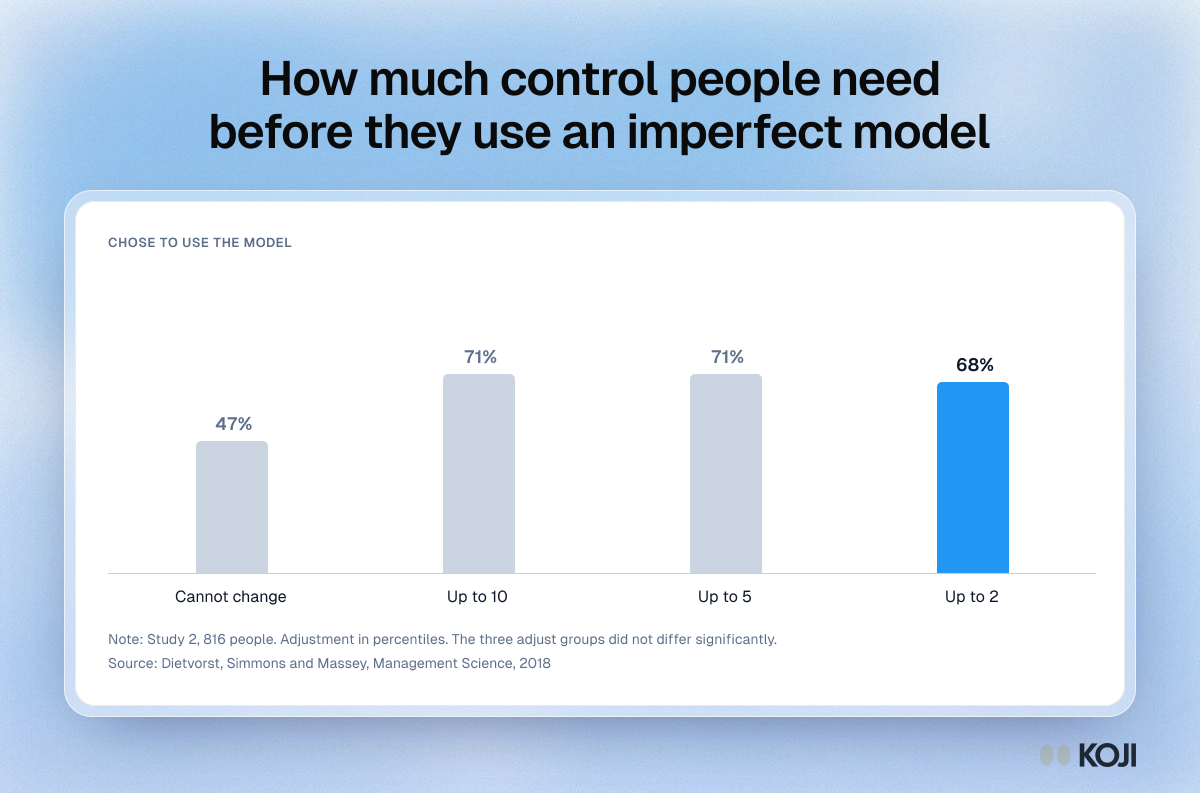
A column chart from Dietvorst, Simmons and Massey's 2018 study on overcoming algorithm aversion. People forecasting students' test scores chose between an imperfect model and their own forecasts. When they could not change the model's output, 47% used it. When they could adjust it by up to 10, 5 or 2 percentiles, 71%, 71% and 68% did. For AI products, a small, bounded edit buys most of the adoption. Koji interviews can show how users feel about editing an AI answer.
Where this appears
What's in this column chart
| Chose to use the model | |
|---|---|
| Cannot change | 47% |
| Up to 10 | 71% |
| Up to 5 | 71% |
| Up to 2 | 68% |
Study 2, 816 people. Adjustment in percentiles. The three adjust groups did not differ significantly.
Use this image
Free to use in your docs, decks and posts under CC BY 4.0, as long as you credit Koji with a link to this page. To embed it, paste this into your page:
<a href="https://www.koji.so/visuals/algorithm-aversion-bounded-adjustment-model-use"><img src="https://www.koji.so/visuals/algorithm-aversion-bounded-adjustment-model-use/algorithm-aversion-bounded-adjustment-model-use.png" alt="Column chart: 47% used an imperfect model when they could not change it, against 71%, 71% and 68% when they could adjust it by up to 10, 5 or 2." width="1200" height="793" /></a>
<p>Source: <a href="https://www.koji.so/visuals/algorithm-aversion-bounded-adjustment-model-use">How much control people need before they use an imperfect model</a>, Koji</p>
Related
Four ways to measure trust after an AI failure
Manager engagement worldwide, 2022 to 2025
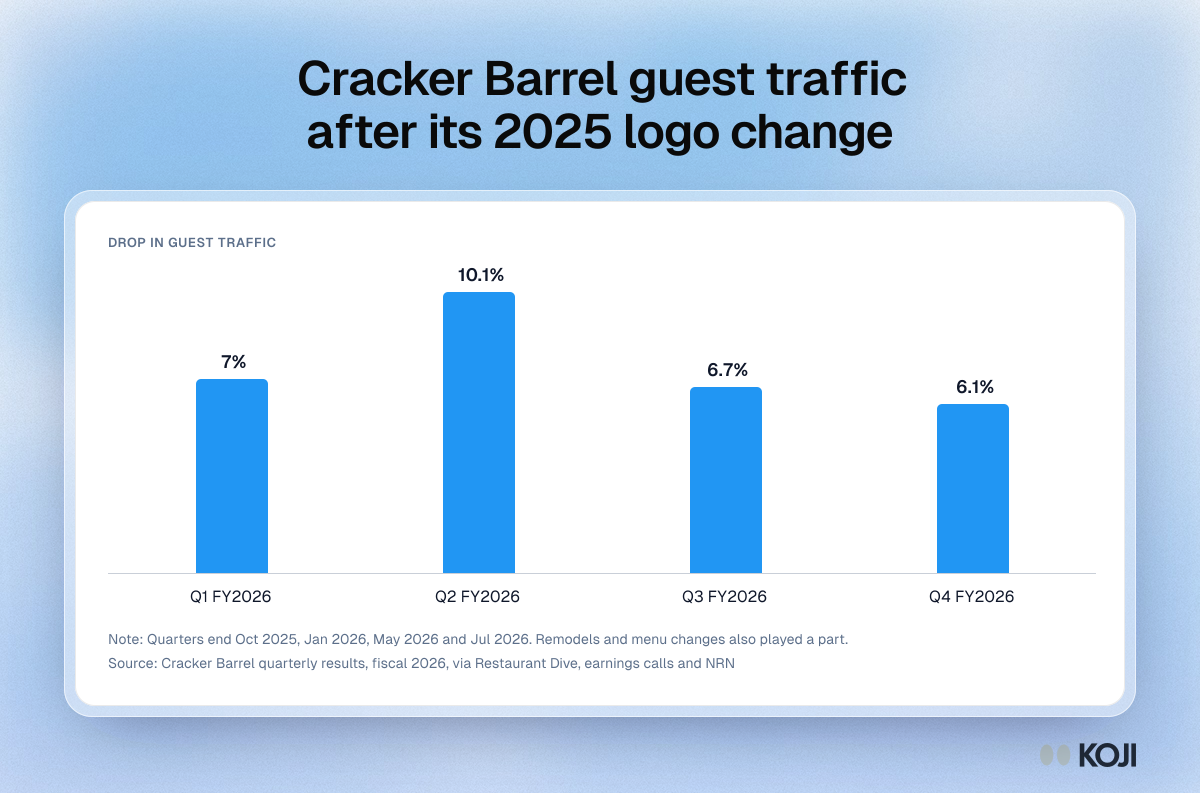
Cracker Barrel guest traffic after its 2025 logo change
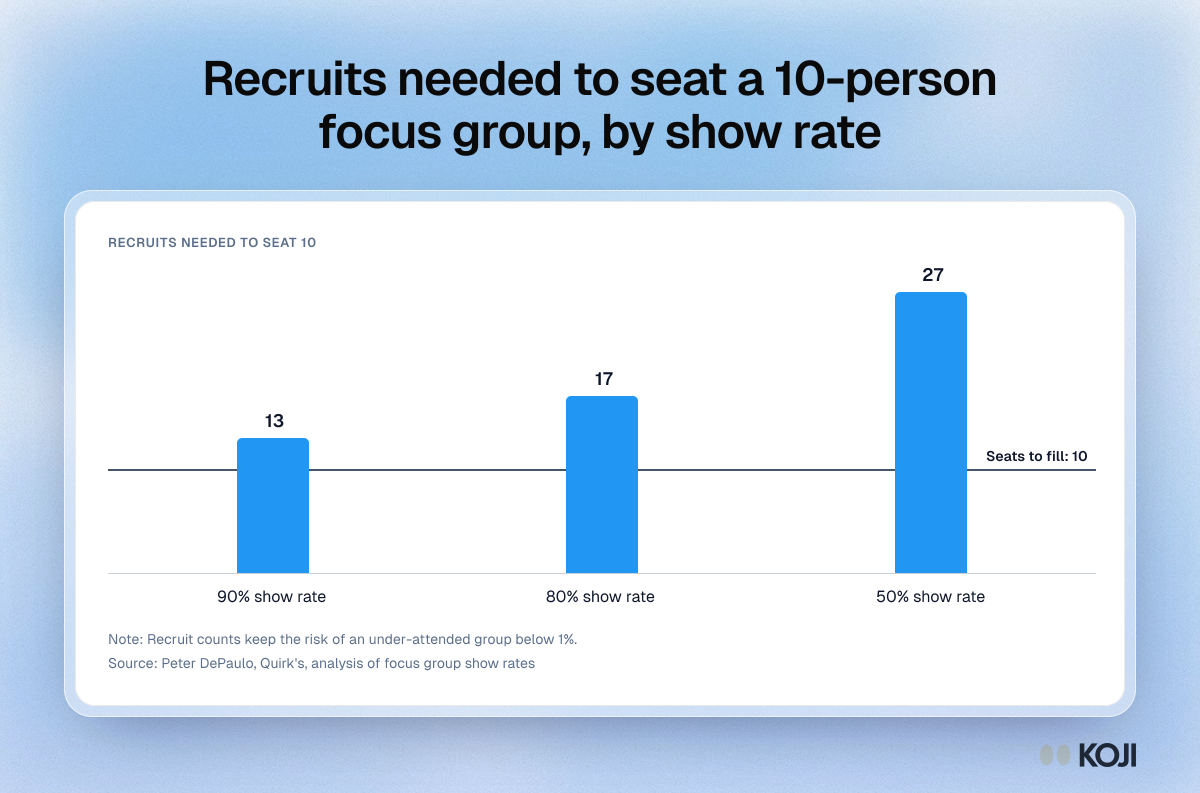
Recruits needed to seat a 10-person focus group, by show rate
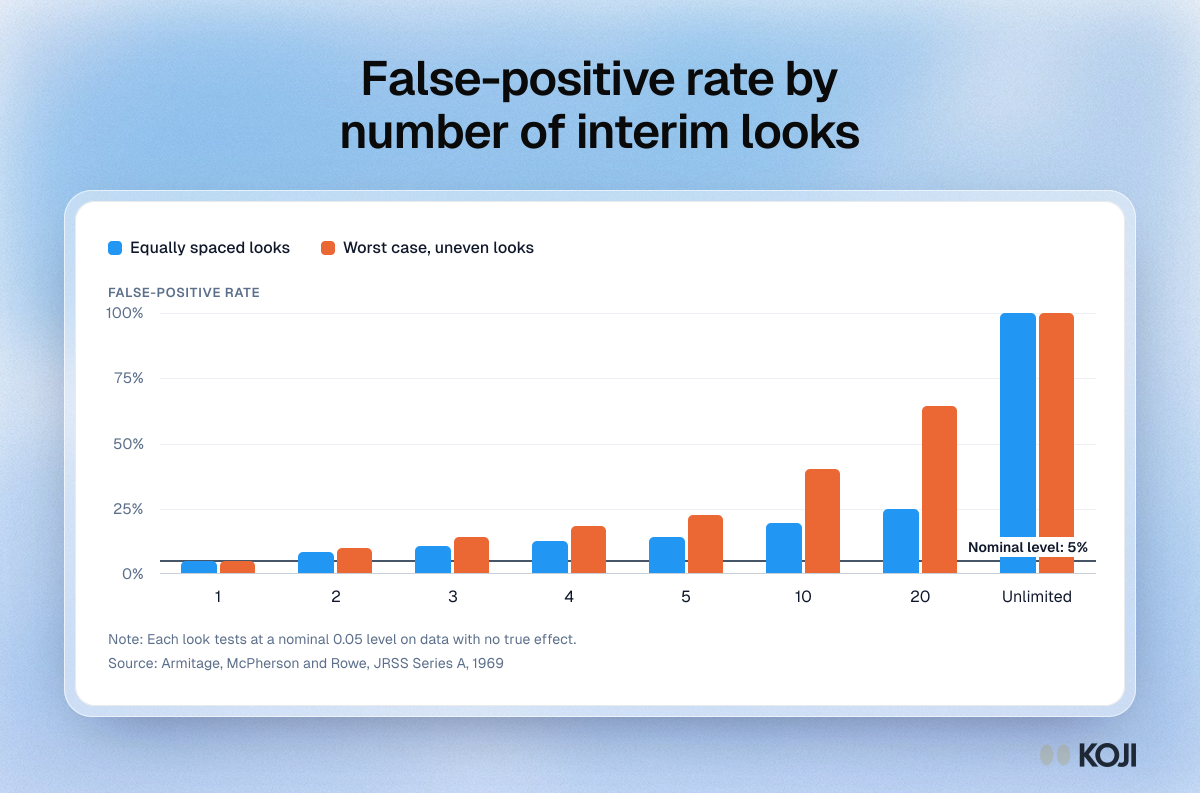
False-positive rate by number of interim looks
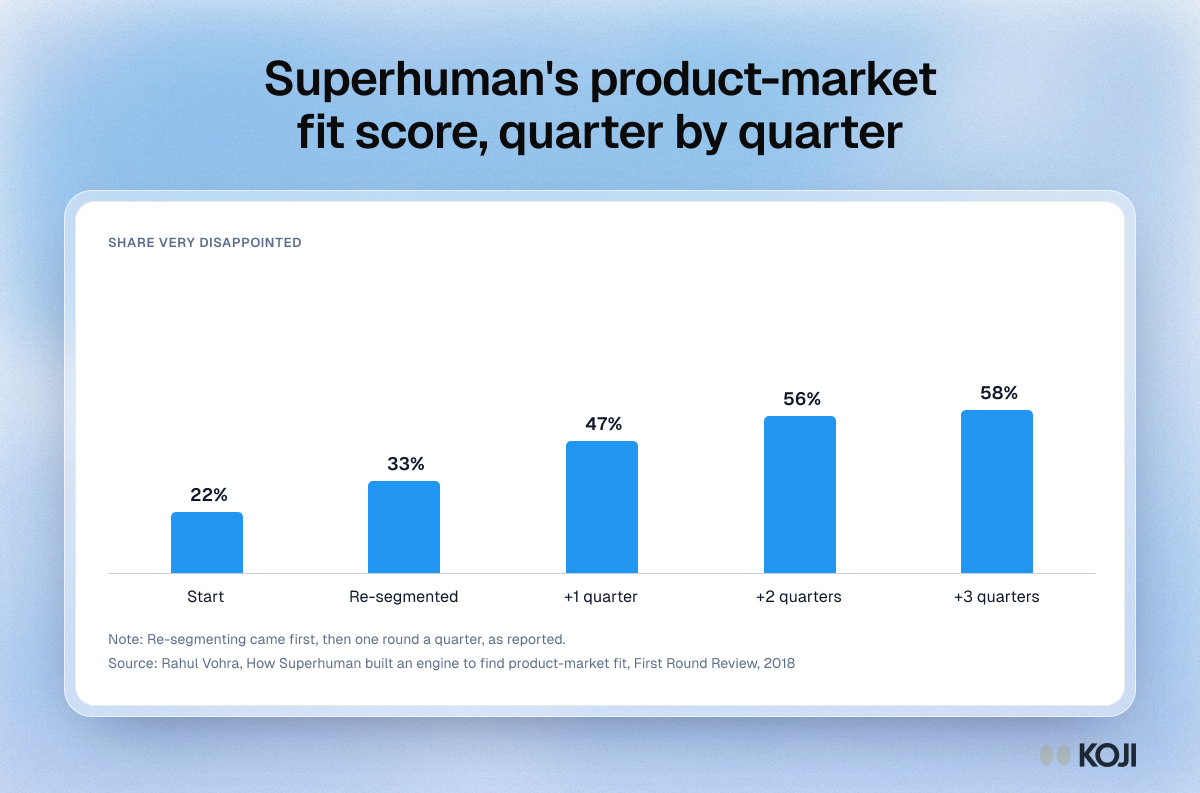
Superhuman's product-market fit score, quarter by quarter