Flowchart
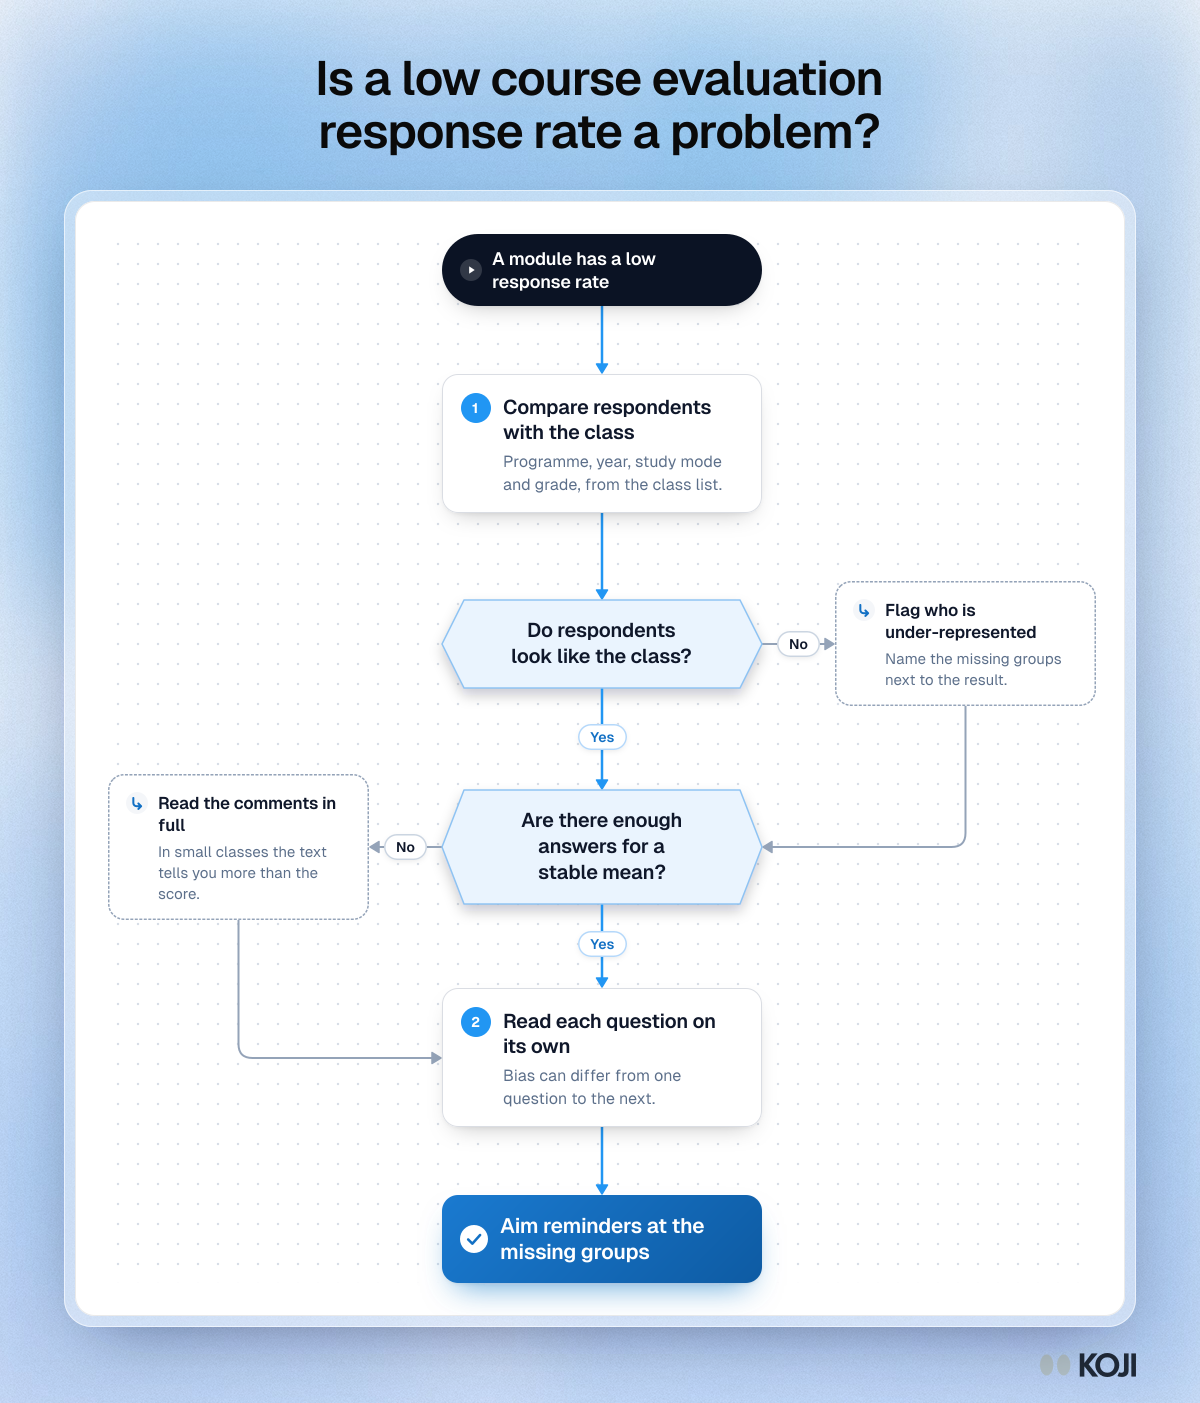
Is a low course evaluation response rate a problem?
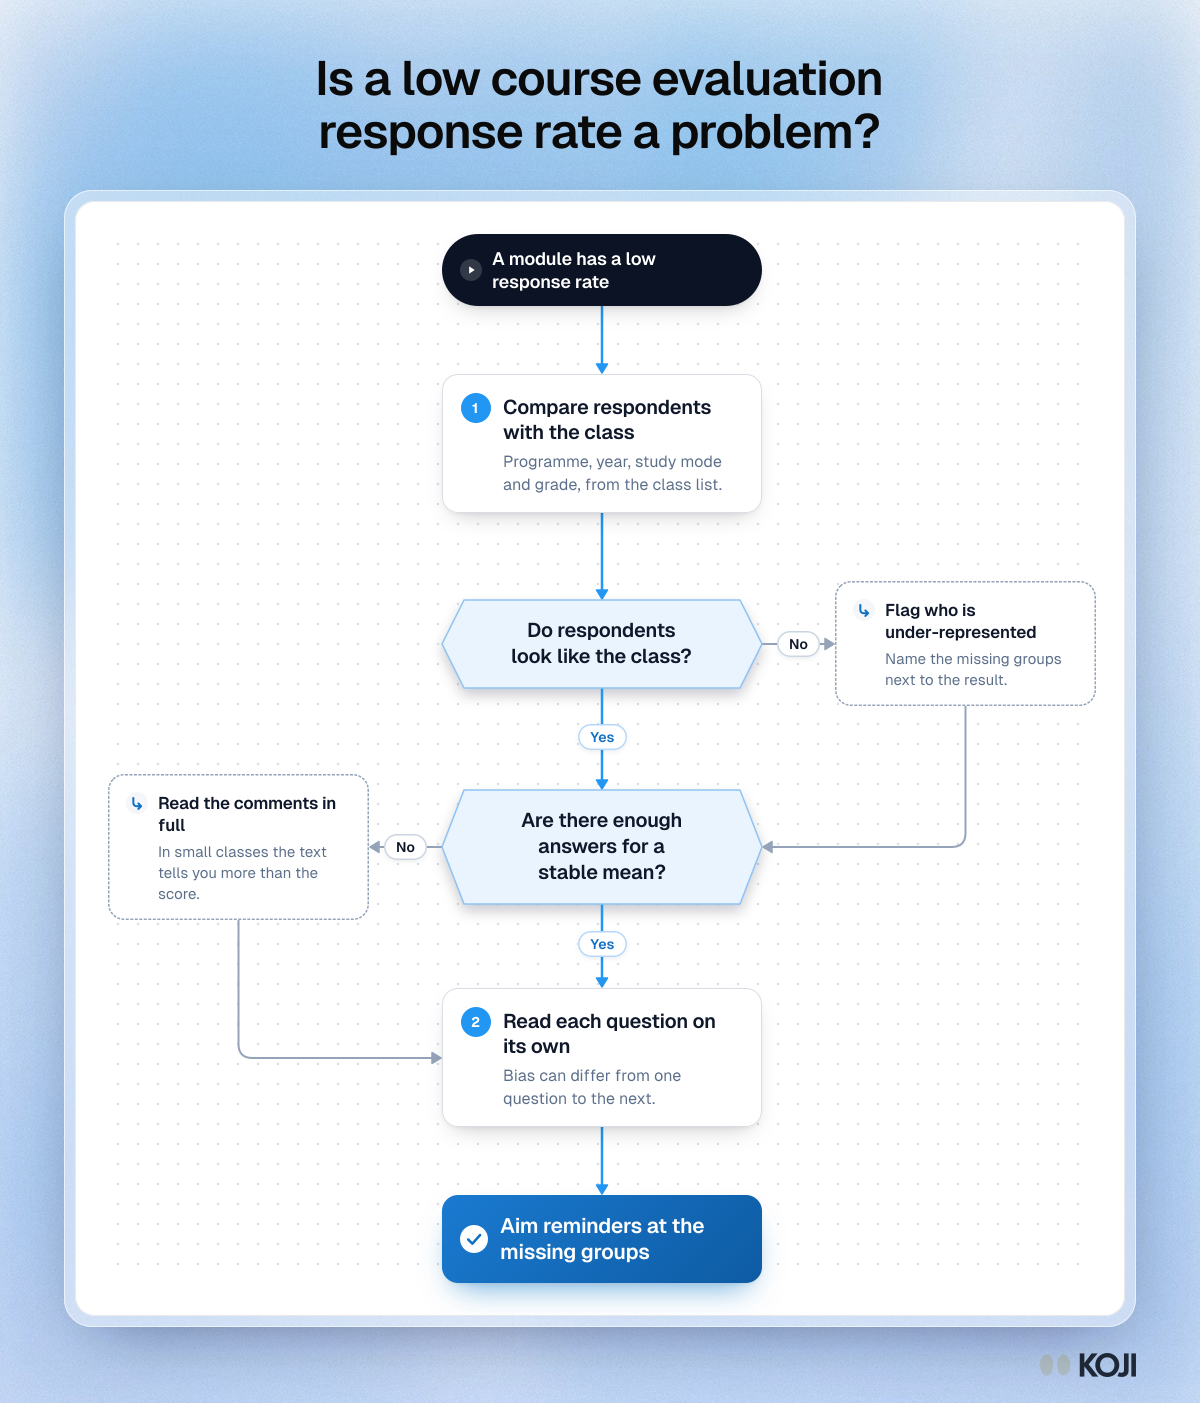
A decision flow for quality teams reviewing a module with a low course evaluation response rate. It starts by comparing respondents with the class list, then checks whether they match and whether there are enough answers for a stable mean, and ends with reminders aimed at the groups that are missing. It follows the finding of Groves and Peytcheva (2008) that response rate alone is a poor guide to nonresponse bias. Koji's personal invite links keep your class list columns and response status, which makes the first comparison quick.
What's in this flowchart
Start: A module has a low response rate
- Compare respondents with the class. Programme, year, study mode and grade, from the class list.
- Do respondents look like the class?
- Yes: go to 3.
- No: Flag who is under-represented. Name the missing groups next to the result. Then go to 3.
- Are there enough answers for a stable mean?
- Yes: go to 4.
- No: Read the comments in full. In small classes the text tells you more than the score. Then go to 4.
- Read each question on its own. Bias can differ from one question to the next.
- Finish: Aim reminders at the missing groups.
Use this image
Free to use in your docs, decks and posts under CC BY 4.0, as long as you credit Koji with a link to this page. To embed it, paste this into your page:
html
<a href="https://www.koji.so/visuals/is-a-low-course-evaluation-response-rate-a-problem-flowchart"><img src="https://www.koji.so/visuals/is-a-low-course-evaluation-response-rate-a-problem-flowchart/is-a-low-course-evaluation-response-rate-a-problem-flowchart.png" alt="Flowchart for reading a low course evaluation response rate: compare respondents with the class, check the match and the number of answers, with two side steps." width="1200" height="1403" /></a>
<p>Source: <a href="https://www.koji.so/visuals/is-a-low-course-evaluation-response-rate-a-problem-flowchart">Is a low course evaluation response rate a problem?</a>, Koji</p>