Bar chart
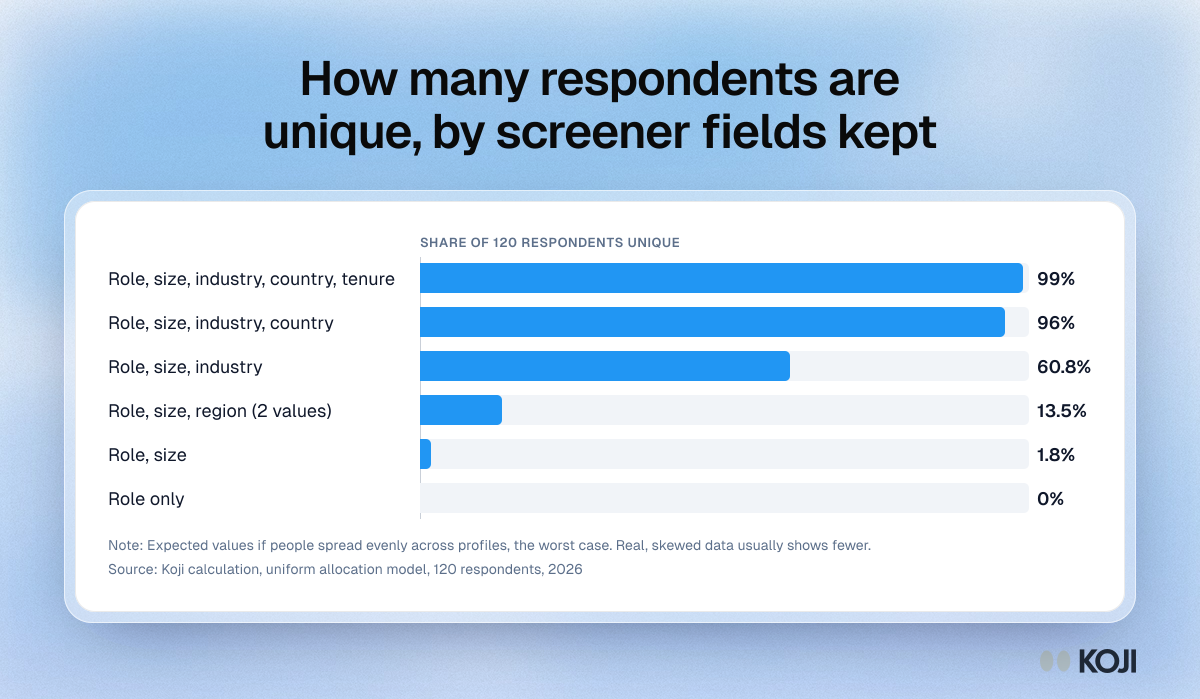
How many respondents are unique, by screener fields kept
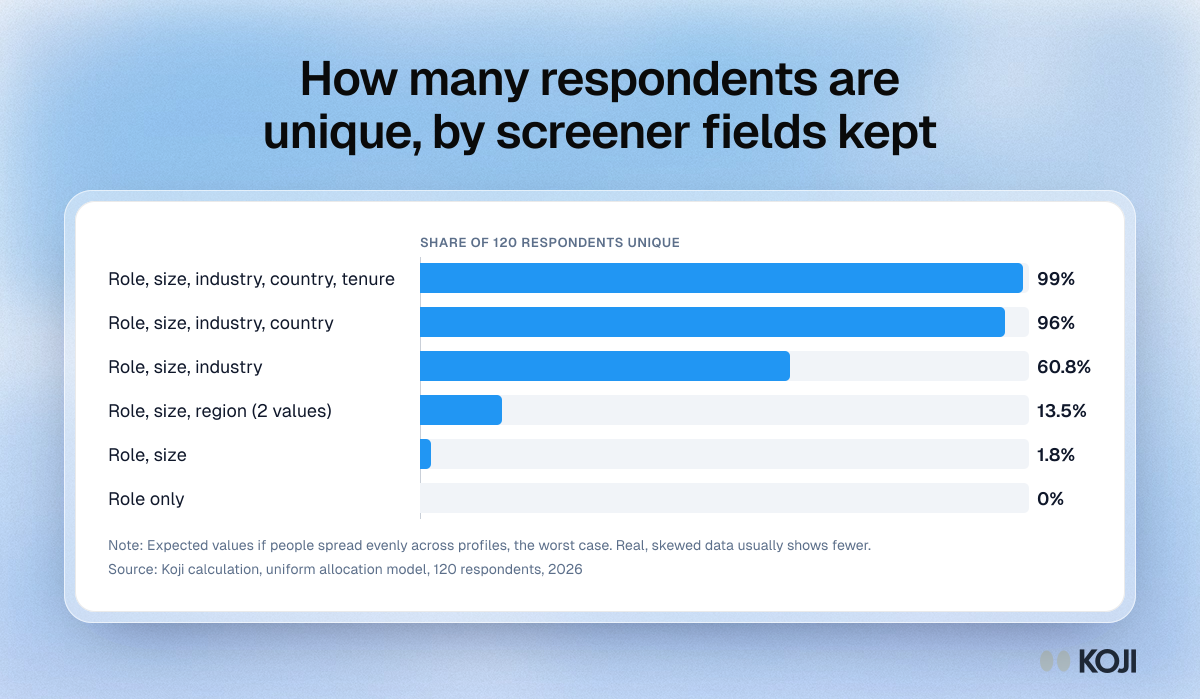
A worked model of how screener fields make research respondents identifiable. In a 120-person study that keeps role, company size, industry, country and tenure, about 99% of people sit alone in their profile. Keep only role and company size and under 2% do. The figures assume people spread evenly across profiles, which is the worst case, so treat them as a reason to count the groups of one in your own data before you publish.
Where this appears
What's in this bar chart
| Respondents who are unique | |
|---|---|
| Role, size, industry, country, tenure | 99% |
| Role, size, industry, country | 96% |
| Role, size, industry | 60.8% |
| Role, size, region (2 values) | 13.5% |
| Role, size | 1.8% |
| Role only | 0% |
Expected values if people spread evenly across profiles, the worst case. Real, skewed data usually shows fewer.
Use this image
Free to use in your docs, decks and posts under CC BY 4.0, as long as you credit Koji with a link to this page. To embed it, paste this into your page:
html
<a href="https://www.koji.so/visuals/screener-fields-vs-unique-respondents-chart"><img src="https://www.koji.so/visuals/screener-fields-vs-unique-respondents-chart/screener-fields-vs-unique-respondents-chart.png" alt="Bar chart of expected unique respondents in a 120-person study: 99% with five screener fields kept, 61% with three, 2% with role and size only." width="1200" height="699" /></a>
<p>Source: <a href="https://www.koji.so/visuals/screener-fields-vs-unique-respondents-chart">How many respondents are unique, by screener fields kept</a>, Koji</p>