Reference table
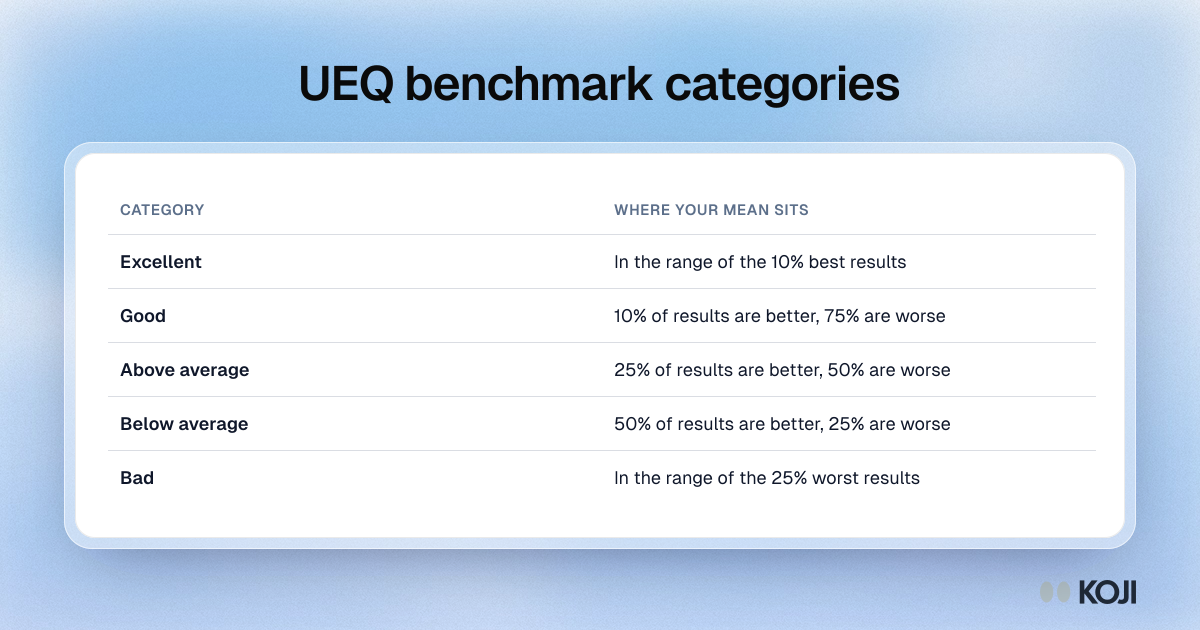
UEQ benchmark categories
How a UEQ scale mean compares with hundreds of product evaluations
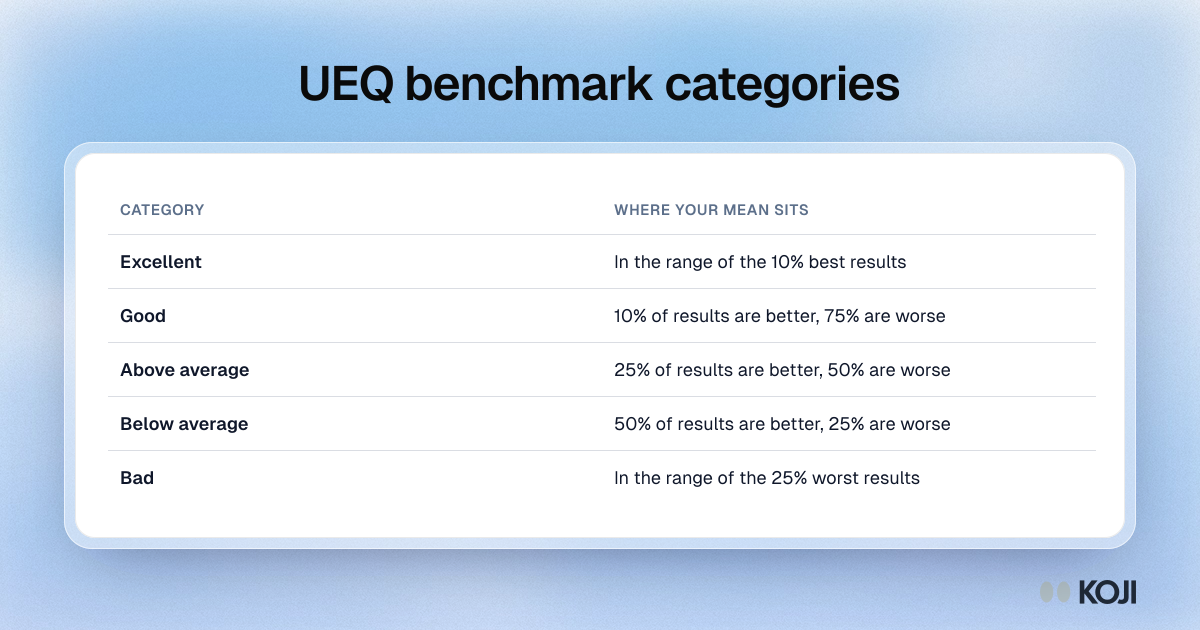
The five categories of the User Experience Questionnaire benchmark, applied to each scale mean: excellent, good, above average, below average and bad, with the share of benchmark results above and below each band. It helps product teams read a first UEQ result when they have no earlier score to compare with. Koji exports UEQ answers from interviews so they can be scored and compared with the benchmark.
Where this appears
What's in this reference table
| Category | Where your mean sits |
|---|---|
| Excellent | In the range of the 10% best results |
| Good | 10% of results are better, 75% are worse |
| Above average | 25% of results are better, 50% are worse |
| Below average | 50% of results are better, 25% are worse |
| Bad | In the range of the 25% worst results |
Use this image
Free to use in your docs, decks and posts under CC BY 4.0, as long as you credit Koji with a link to this page. To embed it, paste this into your page:
html
<a href="https://www.koji.so/visuals/ueq-benchmark-categories"><img src="https://www.koji.so/visuals/ueq-benchmark-categories/ueq-benchmark-categories.png" alt="Table of the five UEQ benchmark categories, from excellent for the top 10% of results to bad for the bottom 25%." width="1200" height="630" /></a>
<p>Source: <a href="https://www.koji.so/visuals/ueq-benchmark-categories">UEQ benchmark categories</a>, Koji</p>