User Experience Questionnaire (UEQ): Scales, Scoring, Benchmark and the 8-Item UEQ-S
How the User Experience Questionnaire works: its six scales, how to score answers from -3 to +3, how to read the benchmark bands, and when the 8-item UEQ-S is enough.
The User Experience Questionnaire (UEQ) is a 26-item survey that measures how people experience a product across six scales: attractiveness, perspicuity, efficiency, dependability, stimulation and novelty. Each item is a pair of opposite words, such as "annoying" and "enjoyable", rated on a 7-point scale that is scored from -3 to +3. Scale means above +0.8 count as a positive result and means below -0.8 as a negative one, and a public benchmark tells you whether a score is excellent, good, above average, below average or bad compared with hundreds of other products. If you only have room for a few questions, the 8-item UEQ-S gives you a pragmatic score, a hedonic score and an overall score.
Use the UEQ when you want more than a usability number. The System Usability Scale tells you whether a product is easy to use. The UEQ also tells you whether people find it exciting, original and pleasant, which matters when you are comparing a redesign, a competitor or a new feature.
Try it this week: put the eight UEQ-S items after your next usability task or product interview, convert the answers to -3 to +3, and compare the two scores against the +0.8 line. The sections below show how.
Where the UEQ comes from
Bettina Laugwitz, Theo Held and Martin Schrepp built the UEQ and published the English version in 2008 ("Construction and Evaluation of a User Experience Questionnaire", USAB 2008, Springer LNCS 5298). The German original dates from 2005. The authors started with a pool of 80 bipolar items, had 153 participants rate products with them, and used factor analysis to reduce the pool to 26 items in six scales.
The goal was a questionnaire that is quick to fill in but still covers the whole experience: how easy a product is to use, and also how it feels. Martin Schrepp maintains the official handbook and analysis tools.
The six UEQ scales
The six scales fall into three groups. Attractiveness is the overall impression. Three scales describe pragmatic quality, the goal-directed side of the experience. Two describe hedonic quality, the side that has nothing to do with getting a task done.
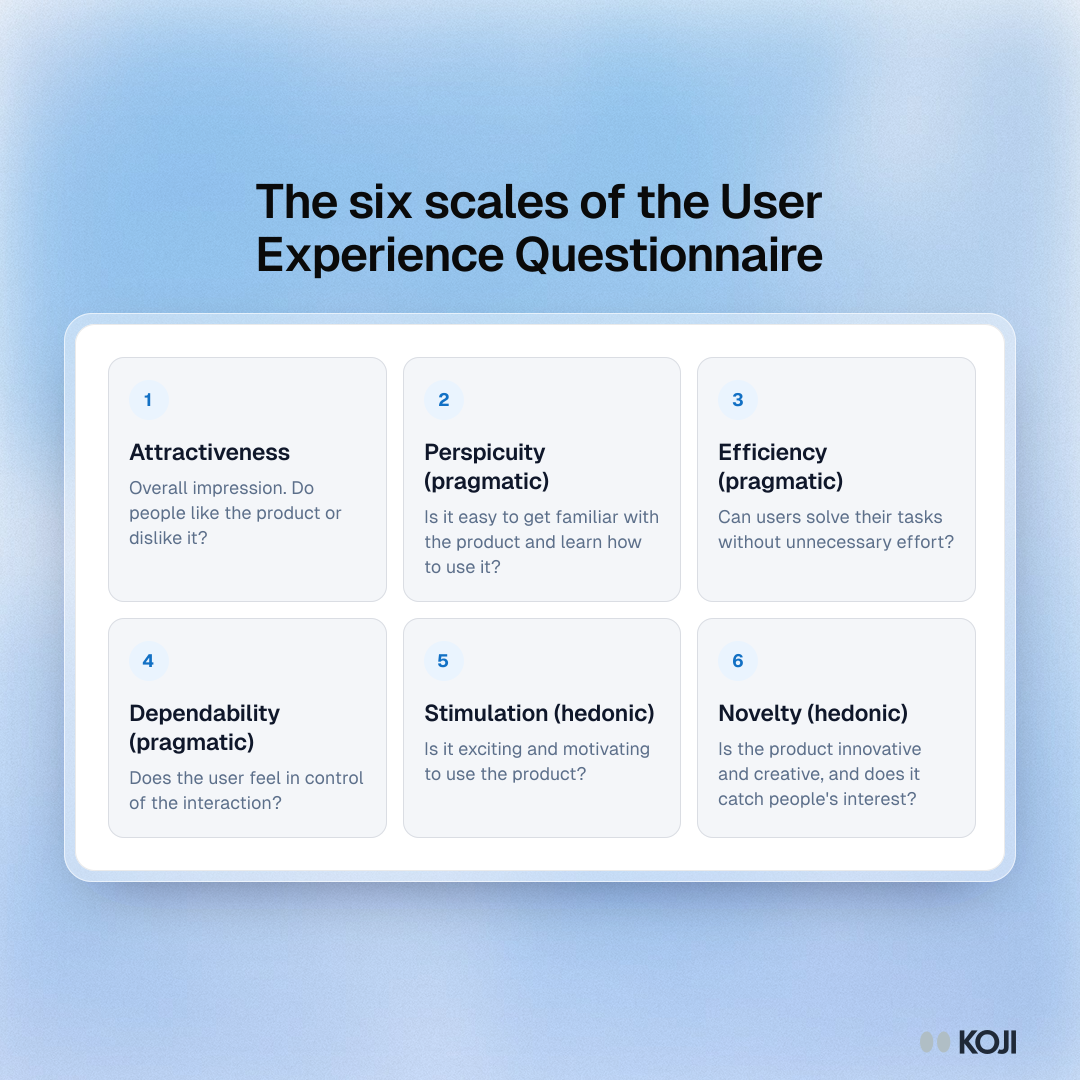
| Scale | Group | The question it answers |
|---|---|---|
| Attractiveness | Overall impression | Do people like the product or dislike it? |
| Perspicuity | Pragmatic | Is it easy to get familiar with the product and learn how to use it? |
| Efficiency | Pragmatic | Can users solve their tasks without unnecessary effort? |
| Dependability | Pragmatic | Does the user feel in control of the interaction? |
| Stimulation | Hedonic | Is it exciting and motivating to use the product? |
| Novelty | Hedonic | Is the product innovative and creative, and does it catch people's interest? |
As the UEQ handbook puts it: "Perspicuity, Efficiency and Dependability are pragmatic quality aspects (goal-directed), while Stimulation and Novelty are hedonic quality aspects (not goal-directed)." (Martin Schrepp, UEQ Handbook)
This split is the reason to choose the UEQ. A product can score well on every pragmatic scale and still feel dull, and a team that only measures usability will never see it.
What the items look like
Every item is a semantic differential: two opposite words with seven circles between them. Attractiveness, for example, uses six pairs: annoying and enjoyable, unlikable and pleasing, good and bad, attractive and unattractive, friendly and unfriendly, unpleasant and pleasant. Perspicuity includes "not understandable" and "understandable", and "easy to learn" and "difficult to learn".
Notice that the positive word is not always on the same side. Half of the items start with the positive term and half with the negative one, in random order. That is deliberate: it stops people from ticking the same column all the way down without reading, a pattern also known as acquiescence bias. Keep the original order and polarity when you run it, and reverse the flipped items when you score.
How to score the UEQ
- Convert every answer to -3 to +3. The most negative answer is -3, the middle is 0 and the most positive is +3, whichever side the positive word was printed on.
- Average the items in each scale for each participant, then average those scale scores across participants.
- Read each scale mean against the ±0.8 lines. The handbook treats values between -0.8 and +0.8 as a more or less neutral evaluation, values above +0.8 as positive and values below -0.8 as negative.
- Compare with the benchmark (next section) to see how good a positive score really is.
- Report all six scales. The UEQ is built as a profile; one blended number hides the pragmatic and hedonic split that makes it useful.
The official site provides an Excel analysis tool for the scoring, so most teams only need to export their answers in the order it expects.
A worked example with the UEQ-S
A participant fills in the eight UEQ-S items for a new onboarding flow. After conversion, the four pragmatic items read +2, +1, +2 and +1, so pragmatic quality is 1.5. The four hedonic items read 0, +1, -1 and 0, so hedonic quality is 0.0. The overall score, the mean of all eight, is 0.75.
Read it this way: the flow is easy and efficient (well above +0.8), but it feels ordinary (neutral on the hedonic side). If the team's goal was "make onboarding feel less like paperwork", the usability work has landed and the hedonic work has not.
The UEQ benchmark
A score of +1.2 sounds good, but good compared with what? The benchmark answers that. Schrepp, Hinderks and Thomaschewski described its construction in 2017 ("Construction of a Benchmark for the User Experience Questionnaire (UEQ)", IJIMAI 4(4)). The handbook reports that it contains the data of 452 product evaluations with a total of 20,190 participants, covering business software, web pages, web shops and social networks, and it is updated about once a year.
For each scale, the benchmark puts your mean into one of five bands:
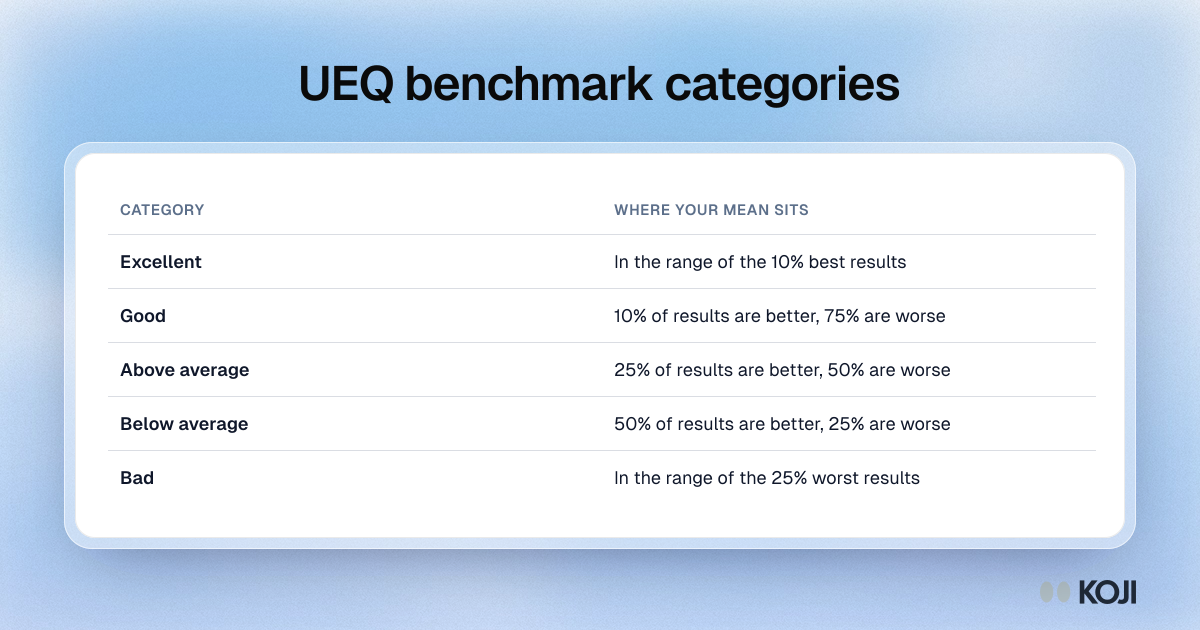
| Category | What it means |
|---|---|
| Excellent | In the range of the 10% best results |
| Good | 10% of the benchmark results are better, 75% are worse |
| Above average | 25% of the results are better, 50% are worse |
| Below average | 50% of the results are better, 25% are worse |
| Bad | In the range of the 25% worst results |
The benchmark matters most the first time you measure a product, when you have no earlier score of your own to compare with. After that, your own trend over releases is usually the more useful comparison.
The 8-item UEQ-S
The short version, published by Schrepp, Hinderks and Thomaschewski in 2017 ("Design and Evaluation of a Short Version of the User Experience Questionnaire (UEQ-S)", IJIMAI 4(6)), keeps eight items from the full UEQ. It drops the six scales and measures only the two meta-dimensions, pragmatic and hedonic quality, with four items each. The mean of all eight items is the overall UX score.
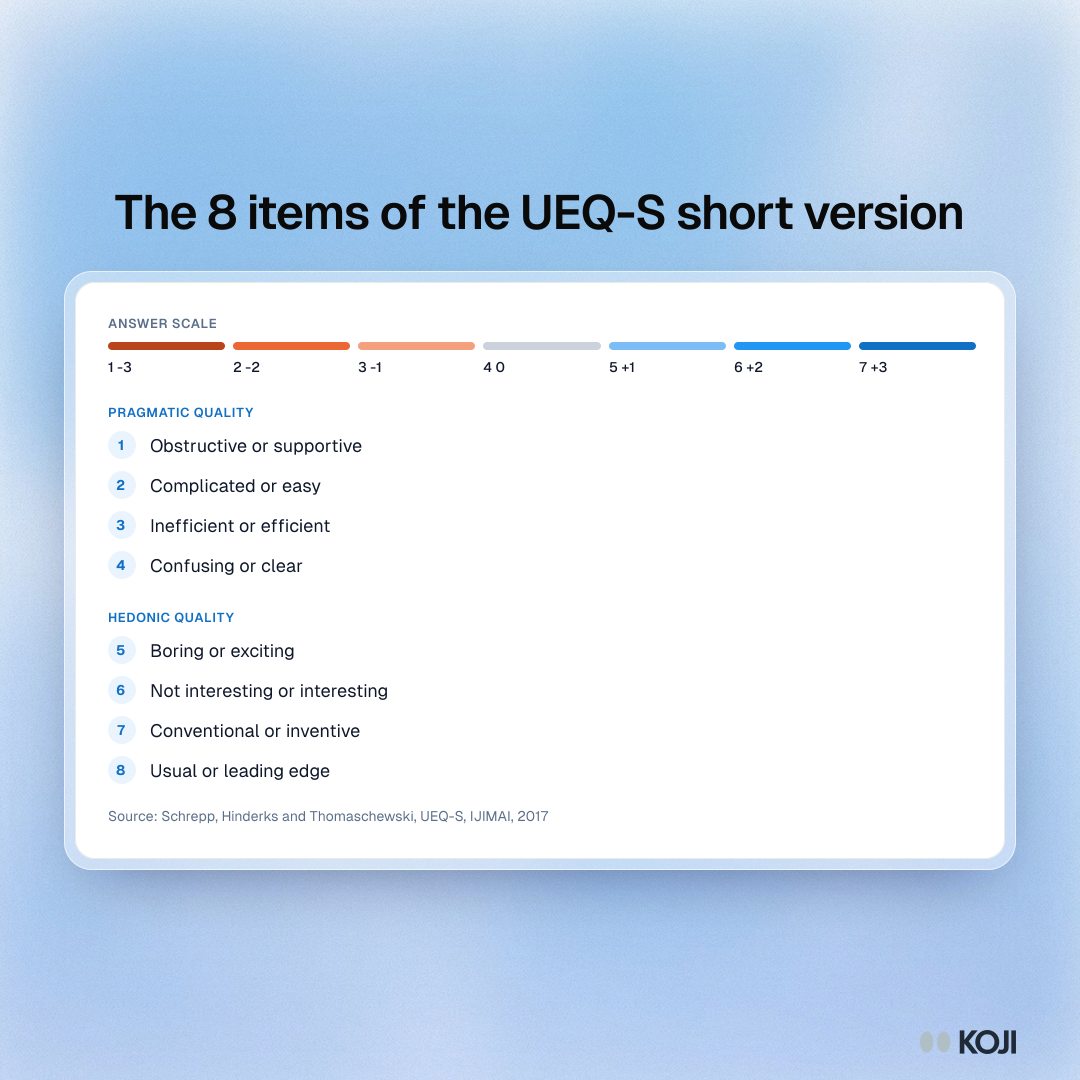
- Pragmatic quality: obstructive or supportive, complicated or easy, inefficient or efficient, confusing or clear
- Hedonic quality: boring or exciting, not interesting or interesting, conventional or inventive, usual or leading edge
The authors are clear about where it fits. In the paper that built a separate benchmark for it, they write that the UEQ-S "is only intended for specific scenarios which do not allow employing a full UEQ" (Hinderks, Schrepp and Thomaschewski, 2018). Use it when every question counts: after each task in a usability test, inside a product, or as part of a longer interview. Use the full UEQ when you need to know which of the six aspects is the problem.
UEQ vs SUS, UMUX-Lite and SEQ
| Measure | Items | What it captures | Best for |
|---|---|---|---|
| UEQ | 26 | Attractiveness plus three pragmatic and two hedonic scales | Comparing products or redesigns on the whole experience |
| UEQ-S | 8 | Pragmatic and hedonic quality, plus an overall score | A quick UX profile inside a longer study |
| System Usability Scale | 10 | Perceived usability of a whole product | Usability benchmarking against a widely used norm |
| UMUX-Lite | 2 | Usefulness and ease of use | Tracking usability with the fewest questions |
| Single Ease Question | 1 | Ease of one task | A rating straight after each task |
They are not rivals. A common pairing is an SEQ after each task and the UEQ-S at the end of the session, so you get task-level ease and a product-level profile from the same people.
Running the UEQ with participants
- Ask right after real use. The UEQ describes an experience, so give people a task or a session with the product first. Ratings of a product someone has only seen in a screenshot measure first impressions, which is a different question.
- Use the official wording and order. The items were chosen and tested as a set. Rewording a pair, dropping items or straightening the polarity changes the measure and breaks the benchmark comparison.
- Keep the language consistent. If you run the study in several countries, use a published translation of the items where one exists rather than translating the pairs yourself.
- Ask why after the ratings, not between them. A follow-up after every word pair turns a short questionnaire into a long interview. One or two open questions at the end, about the lowest scale, give you the reasons.
- Report the sample and the band. Give the number of participants, each scale mean and its benchmark category. Small samples make the means swing, so treat a one-band difference between two small groups with caution.

Photo by Bluestonex on Unsplash
Common mistakes
- Averaging all 26 items into one score. The handbook builds the UEQ as six scales. Report the profile.
- Forgetting to reverse the flipped items. Half of the pairs put the positive word first. Score them the wrong way round and a good product looks neutral.
- Comparing UEQ-S scores with the full UEQ benchmark. The short version has its own benchmark. Use the one that matches the version you ran.
- Treating "neutral" as "fine". A hedonic score between -0.8 and +0.8 means people feel nothing much either way. For a consumer product, that is often the finding.
- Running it without the reasons. The UEQ tells you a product feels conventional. It does not tell you what would make it feel otherwise.
How Koji helps
Koji runs the UEQ or UEQ-S inside an AI-moderated interview, by text or voice, so the scores and the reasons behind them come from the same people in one sitting.
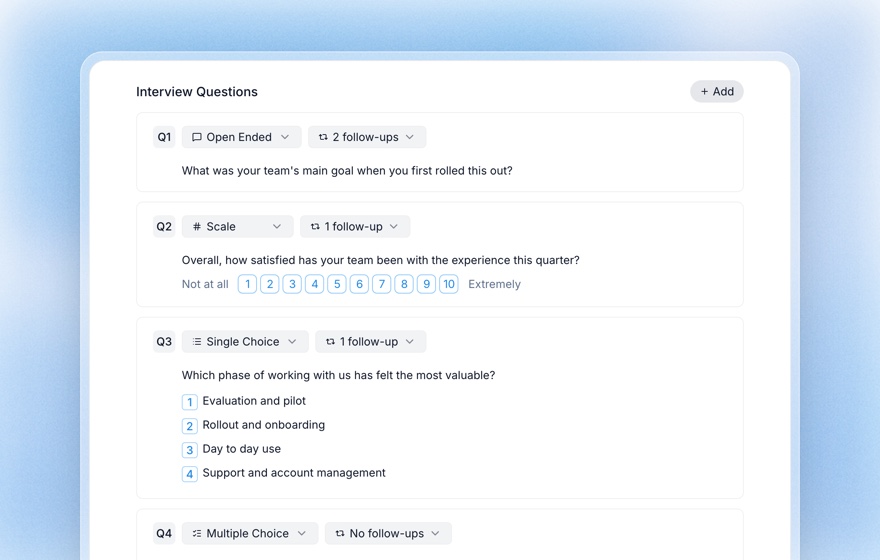
- Each word pair becomes a scale question. Pick the 1 to 7 range in the question editor and set the two end labels to the word pair, for example "Obstructive" and "Supportive". The labels move with the ends of the scale. To keep the original's mixed polarity, put the positive word on the low end for the flipped items and reverse those answers when you score. Subtract 4 from every answer to get the -3 to +3 values.
- Turn the follow-ups off for the items, then add one open question. Each question has a follow-up setting, including "No follow-ups". Set the items to none so the questionnaire stays quick, then add an open question such as "What is one thing that would make it feel less ordinary?" Koji asks it in a conversation and probes the answer.
- Put a task first. A Task question (in Beta) gives each participant a task on your site or prototype and records whether they finished or got stuck and how long it took, so the UEQ-S that follows rates an experience they have just had. See the AI usability testing guide for how tasks work.
- Read and export the results. The report shows the distribution, mean and median of every scale question next to the themes and quotes from the open answers. The responses table exports to CSV with one row per participant and one column per question, ready to paste into a spreadsheet or the official analysis tool. See exporting research data.
If you are a product manager setting up your first UX benchmark, Koji for product managers shows how teams run these studies alongside their discovery interviews.
Related Resources
Related Articles
Semantic Differential Scale: The Complete Guide to Measuring Perception
A complete guide to the semantic differential scale — how Osgood's bipolar-adjective method works, when to use it for brand and concept perception, how it differs from a Likert scale, and how to build and analyze one with examples.
Single Ease Question (SEQ): The 7-Point UX Metric for Task-Level Usability (2026)
The complete 2026 guide to the Single Ease Question (SEQ): the verbatim 7-point scale wording, Sauro–MeasuringU benchmarks (5.3–5.5 average), correlation with task completion, when to use SEQ vs SUS, and how to bundle SEQ into AI-moderated interviews on Koji to get task-level usability scores in days.
Structured Questions in AI Interviews
Mix quantitative data collection — scales, ratings, multiple choice, ranking — with AI-powered conversational follow-up in a single interview.
System Usability Scale (SUS): Complete Guide with Calculator, Benchmarks & Examples
The definitive 2026 guide to the System Usability Scale (SUS): the 10-question formula, scoring calculator, Sauro–Lewis benchmark grades, and how to deploy SUS at scale with AI-moderated interviews on Koji.
UMUX-Lite: The Two-Item Usability Questionnaire (Items, Scoring and Evidence)
How to use UMUX-Lite, the two-item alternative to the System Usability Scale: the exact items, how to score it, what the research says about its reliability and correspondence with SUS, and when to use it.
Usability Benchmarking: How to Run a Benchmark UX Study and Track Metrics Over Time
The complete guide to UX benchmarking — what it is, the metrics to track, how to run a repeatable benchmark usability study, sample sizes, and how AI-moderated research makes continuous benchmarking practical.
COREQ and SRQR: Reporting Checklists for Qualitative Interview Research
All 32 COREQ items and 21 SRQR standards explained, when to use each, and how to turn them into a one-page method note for a research report.