COREQ and SRQR: Reporting Checklists for Qualitative Interview Research
All 32 COREQ items and 21 SRQR standards explained, when to use each, and how to turn them into a one-page method note for a research report.
COREQ and SRQR are the two standard checklists for reporting qualitative research. COREQ (2007) has 32 items for interview and focus group studies; SRQR (2014) has 21 items for any qualitative approach. Use COREQ when your study is built on interviews or focus groups and you want a detailed method section. Use SRQR when the journal asks for it, or when your study uses another approach such as observation or document analysis. Both exist so a reader can judge how a study was done without asking you.
They are not only for academic papers. A research report for a leadership team or a client faces the same question: can someone who was not in the room trust these findings? A reporting checklist is the fastest way to answer it.
Use it today: open your latest research report and check it against the eight research team items and the seven data collection items below. Most reports miss at least half of them.
Why reporting checklists exist
When Allison Tong, Peter Sainsbury and Jonathan Craig published COREQ in the International Journal for Quality in Health Care in 2007, they wrote: "Although partial checklists are available, no consolidated reporting framework exists for any type of qualitative design." They built COREQ to fill that gap for the two most common qualitative methods, interviews and focus groups.
The problem has not gone away. Walsh and colleagues reviewed 197 interview and focus group studies published in nursing social science journals in 2018 against all 32 COREQ items. Only 10 of the 197 (5%) said they had followed COREQ, and only 20 of the 71 journals (28%) endorsed it. The overall quality of reporting was rated moderate in 57% of studies and poor in 38% (Walsh et al., 2020, International Journal of Qualitative Methods).
There is some good news. A meta-review by de Jong and colleagues looked at 1,695 qualitative reviews and found that the primary studies they included reported more COREQ items after the checklist was published: the average score rose from 15.51 to 17.74 out of 32 (BMC Medical Research Methodology, 2021). Still, a typical study reports barely more than half the items.
COREQ: the 32 items
COREQ groups its items into three domains. The table shows each section and what it asks for:
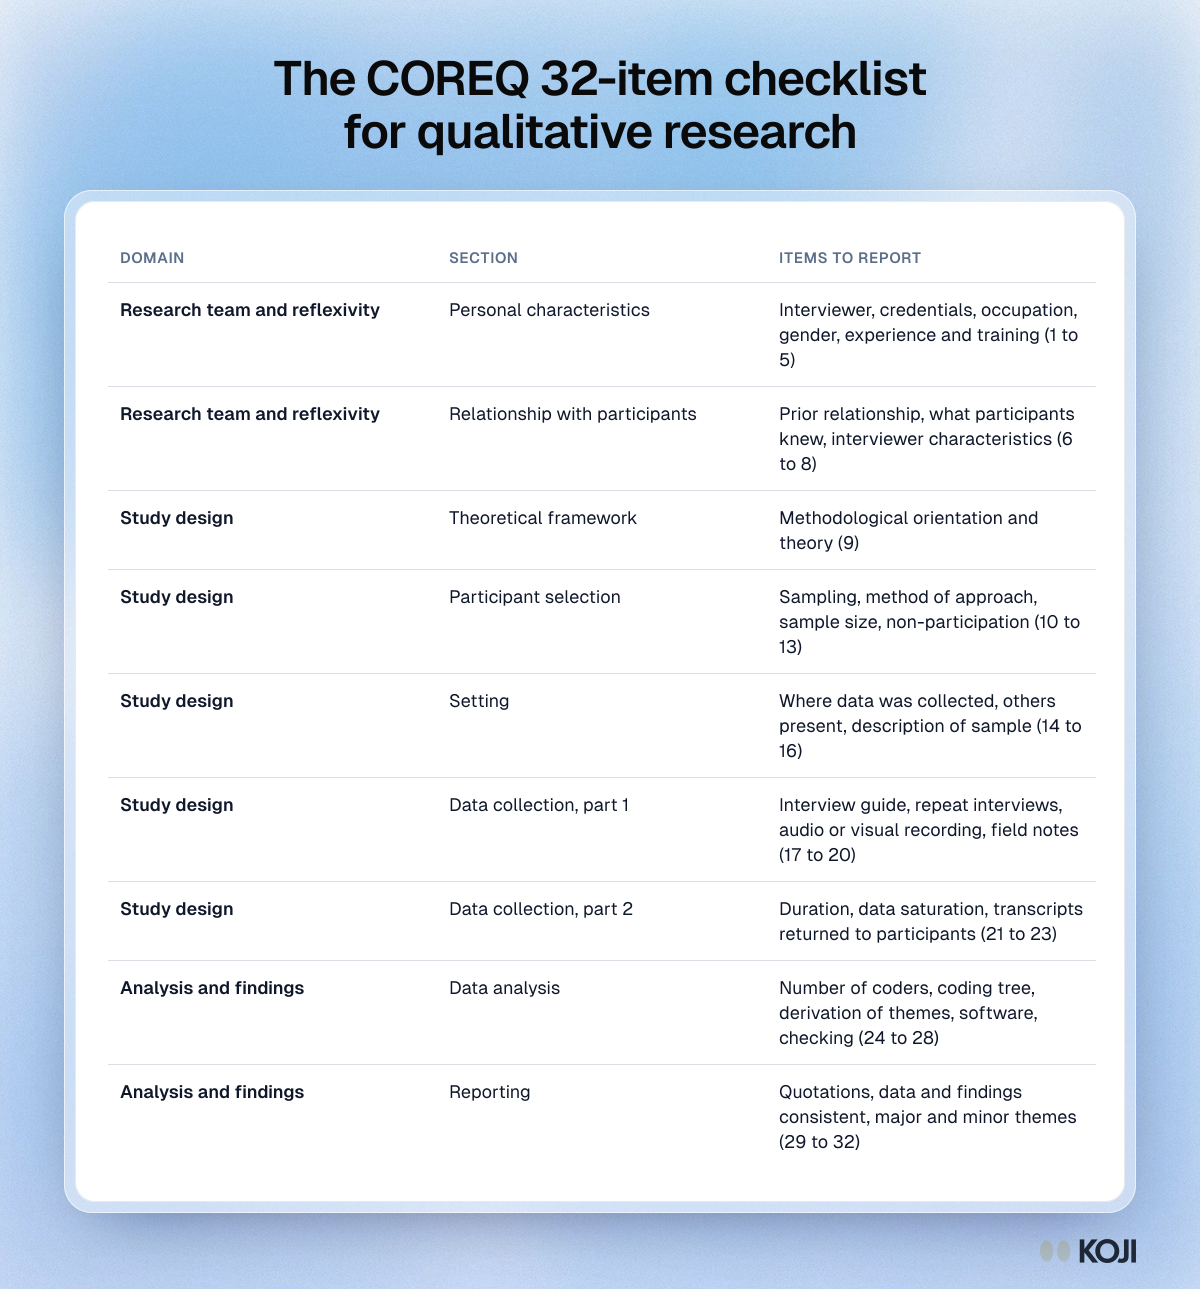
Domain 1: Research team and reflexivity (items 1 to 8)
Personal characteristics
- Interviewer or facilitator: who conducted the interviews or focus groups?
- Credentials: what were their credentials, such as a PhD or MD?
- Occupation: what was their job at the time of the study?
- Gender: was the researcher male or female?
- Experience and training: what experience or training did they have?
Relationship with participants
- Relationship established: was there a relationship before the study began?
- Participant knowledge of the interviewer: what did participants know about the researcher, such as their goals and reasons for the research?
- Interviewer characteristics: what was reported about the interviewer, such as assumptions, reasons and interest in the topic?
This domain is the one most often left out, and it is where a positionality statement belongs. See reflexivity in qualitative research for how to write one.
Domain 2: Study design (items 9 to 23)
Theoretical framework
- Methodological orientation and theory: for example grounded theory, phenomenology or content analysis.
Participant selection
- Sampling: how were participants selected, for example purposively or by convenience?
- Method of approach: face to face, telephone, mail or email?
- Sample size: how many took part?
- Non-participation: how many refused or dropped out, and why?
Setting
- Setting of data collection: where was the data collected?
- Presence of non-participants: was anyone else present?
- Description of sample: what were the important characteristics of the sample?
Data collection
- Interview guide: were questions or prompts provided by the authors, and was the guide pilot tested?
- Repeat interviews: were any carried out, and how many?
- Audio or visual recording: was it used?
- Field notes: were they made during or after the interview?
- Duration: how long were the interviews or focus groups?
- Data saturation: was it discussed?
- Transcripts returned: were transcripts returned to participants for comment or correction?
Domain 3: Analysis and findings (items 24 to 32)
Data analysis
- Number of data coders.
- Description of the coding tree.
- Derivation of themes: were themes identified in advance or derived from the data?
- Software used to manage the data, if any.
- Participant checking: did participants give feedback on the findings?
Reporting
- Quotations presented, each identified, for example by participant number.
- Data and findings consistent: is there consistency between the data presented and the findings?
- Clarity of major themes: are major themes clearly presented?
- Clarity of minor themes: is there a description of diverse cases or discussion of minor themes?
SRQR: the 21 standards
The Standards for Reporting Qualitative Research were published by Bridget O'Brien and colleagues in Academic Medicine in 2014. They synthesised 40 sets of reporting recommendations into 21 items that follow the structure of a paper:
- Title and abstract: 1. Title. 2. Abstract.
- Introduction: 3. Problem formulation. 4. Purpose or research question.
- Methods: 5. Qualitative approach and research paradigm. 6. Researcher characteristics and reflexivity. 7. Context. 8. Sampling strategy. 9. Ethical issues pertaining to human subjects. 10. Data collection methods. 11. Data collection instruments and technologies. 12. Units of study. 13. Data processing. 14. Data analysis. 15. Techniques to enhance trustworthiness.
- Results: 16. Synthesis and interpretation. 17. Links to empirical data.
- Discussion: 18. Integration with prior work, implications, transferability and contribution to the field. 19. Limitations.
- Other: 20. Conflicts of interest. 21. Funding.
COREQ or SRQR: which to use
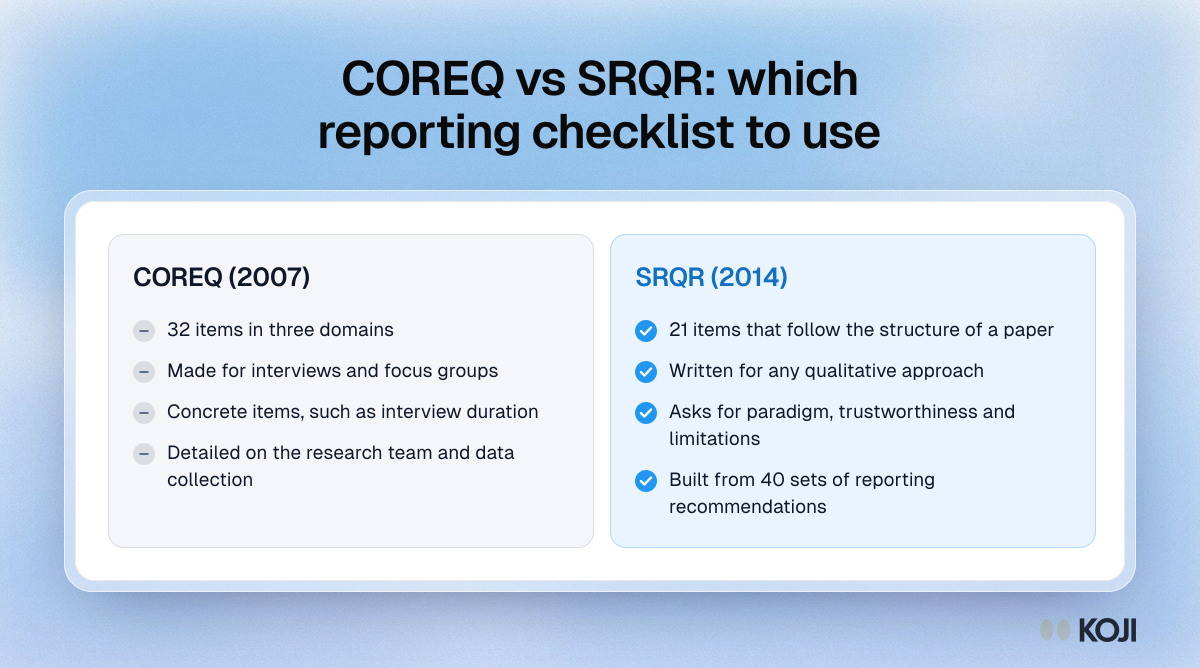
- Interview or focus group study: COREQ. It is the more concrete of the two, asking for things like interview duration and how many people coded the data.
- Other qualitative approaches, or mixed designs: SRQR, which is written for any approach and asks you to name your paradigm and how you made the findings trustworthy.
- The journal or client names one: use that one.
- An internal product research report: COREQ's first two domains make a good method appendix. Domain 3 maps to the way you present findings.
Many researchers use one checklist and borrow from the other. SRQR's items on limitations and conflicts of interest are worth adding to any COREQ-based report.
Using COREQ for a product research report
A product team rarely needs a 32-item appendix, but the questions behind the items are the ones stakeholders ask. A one-page method note answering them covers most of what a reader needs:
- Who ran it and their stake (items 1 to 8): who designed the study, who interviewed, whether participants knew them, and what they expected to find.
- Who took part and how they were found (items 10 to 16): how you recruited, how many you invited and how many completed, and the key characteristics of the sample.
- How you collected the data (items 17 to 23): the interview guide, text or voice, typical length, and whether you stopped when new interviews added little.
- How you analysed it (items 24 to 28): who coded, whether themes came from the data or a framework, what software you used, and how you checked the findings.
- How you present it (items 29 to 32): quotes attributed by participant number, minor themes and exceptions alongside the main ones.
Reporting the research team
This is the part teams skip, and it matters most when the people running the research also own the product. Name who interviewed, what participants were told, and what you did to check your reading, such as a second coder or a comparison with usage data. It takes a paragraph and answers the "you only heard what you wanted to hear" objection before anyone raises it.
Common mistakes
- Treating the checklist as a quality score. COREQ and SRQR are about reporting, not about whether the study was good. A badly designed study can report every item.
- Ticking items without detail. "Data saturation was reached" is a tick; how you judged it is the report (see data saturation).
- Skipping non-participation. Who declined or dropped out tells the reader who is missing from your findings.
- Leaving out minor themes. Item 32 exists because exceptions and diverse cases are often the most useful findings.
- Not naming automated analysis. If software or AI coded your data, say so under items 24 to 27 and describe how you checked it.
How Koji helps
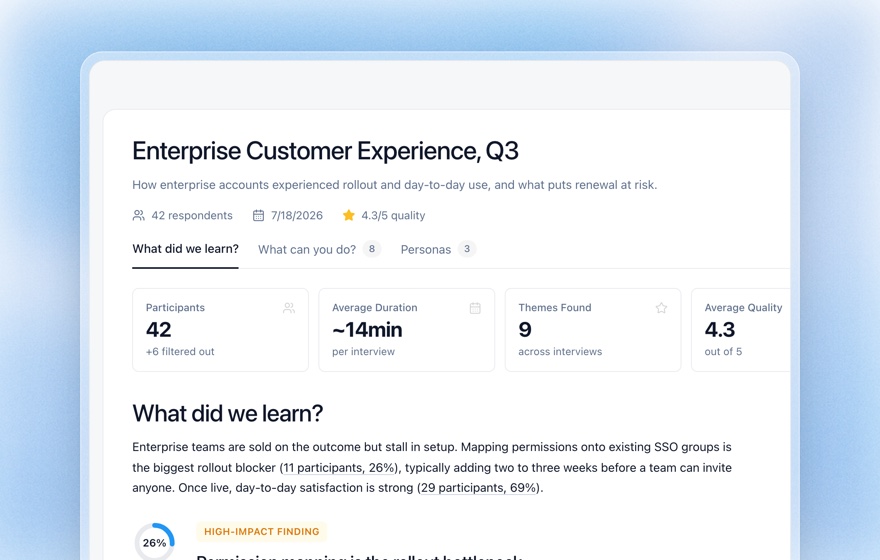
Koji records much of what COREQ asks you to report as a side effect of running the study, so the method note is quicker to write. You still write it.
- Interview guide (item 17). The study brief holds every question and its type. Preview the interview yourself before launch, which is a quick pilot test.
- Mode and duration (items 11, 19, 21). Each interview is marked as text or voice, and the report shows the average interview length.
- Sample and non-participation (items 12, 13, 16). The report header shows how many took part, and the Responses card counts completed interviews next to partial, dropped and screened-out ones. Answers to the intake fields you collect come with the CSV export.
- Saturation (item 22). Report history keeps earlier versions with their interview counts, so you can show how findings changed, or stopped changing, as interviews came in.
- Coding tree and themes (items 24 to 27). Koji codes each answer and groups codes across interviews, with the codes behind each group visible. Name Koji as the software, say that coding was automated, and say how you reviewed it.
- Quotations (items 29, 30). Every finding links to supporting quotes, which open in the transcript, so you can show that data and findings are consistent.
- Full data for a second coder. Export every conversation as CSV or JSON with timestamps, or download the report as an editable slide deck or a PDF.
Related Resources
- Reflexivity in qualitative research
- Qualitative research validity and reliability
- Data saturation in qualitative research
- Presenting research findings
- User research report template
- Structured questions guide
Sources
- de Jong, Y., et al. (2021). A meta-review demonstrates improved reporting quality of qualitative reviews following the publication of COREQ- and ENTREQ-checklists, regardless of modest uptake. BMC Medical Research Methodology, 21.
- O'Brien, B. C., Harris, I. B., Beckman, T. J., Reed, D. A., and Cook, D. A. (2014). Standards for reporting qualitative research: a synthesis of recommendations. Academic Medicine, 89(9), 1245–1251.
- Tong, A., Sainsbury, P., and Craig, J. (2007). Consolidated criteria for reporting qualitative research (COREQ): a 32-item checklist for interviews and focus groups. International Journal for Quality in Health Care, 19(6), 349–357.
- Walsh, S., Jones, M., Bressington, D., et al. (2020). Adherence to COREQ reporting guidelines for qualitative research: a scientometric study in nursing social science. International Journal of Qualitative Methods, 19.
Related Articles
Data Saturation in Qualitative Research: How to Know When You Have Enough
Data saturation is the point at which additional interviews stop producing new information. This guide covers the four types of saturation (theoretical, data, code, meaning), how to recognize and document them, the empirical sample sizes from Hennink and Guest, and how AI-moderated interviews let you reach saturation in days instead of months.
Presenting Research Findings to Stakeholders
Learn how to present qualitative research findings effectively — from storytelling with data and using participant quotes to structuring reports for executives, product teams, and designers.
Qualitative Research Validity and Reliability: How to Build Studies You Can Trust
A practical guide to Lincoln and Guba's trustworthiness framework — credibility, transferability, dependability, and confirmability — and how to build each into your qualitative research studies.
Reflexivity in Qualitative Research: How to Practise It and Write a Positionality Statement
What reflexivity in qualitative research means, the three kinds of reflexive work, how to keep a reflexive journal and how to write a positionality statement, with prompts and an example.
Structured Questions in AI Interviews
Mix quantitative data collection — scales, ratings, multiple choice, ranking — with AI-powered conversational follow-up in a single interview.
User Research Report Template: How to Present Findings That Drive Action
A complete guide to writing user research reports that stakeholders actually read — with a proven structure, templates for key sections, and how AI-generated reports change the game.