You have two ways to sell the same thing and you cannot tell which one customers want. Maybe it is a fixed package against pay per visit, or a weekly box against a one-off. The short answer: put both offers in front of about 20 of your own customers, one picture each, and ask which they would pick and why. By the end of this guide you can run that this week, read a 14-to-6 split without fooling yourself, and decide what to send to your list next.
When you need this
You are choosing between two versions of an offer, and the choice costs you something. A flyer to print, an email to your whole list, a new package on the website, a price card for the counter. Friends say "I like the first one". Your staff split down the middle. The loudest customer on your list wants the third thing.

Photo by Vitaly Gariev on Unsplash
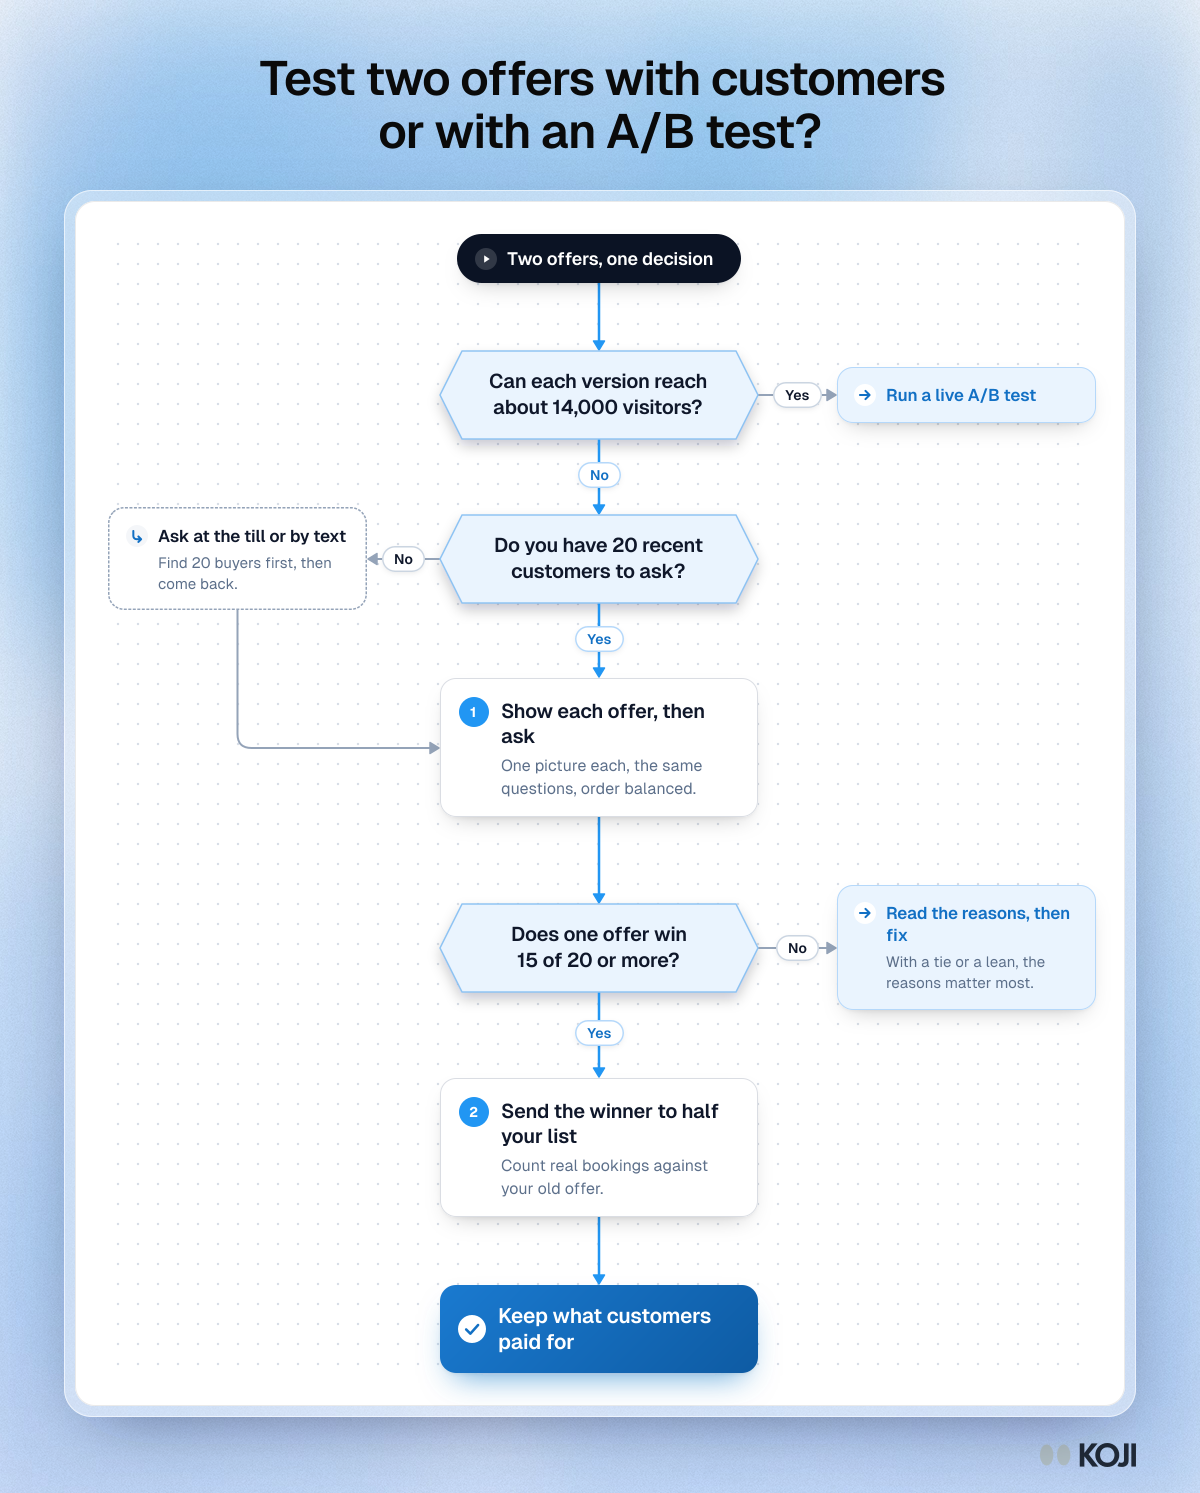
The usual advice is to A/B test it. That works when you have traffic. Take a site converting at 3%, and try to detect a 20% relative lift (3.0% to 3.6%) at 95% confidence and 80% power. The standard two-proportion calculation asks for about 13,900 visitors per version [1]. Most small businesses do not have that, and if the number dwarfs your monthly traffic, the test cannot tell you anything. Ask people instead.
That is the gap this guide fills. Not "which button colour", but "which offer, to the 20 or 30 people who already buy from me", with the reasons attached.
The method in brief
Show each customer a picture of each offer, one at a time, and ask what they think it is, what they would do, and which they would pick. This is concept testing, in the small-business version. Koji's concept testing guide covers the wider method, and the monadic testing guide explains the two designs you will choose between: each person sees one offer (monadic), or each person sees both, one after the other (sequential monadic).
Here is the honest trade. Survey guidance for monadic tests asks for around 100 respondents per concept [2]. You will not have that, and you do not need it for this decision, because you are not publishing a result. You are choosing what to try next, and you will check the choice with real bookings. Twenty to thirty people from your own customer base gives you direction and, more useful, the reasons. Qualitative research on saturation finds that interview themes tend to stabilise somewhere between 9 and 17 interviews when the people are similar and the question is narrow [3]. Your customers are similar, and your question is narrow.
Which route fits you depends on traffic and on whether you can reach customers at all.
If you want the wider comparison of methods, A/B testing versus user research sets them side by side.
Step by step
1. Make both offers equally finished
The better-looking offer wins on looks. Put each offer on one card or one image at the same size, with the same level of polish: what you get, who it is for, the price and the next step. One offer per image. A phone screenshot of your booking page works. A flyer photo works. If one is a rough sketch and the other is a designed page, redraw the sketch before you test.
Change one thing between the two where you can. If A is a six-session package and B is pay per session with a free first assessment, you are comparing two ideas at once, and a win tells you less. That is fine when you are choosing between whole offers, but write down which differences you think matter before you start. You will check your guess against what customers say.
2. Decide who counts
Use people who have bought, or nearly bought, and who match the customer you want more of. Ten regulars and ten people who came once and never returned will disagree for good reasons, and that disagreement is useful, so keep them labelled. Add one screening question so strangers who find the link do not skew the answers: "When did you last buy from us?" with answer bands.
3. Recruit about 20, then a few more
Plan on 20 finished conversations and ask around 40 people. The ask matters more than the tool. A text or message from the owner, sent by the owner, gets the quickest answers. A 2026 US Census Bureau working paper on text invitations found that texts boost early response, mostly in the hours right after they arrive [4], so send in the morning and plan to chase once the next day. For rough expectations on cold outreach, Pin's 2026 benchmark of more than 4 million messages found a 4.96% average reply rate for email and 17.08% for LinkedIn [5]. That is recruiters writing to strangers. Your own customers will reply far more often, but do not assume everyone does. The checkout, receipt and text playbook covers the asking in detail.
A small thank-you helps with people who owe you nothing. A voucher for your own shop costs you little, but it may bring in the people who like you most, and they can be kinder than a stranger would be.
4. Show one offer, then ask
Show the first offer. Let people look, then take the picture away. A short timed view (5 or 10 seconds for a simple card) tests what they take in at first glance, in the spirit of the first-impression research that shows people form a view of a page very fast [6]. If your offer has real detail to read, leave the picture up. Then ask the same set of questions after each offer, in the same order. Ask for their own words before you ask anything with a hint in it.
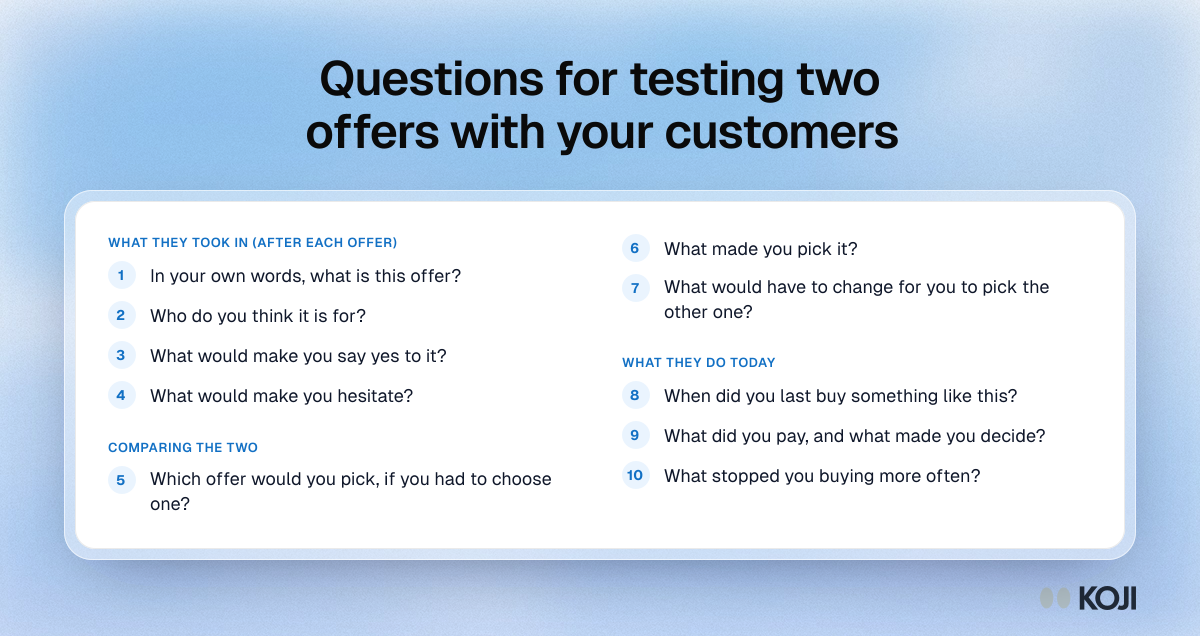
Two of these do most of the work. "In your own words, what is this offer?" shows whether the offer is understood. "What would make you hesitate?" gives you the objection you can fix. Follow each answer with "what made you say that?", because the reason is the finding.
5. Balance the order
If every person sees A first, A gets a head start. Order effects are the main known weakness of showing several concepts to the same person, and the usual fix is to rotate the order (the monadic testing guide and the question order bias guide cover it). Do this: send half of your list to one link where A comes first, and the other half to a second link where B comes first. Then add the two groups together at the end. If you cannot be bothered, you can accept the bias with 20 people, but say so in your notes and lean less on a narrow win.
6. Run it in two or three days
Collect everything in a short window and change nothing in between. Then read it once.
A worked example
Say you run a four-person physiotherapy clinic. You have two ways to sell help for lower back pain. Offer A is "Back reset": six sessions over six weeks, one fixed price, with a home plan. Offer B is "Pay as you go": a free first assessment, then each session on its own.
You make one card for each, same layout. You send the link to 40 past patients on a Tuesday morning, with a chase on Wednesday. Twenty-two finish. Two have not been in for over a year and drop out at the screening question, which leaves 20. Half of them saw A first, half saw B first.
Illustrative results:
- 14 pick A, 6 pick B.
- Asked for the offer in their own words, 17 describe A correctly ("six sessions and a plan"). Only 11 describe B correctly, and four of the others think the free assessment is the whole offer.
- Of the 14 who pick A, 11 give a version of "I know what I'm paying". Of the 6 who pick B, 4 say they do not want to commit before they know if it works.
- On "what would make you hesitate", A's most common answer is "six weeks is a lot to plan".
What do you decide? A 14-to-6 split is a lean, not a result (more on that below). But the reasons are consistent, and they point to a fix you can make. You do not drop B. You keep the fixed price of A, add the thing B's fans liked, a low-risk start, and send it as your next offer: a "Back reset" whose first session is free to try. Then you send the old A to half your list and the new one to the other half, and you count bookings. The test did not pick a winner. It gave you a better third option, and a real send tells you if it works.
Reading the results and deciding
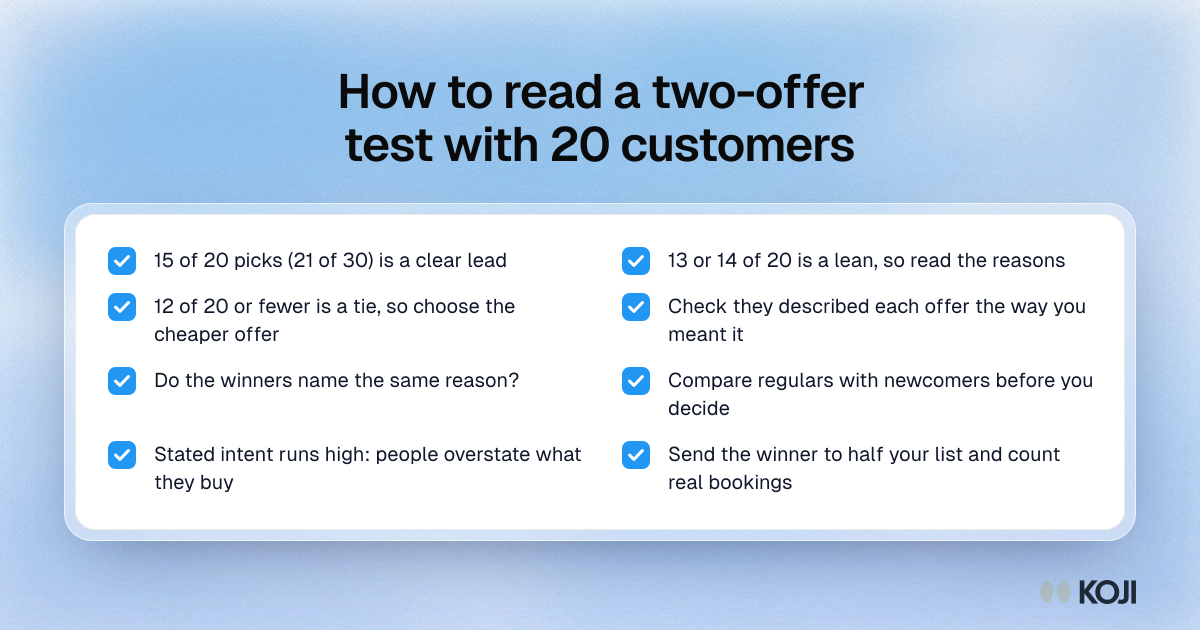
Start by counting the picks. With 20 people and no real difference between the offers, a split as lopsided as 15 to 5 would happen by chance about 4 times in 100 (a two-sided sign test; this is my arithmetic from the binomial distribution, not a published benchmark). At 14 to 6 it is about 11 times in 100. With 30 people, 21 to 9 is the equivalent of 15 to 5, and 20 to 10 is about 10 in 100.
In practice:
- 15 of 20 or more (21 of 30). A clear lead. Go with it, and still confirm with a real send.
- 13 or 14 of 20. A lean. Do not decide on the count. Read the reasons: if the winners all name the same feature, build on that.
- 12 of 20 or fewer. A tie. Customers do not care much about the difference, so choose on cost and effort, and spend your energy on something else.
- They misdescribe the offer. If most people cannot say what an offer is, the offer is the problem, whichever one "won". Fix the words first.
- Regulars and newcomers disagree. Decide which group you want more of, and follow them.
Then move one step up from opinion. People say more than they do. A meta-analysis of 77 studies found stated willingness to pay about 21% higher, on average, than what people actually paid [7]. A review of when purchase intentions predict sales finds that the link is stronger for existing products, short time frames and comparative formats [8], which is a good fit for choosing between two real offers you can sell this month. So the next step is always a small real send, not a bigger test.
Run it this week with Koji
You can do all of this with a printed card, a notebook and some patience. It works. The parts Koji handles are the slow ones: showing the picture, asking the follow-ups after each answer, and adding up 20 conversations at the end.
Build the study
- Describe it. Tell the research assistant what you are deciding, for example "which of two back pain packages my past patients prefer". It drafts the brief and the questions, and you can edit any of them.
- Attach an image to each offer question. Any question can carry one image (PNG, JPEG or WebP, under 4 MB). In the question header, choose "Add image". Write a one-line description of what it shows, because the interviewer reads it to ask about the right thing. Optionally choose how long it is visible: 3, 5, 10 or 15 seconds. The participant taps to open it, sees it once, and then answers. Images and timed views work in text and voice interviews, not in phone calls.
- Add the comparison as a single choice. Add a single choice question, "Which offer would you pick?", with the two offer names as options, and switch on "Randomize order" so neither always appears first. Follow it with an open question for the reason.
- Add a screening question so only recent customers get in, and set a response limit near 25.
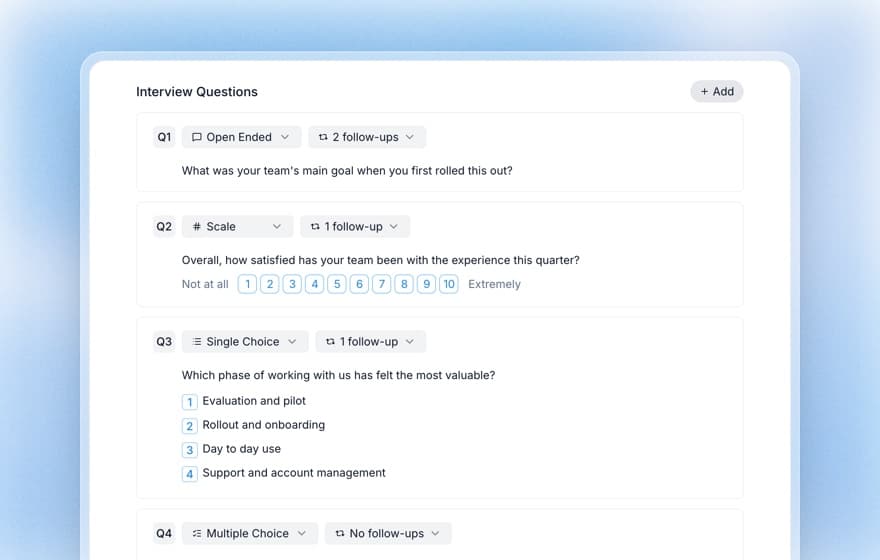
Build a second copy with the offers in the other order, so half your list sees B first. Upload the two images again in the copy.
Send it and read it
Share the interview link by text, message or email. On the Insights plan and above you can also email your own contacts from Koji with reminders, and offer a gift card or a donation as a thank-you. A text interview costs 1 credit and a voice interview 3, and a new free account starts with 10 credits, so you can pilot the study with a handful of people before you commit to the full 20.
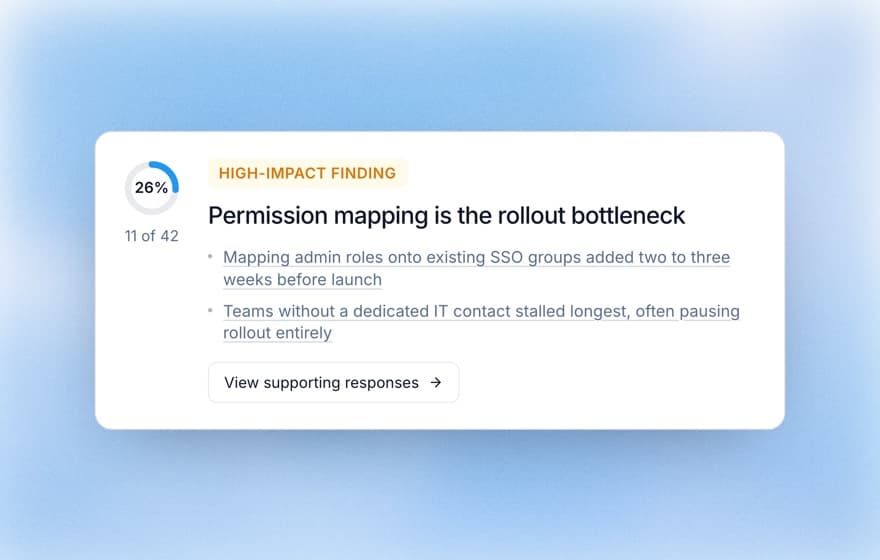
The report shows the themes, how many people said each, and the quotes behind them, and the single choice question comes out as a count per offer. Download it as an editable slide deck or a PDF if you want to show a business partner why you picked what you picked.
Common mistakes
- Leading the witness. "Isn't the fixed price better value?" gets a yes. Ask "which would you pick, and why".
- Testing only fans. People who love you pick whatever you made. Include someone who bought once and stopped.
- Changing everything between offers. Then a win tells you nothing about why. Write down the differences before you start.
- Reading a lean as a win. A 14-to-6 split with no reasons is a coin you flipped with extra steps.
- Skipping the real send. The interview narrows the choice. A booking or a sale closes it.
When research will mislead you
Customers who like you are kind, and what they say is not a purchase. Stated intent runs high [7]. Showing a picture also hides things that decide a real purchase: whether the email lands in their inbox, whether the price feels fair beside a competitor's on the day, whether they have the money that week. A test of 20 existing customers also says little about people who have never heard of you. If your goal is new customers, test the same two cards on a small paid audience or in a local group, and count the clicks and bookings. The stated versus revealed preferences guide covers this gap in detail.
Where this fits
Before you test offers, you want to know why people leave and what you charge: why customers leave a small business and what to charge. If your page, not your offer, is what confuses people, start with testing your landing page. The full route for small businesses, step by step, is in the founder's research playbook, and Koji for founders shows how the pieces connect.
FAQ
How many customers do I need to compare two offers?
Around 20 finished conversations is enough to see a clear difference and hear the reasons. Survey guidance for monadic testing asks for about 100 per concept [2], but that is for results you will publish or defend. If you are choosing what to try next and will confirm with a real send, 20 to 30 is a workable start.
Can I just ask both offers on a Facebook poll or an Instagram story?
You can, and it costs nothing. You will get a number, but not the reasons, and the people who vote are the ones who follow you. Use it as a first look, and use a short conversation for the "why".
Should each person see both offers, or only one?
Seeing only one (monadic) is cleaner but needs twice the people. Seeing both is cheaper but the first offer has an edge, so send half of your list to each order and add the groups together.
What if the split is close to 50-50?
Treat it as a tie. It means customers do not much mind which one you choose, so pick the cheaper or simpler one to run and use the reasons to improve it.
When should I use a real A/B test instead?
When each version can reach roughly 14,000 visitors at a 3% conversion rate, for a lift of 20% [1]. Most small businesses cannot, which is why this method exists.
Your next step
Make one card for each offer today, and send a text to your 10 most recent customers asking if they will answer five minutes of questions. When the first five say yes, build the study.
References
- Coddy, "A/B test sample size calculator," Coddy, accessed 2026 (two-proportion formula, 95% confidence, 80% power; 3% baseline, 20% relative lift, about 13,900 per variant, which I re-derived by hand). coddy.tech
- Drive Research, "What is monadic testing and sequential monadic testing in market research," Drive Research blog, accessed 2026. driveresearch.com
- Monique Hennink and Bonnie Kaiser, "Sample sizes for saturation in qualitative research: A systematic review of empirical tests," Social Science and Medicine 292, 2022. pubmed.ncbi.nlm.nih.gov/34785096
- US Census Bureau, working paper RSM2026-09 on text message invitations and survey response, 2026. census.gov
- Pin, "Recruiting Outreach Benchmarks 2026: The Full Data Report," Pin, 2026 (4 million+ messages). pin.com
- Gitte Lindgaard, Gary Fernandes, Cathy Dudek and J. Brown, "Attention web designers: You have 50 milliseconds to make a good first impression!," Behaviour & Information Technology 25, 2006, pp. 115-126. doi.org/10.1080/01449290500330448
- Robert Schmidt and Tammo Bijmolt, "Accurately measuring willingness to pay for consumer goods: A meta-analysis of the hypothetical bias," Journal of the Academy of Marketing Science 48(3), 2020, pp. 499-518. cris-portal.uni-muenster.de
- Vicki Morwitz, Joel Steckel and Alok Gupta, "When do purchase intentions predict sales?," International Journal of Forecasting 23(3), 2007 (read through the Marketing Science Institute listing and secondary summaries; I did not have the full text). msi.org
Further reading
- Monadic vs sequential monadic testing: the two designs in this guide, with the trade-offs in sample size.
- Concept testing methodology: the wider method that two-offer tests belong to.
- The 5-second test guide: how the timed view works and when it fits.
- Question order bias: why the first thing you show gets an edge.