If customers are leaving and you can't say why, interview two groups, not one: 10 to 12 people who left in the last 90 days, and a matched 10 to 12 who stayed. Any reason that shows up in both groups is background noise. The reasons only leavers give are your churn. By the end of this guide you'll have the list to pull, the people to match, a question bank, and rules for deciding what to fix first.
When you need this
You are past the point where you can call every customer yourself. Somewhere after Series A, the signs start to pile up:
- Gross retention slips a point or two and nobody agrees on why.
- Sales says "price", customer success says "product", and the board asks which one it is.
- Two or three large accounts cancel in the same quarter.
- The exit survey says "too expensive" every time, and discounts don't bring people back.
Guessing is expensive here because the fix is expensive. You rebuild a feature, cut the price or hire a customer success lead, and the next quarter's churn looks the same.
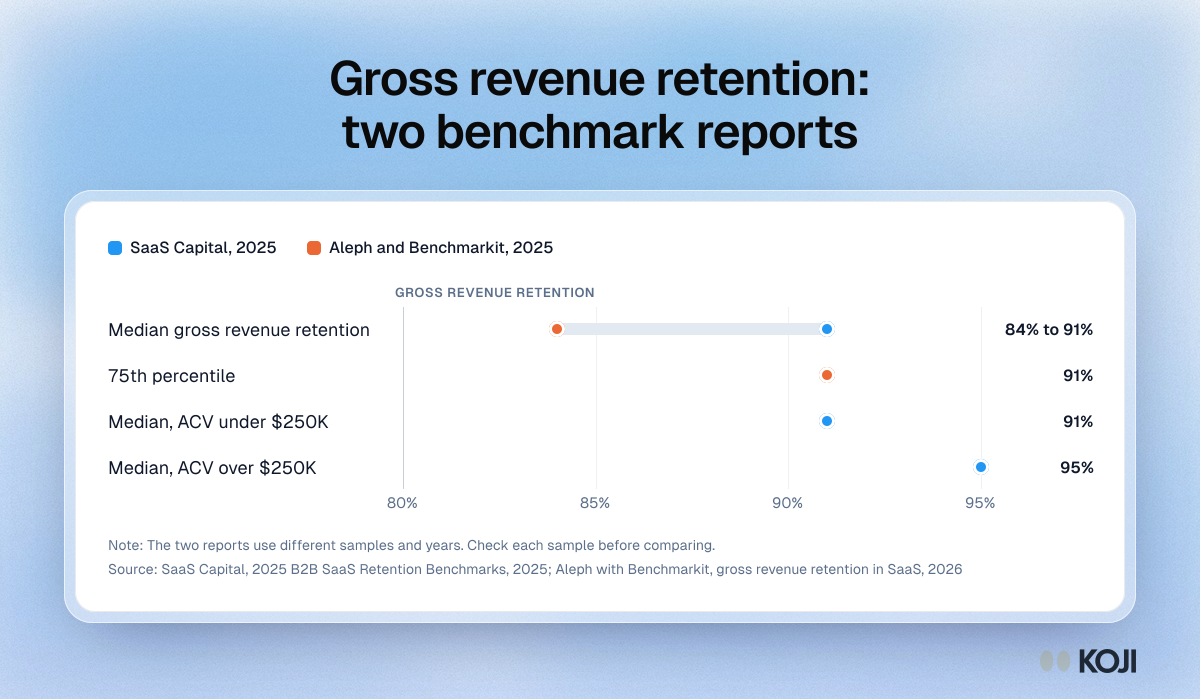
It also helps to know what "normal" is before you panic, and it turns out sources disagree. SaaS Capital's 2025 retention report puts median gross revenue retention for private B2B companies at 91%, with 95% for companies whose average contract value is above $250,000 and about 91% below it [1]. Aleph's panel of 342 companies, built with Benchmarkit, reports a 2025 median of 84%, down from 88%, and a 75th percentile of 91% [2]. The samples differ, so read your own number against the report whose companies look like yours, and treat both as context, not a target.
The method in brief: matched leaver and stayer interviews
Four routes usually get tried, in this order:
- An exit survey at cancellation. Cheap, and it captures the last straw. It rarely captures the cause.
- Usage and billing data. It tells you who is at risk and when. It can't tell you why.
- Interviews with people who left. You get the story, but with nothing to compare it to.
- Interviews with leavers and with matched customers who stayed. Same questions, two groups, and you compare the reasons.
The fourth is the one to use, because the reason you hear most often from leavers may be just as common among people who are still paying you. "It's expensive" and "support was slow" are things almost every customer will say if you ask. Without the stayers you can't tell a churn reason from a complaint. In research terms this is a case-control design, and Koji's reference guide Case-control research for churn and lost deals covers the statistics; this guide is the version you can run in a fortnight.
Two findings explain why you shouldn't trust the first answer. Nisbett and Wilson's classic review found that people often explain their own behaviour with plausible theories instead of remembering what actually moved them [5]. And Keaveney's study of more than 800 switching incidents from over 500 service customers found that price was one reason among several groups of reasons [4]. A single "reason for leaving" box can't hold that.
None of this means the exit survey is useless. It is a good tripwire and a good way to find people willing to talk. Use it to build your list, then use interviews to explain it. For the base method, see Churned customer interviews and Churn interview questions.
Who to interview, and how to reach them
Open your billing or CRM export and pull every account that cancelled or didn't renew in the last 90 days. Add plan, company size, tenure, owner and the cancel date. Memory fades quickly, so a leaver from last month is worth more than one from last year.

Photo by Ravi Palwe on Unsplash
Then match. For each leaver, pick a customer who stayed and looks the same on the things you can see: plan, size, tenure and segment. If you sell to two quite different kinds of company, run the matching inside each segment, because churn in mid-market logistics and churn in small agencies are different problems. The earlier piece on researching a new customer segment before you build shows how to split segments without over-slicing.
At this size, one account means several people. Talk to the person who made the call to leave, and to the person who used the product every day if they are different people. The champion who loved you and the buyer who cut the budget will tell different stories, and both are true.
How many. Guest, Bunce and Johnson analysed 60 interviews with one fairly uniform group and found that 92% of the themes had appeared by the twelfth interview [3]. That result comes from a uniform group, so the lesson is to aim for roughly 10 to 12 per group in each segment, and to keep going if every new call still surprises you. If you have only six leavers in a segment, interview all six and say so in your readout.
How to reach them. Send the invitation from a founder or a senior person, not from a no-reply address. Keep it short: you are not trying to win them back, you want to learn, it takes 20 minutes or a link they can answer when it suits them, and you will share what you changed. Leavers owe you nothing, so a thank-you is fair. See Research participant incentives for how to decide. Some buyers aren't allowed to accept gifts, so offer a donation instead.
Step by step
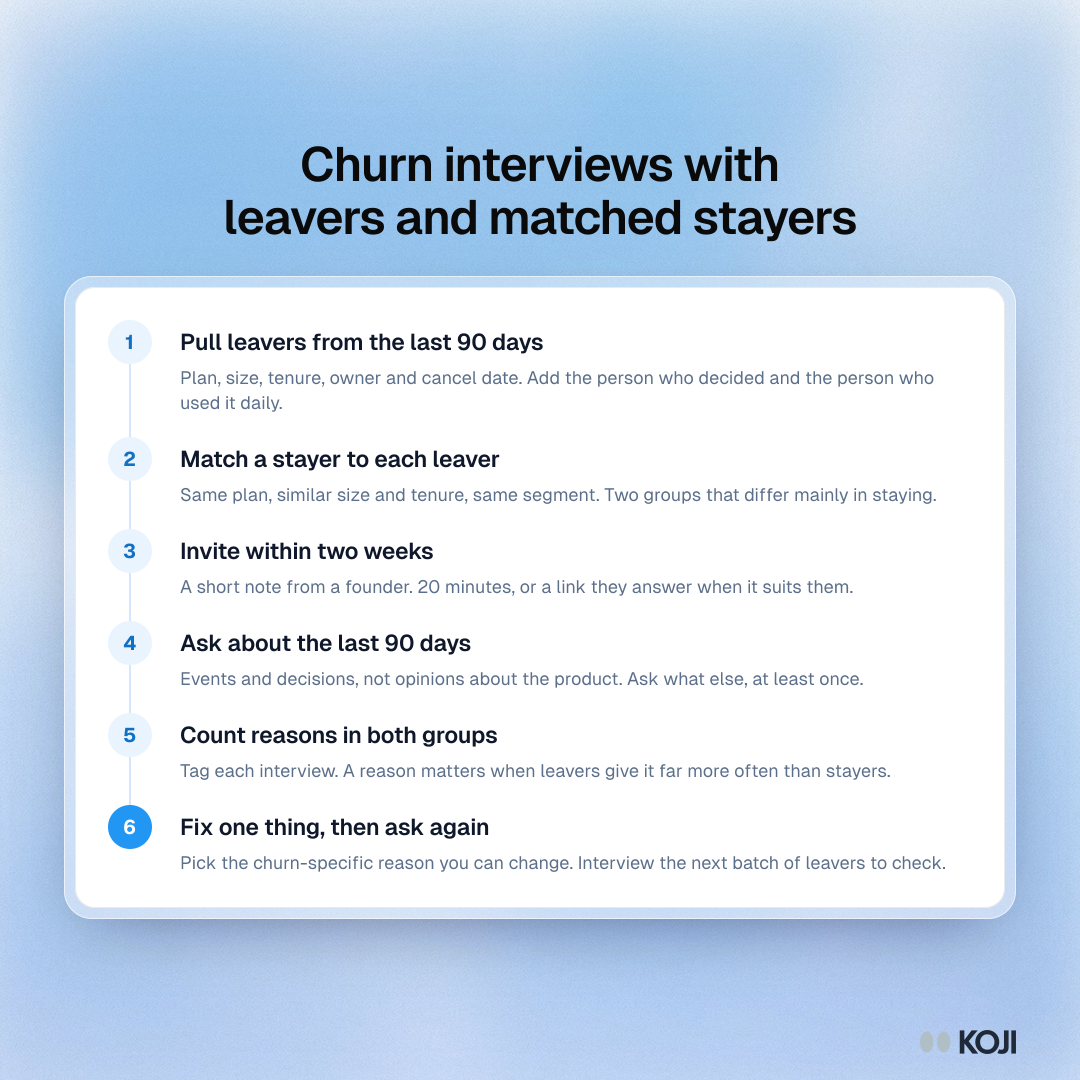
The timeline, if you start on a Monday: the list and the matches by Tuesday, invitations out on Wednesday, calls over the next eight working days, tagging and a readout in the days after. About two weeks from start to a decision.
What to ask
Anchor on the last 90 days and on real events. "Tell me about the week you first thought about leaving" works much better than "why did you cancel?" because it asks for a story the person can remember and not a verdict they have to construct.
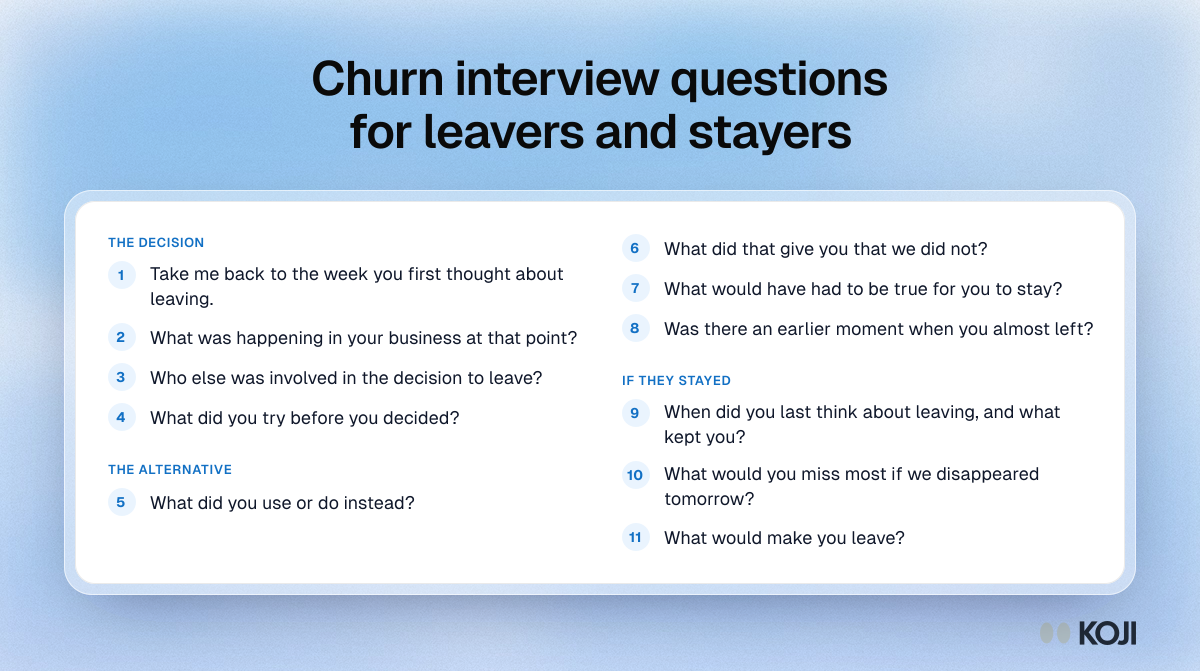
A few notes on running it. Ask for the sequence of events before you ask for reasons. Ask "what else?" at least once, since the first answer is usually the polite one. Don't defend the product, and don't offer a discount mid-call, because the moment you do the call becomes a negotiation. If someone says "it was too expensive", ask what they were comparing it with and what they got for the money.
A worked example
Say you run a 60-person company selling workflow software to mid-size logistics firms. Last quarter 14 of your 120 accounts left. The exit survey says "price" for nine of them, and sales wants a cheaper tier.
You pull the 14 and match each to a similar account that stayed. You interview 11 of the leavers and 11 of the stayers (the other three leavers don't reply after two reminders).
What you hear: seven of the 11 leavers describe the same moment. Their warehouse lead changed during an integration with a carrier system, nobody on their side owned the setup, and usage dropped for two months before the cancellation. Nine of the 11 leavers also mention price. So do eight of the 11 stayers.
Your reading: price is background, since nearly everyone says it. The integration handover is churn-specific: seven of 11 leavers raised it, and only one stayer did. You don't build the cheaper tier. You build a named owner and a check-in at the integration step, run it for a quarter, and interview the next batch of leavers to see if the story changes.
These numbers are invented to show the logic. Your own will be messier, and that is fine.
Reading the results and deciding
Tag each interview with the reasons you heard. Keep tags short and in the customer's words. Then count each reason in both groups.
| What you see | What it means | What to do |
|---|---|---|
| Common among leavers, rare among stayers | A churn-specific reason | Fix this first, if you can change it |
| Common in both groups | Background complaint | Note it, don't treat it as the cause |
| Rare among leavers, common among stayers | A reason people stay | Protect it. Put it in your positioning |
| One leaver, one story | An anecdote | Keep it, but don't act on it alone |
| Leavers split into two or three clear stories | Different churn problems | Size each one with your data before you pick |
These are rules of thumb from practice, not research thresholds: a reason is worth acting on when roughly half of leavers raise it and far fewer stayers do. With groups this small, one or two interviews either way is noise. Do not quote percentages in a board deck from 11 people. Say "seven of 11" and let the reader see the size.
Next, check the story against your data. If the reason is "nobody owned the integration", does usage really fall in the weeks before cancellation for accounts that had a champion leave? If it is price, the next step isn't a discount, it's a test: run a price test on current customers and prospects and see what the reasons say, as described in contact us or a published price.
When you are done, one page is enough: the churn-specific reasons ranked, the number of people behind each, two or three quotes, what you will change and when you'll re-measure. If this goes to a board, lead with the decision you want and let the quotes carry it. The 7-slide customer research readout shows a layout.
Run it this week with Koji
You can do all of this with a spreadsheet, a calendar and a lot of evenings. Koji speeds up the part that is hardest to scale: running and reading 20 or more conversations.
Set up the study
Start a study from the churn and cancellation template and edit the questions to match the bank above. You can mix open questions with a few structured ones, such as a 1 to 10 scale for "how disappointed would you have been if it had gone away", a single choice for the main alternative, or a ranking. The interviewer asks follow-ups on each answer, so the story behind a rating comes with it. Turn on the setting that removes personal details if you'll be sharing transcripts across the team; it strips names, emails and employers after each interview and can miss some details, so check before you forward anything. Participants can answer by text on any plan, and by voice on the Interviews and Enterprise plans. Make a copy of the study for your stayers, with the third question group.
Invite the right people
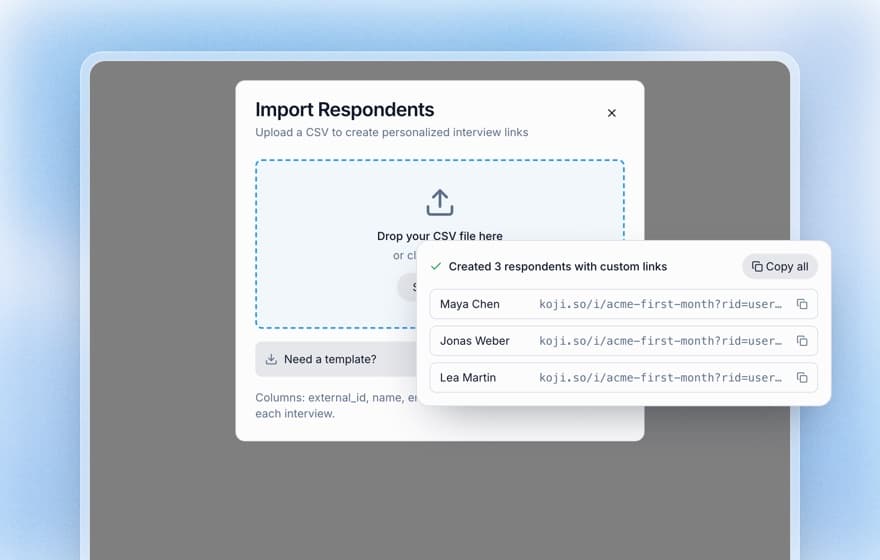
Import your list of leavers and stayers as a CSV into your Participants list and email an audience from the study's Self-recruit tab, with each person's name in the invitation and their own interview link. You can see who received it, opened it and took part, so chasing is straightforward. Recruitment email is available on the Insights, Interviews and Enterprise plans. If you'd rather send from your own CRM or email tool, the share sheet's per-person links give you a CSV with an Interview link column to use as a merge field, and a status download to bring completions back (Interviews and Enterprise plans). To pay people, switch on incentives in the study settings; they are approved one by one with the interview's quality score beside each, on the Insights, Interviews and Enterprise plans.
Read it and take it to the board
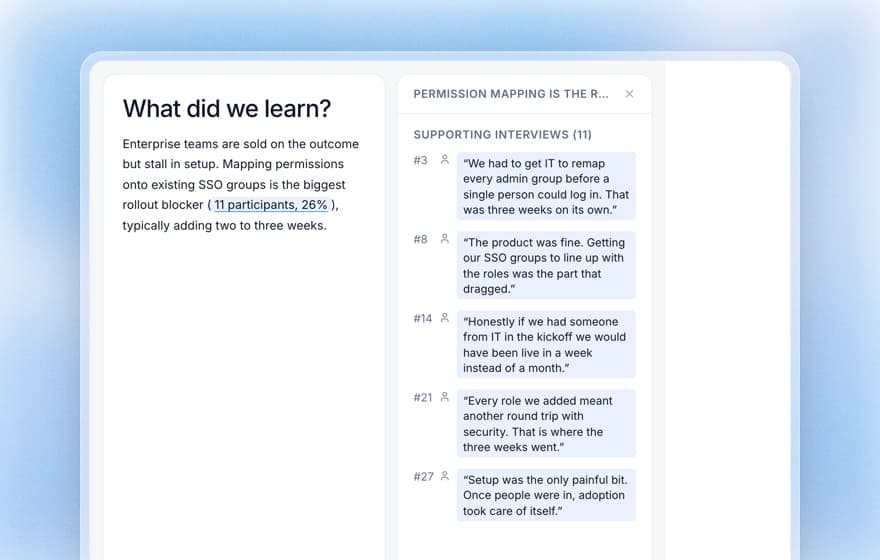
When interviews are in, the report groups what people said into themes and findings, each with the number of participants behind it and a link to the quotes. Run the report for the leaver study and the stayer study, and compare the two theme lists side by side using the table above. The comparison itself is your job, since it is the one thing Koji does not do for you, and it is only a few minutes of work once both reports exist.
Reports download as an editable PowerPoint deck, with a slide for each insight and question, or as a PDF, from the report header. That's the quickest route to a board slide or investor update. Edit the headline on the slide to name the decision, and keep the counts as "seven of 11".
The free plan runs text interviews, shareable interview links and report generation, so you can start with 10 of your leavers.
Common mistakes
- Interviewing only leavers. You get a list of grievances with no baseline.
- Matching badly. A stayer from a different segment gives you a comparison that shows the segments differ, not why anyone left.
- Using customer success to run the calls. People soften their answers for the person who looked after them. Use a founder, a product person or an AI interviewer.
- Waiting too long. At six months a leaver remembers the conclusion, not the sequence.
- Pitching in the call. The moment you offer a discount, you stop learning.
- Reporting percentages from a dozen people. Say the counts.
- Fixing the loudest reason. The most frequent reason is often background. Fix the one that separates the groups.
When research will mislead you
Interviews describe what people remember and are willing to say, and with leavers, both are limited. They explain the departed, not the next ones to go, so pair them with data that spots risk early. They can over-represent people who answer an email, who may not be the angriest ones. They can't settle price: people can say a price is too high more readily than they act on it. If price is a serious candidate, check it with behaviour, such as a pilot discount for a matched set of at-risk accounts, or a price test with real prospects, before you change a list price. And they can't tell you how big a problem is. Size each churn-specific reason with your own billing and usage data before you give it a quarter of engineering time.
There is also a practical limit: a handful of strategic accounts may not agree to an interview at all, and for those a call from a founder beats any link.
Where this fits
Retention is the first decision on the scale-up stretch of the founder's research playbook. Once you know why existing customers leave, the next question is why you lose deals that should have been yours: win-loss interviews for scaleups. If your findings point at price, go to Contact us or a published price. If your leavers belong to a segment you don't want to serve, read researching a new customer segment before you build. More for founders is at /for/founders. Small business owners without a billing system will find a lighter version in why customers leave a small business.
FAQ
How many churned customers should I interview?
Aim for 10 to 12 who left, plus 10 to 12 matched customers who stayed, per segment. Guest, Bunce and Johnson found 92% of themes in the first twelve interviews of a uniform group [3]. If you have fewer leavers than that, interview all of them.
Do I really need to interview customers who stayed?
Yes. Without them you can't tell a churn reason from a complaint every customer has. The stayers are your baseline, and the gap between the two groups is the finding.
Will customers who left agree to talk?
Some will, many won't. Send the request within a few weeks of the cancellation, from a named person, keep it to 20 minutes or a link they can answer when it suits them, and offer a thank-you. Expect a minority to reply and plan your list size around that.
Is price the real reason people leave?
Sometimes, but it is the easiest answer to give. People tend to name a plausible reason [5], and price is one of several groups of reasons in switching research [4]. Ask what they compared it with and what they got for the money, then check price with behaviour.
Can an AI interviewer run churn interviews?
For a dozen or more calls it can save you weeks, and some people are more candid with an AI than with someone from the company, though that is a claim to test with your own customers, not a rule. For your three largest accounts, call them yourself.
What if the benchmark says my retention is fine?
Benchmarks differ by source [1][2], and an average hides which customers you lose. A good number overall can still mean you are losing the segment you want to grow.
Your next step
Pull the list of everyone who cancelled in the last 90 days and pick one stayer to match each. That list is the whole first day of work, and you can do it today.
References
- SaaS Capital. "2025 B2B SaaS Retention Benchmarks." SaaS Capital research, September 2025. https://www.saas-capital.com/wp-content/uploads/2025/09/RB32WS1-2025-B2B-SaaS-Retention-Benchmarks.pdf
- Aleph, with Benchmarkit. "Gross revenue retention in SaaS." Aleph, 2026. https://www.getaleph.com/answers/gross-revenue-retention-saas-2026
- Guest, G., Bunce, A., and Johnson, L. "How Many Interviews Are Enough? An Experiment with Data Saturation and Variability." Field Methods 18(1), 2006, pp. 59 to 82. https://doi.org/10.1177/1525822X05279903
- Keaveney, S. M. "Customer Switching Behavior in Service Industries: An Exploratory Study." Journal of Marketing 59(2), 1995, pp. 71 to 82. https://doi.org/10.2307/1252074
- Nisbett, R. E., and Wilson, T. D. "Telling More Than We Can Know: Verbal Reports on Mental Processes." Psychological Review 84(3), 1977, pp. 231 to 259. https://deepblue.lib.umich.edu/items/c810051d-bb3a-48c7-86ae-da8ef48caa77
Further reading
- Case-control research for churn and lost deals: the statistics behind choosing a comparison group, for when you want to go past rules of thumb.
- Survivorship bias in customer research: why the customers you can reach are not the ones you lost.
- Churned customer interviews: the base method, with scripts, if you want a different framing from the one here.
- Keaveney (1995), above: the classic study of why service customers switch, worth reading for how many different reasons it found.