To show customer evidence to your board, give it one page each quarter, not a deck of quotes. The page answers one question tied to a number the board already watches (churn, net retention, win rate). It says who you heard from and who you missed, gives two or three reasons as counts ("7 of 10 churned accounts"), each set against a comparison group, with one verbatim quote apiece. It ends with what you will change and what would change your mind. By the end of this playbook you'll have the page layout, a question bank you can rerun every quarter, decision rules for what makes the page and what stays off it, and a worked example from 24 interviews.
This is for founders and first PMs at Series A to C companies who already run some customer interviews and now have to put them in front of investors. If you're getting ready for diligence calls rather than a board meeting, read the guide to investor reference calls instead. For a one-off study readout to executives, the 7-slide readout is the better fit. This piece is about the page you bring every quarter.
When you need this
You need it when the board starts asking "why?" about a number. Gross retention dipped, a cohort expanded less than plan, or you lost three deals to the same competitor. The metrics slide shows what happened. Only customers can tell you why, and a board that hears "we think it's onboarding" twice in a row stops trusting the answer.

Photo by Jakub Żerdzicki on Unsplash
The signs that you're guessing:
- Your churn reasons come from a cancellation dropdown or from what account managers remember.
- The quotes in your last deck were chosen because they were vivid, not because they were typical.
- You can't say how many customers you spoke to this quarter, or how you picked them.
- Each quarter's customer slide uses different categories, so nobody can see a trend.
Boards notice. In PwC's 2026 survey of about 600 US public company directors, 82% said management could improve the materials it gives the board [1]. Board Intelligence found that 57% of directors in 2024 said finding the key messages in their board papers was like looking for a needle in a haystack, up from 50% in 2023 [2]. Those are big-company boards, but your investors sit on them too, and they read your deck the same way.
There's also a cost to guessing that shows up in the metrics. SaaS Capital's 2025 benchmarks put median net revenue retention for private B2B SaaS at 101% and median gross revenue retention at 91% [3]. When your number moves a few points either side of those medians, the board wants to know whether it's noise or a pattern. A page built from real interviews is how you answer that without hand-waving.
The method in brief
The method is a small, repeated interview study, not a one-off project. Every quarter, interview two groups that differ on the metric the board cares about: accounts that left and accounts that stayed, or deals you lost and deals you won. Ask the same core questions each time. Report counts within each group.
Three choices make it board-grade:
A comparison group. If 7 of 10 churned accounts mention a bad rollout, that sounds like the cause. If 6 of 14 retained accounts say the same, it isn't the cause, it's just common. Without the second group you can't tell the difference. Koji's guide to case-control research for churn and lost deals explains the logic; the scaleup churn playbook shows how to recruit both groups.
Enough people per group to see a pattern, and honesty about what that is. A systematic review of saturation studies found that interviews with a fairly similar group and a narrow question reached saturation at 9 to 17 interviews [5]. So 10 to 15 per group is a sensible floor for "what are the main reasons?". It's nowhere near enough for "what share of all customers?", and the page should say so. See how many user interviews you need for the longer argument.
The same questions every quarter. Stable questions and stable categories are what turn four separate pages into a trend line the board can read.
Step by step
1. Pick the one question for this quarter (week 1)
Start from the metric the board will spend time on. "Why did gross retention fall from 93% to 89% in mid-market?" is a board question. "What do customers think of us?" is not. Write the question at the top of a doc and share it with your lead investor before you start. If they'd rather hear about something else, you've learned that cheaply.
2. Choose the two groups and pull the lists (week 1)
Typical pairs:
- Churned in the last 90 days, and accounts of similar size and age that renewed.
- Deals lost in the quarter, and deals won in the quarter.
- Accounts that expanded, and accounts that stayed flat.
Aim for 10 to 15 completed interviews per group. Invite two to three times that many, since reply rates from former customers are low. Talk to the person who made or pushed the decision, not whoever answers support email.
3. Run the interviews (weeks 2 to 4)
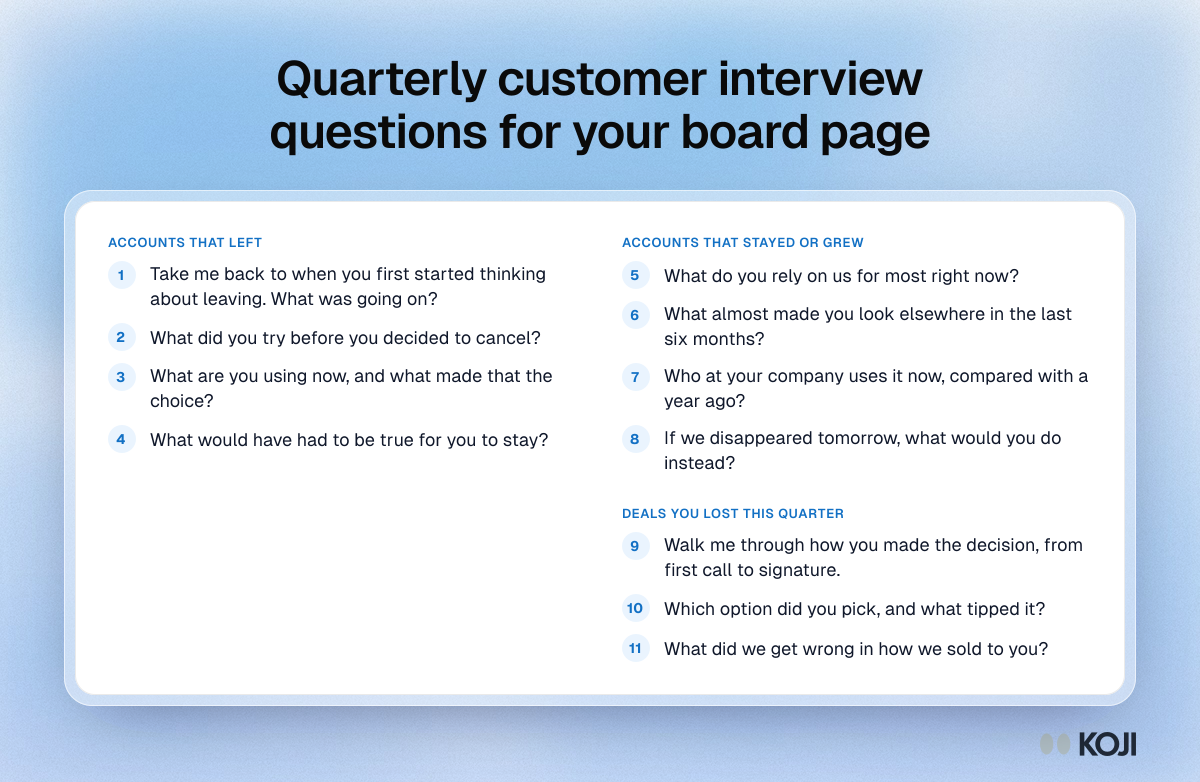
Keep them to 15 to 20 minutes and ask about events, not opinions. "Take me back to when you first thought about leaving" gets you a story with dates. "Why did you leave?" gets you the polite answer they already gave the cancellation form. Use the bank below, then follow up on whatever they say.
4. Code the reasons into stable categories (week 4)
Read every transcript and tag each account with its main reason, using last quarter's categories wherever they fit. Add a new category only when three or more accounts need it. Then count, per group. Keep a short "watching" list for reasons one or two people raised.
5. Pick the quotes last
Choose quotes only after you have the counts, and only from the biggest categories. Take the one that says the typical thing most plainly, not the angriest or the funniest. A meta-analysis of 61 papers on evidence and persuasion found that stories beat statistics when people feel personally involved [4]. A board member who loves the product is exactly that reader. One vivid quote can outweigh your whole count, so make sure it points the same way.
6. Build the page (week 5)
The page has seven parts, in this order:
- The question, tied to the metric.
- Who we heard from: how many in each group, how they were picked, and who's missing ("no one from accounts under 20 seats").
- The top two or three reasons, as counts in each group: "7 of 10 churned, 2 of 14 retained".
- One verbatim quote per reason, attributed by role ("Ops lead, 12-site chain"), never by name.
- What changed since last quarter, in the same categories.
- What we'll do, with an owner and a date.
- What would change our mind: the evidence that would prove you wrong, and when you'll have it.
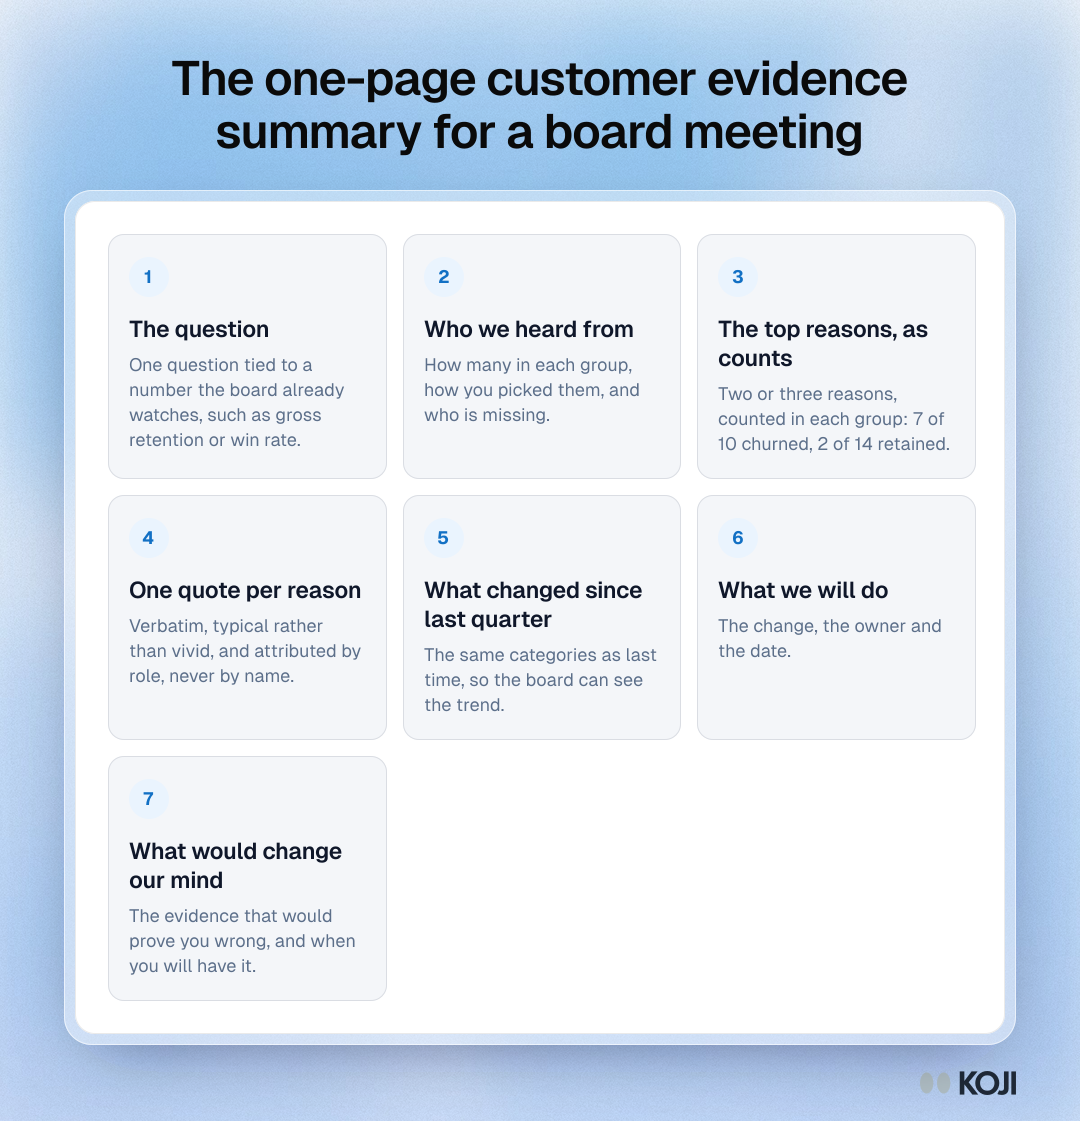
Send it with the rest of the board pack, two days ahead, so the meeting can be about part 6.
A worked example
Say you're the CEO of a 45-person company that sells inventory software to independent pharmacy chains. You raised a Series A 14 months ago. Gross revenue retention in your mid-market segment (5 to 30 locations) slid from 93% to 89% over two quarters, and the board asked why.
You pull the 22 mid-market accounts that churned in the last 90 days, and 40 renewed accounts with similar size and tenure. Over three weeks you finish 10 churn interviews and 14 retained ones, each about 18 minutes.
What you hear: 7 of 10 churned accounts describe the same moment. They opened a new location, the setup for that site took weeks, and the regional manager gave up and went back to spreadsheets. Only 2 of 14 retained accounts describe anything like it, and both say a customer success manager stepped in. Price comes up in 4 of 10 churn interviews, but also in 5 of 14 retained ones, so it isn't what separates the groups. One churned owner mentions a competitor by name.
Before you put numbers on the page, check how much they can bear. With 7 of 10, the true share among all churned mid-market accounts could plausibly be anywhere from about 40% to 89% (a 95% Wilson interval [6]). With 2 of 14 it's about 4% to 40%. The ranges don't overlap, so "new-site setup separates churned from retained accounts" is a fair claim. "70% of churn is caused by setup" is not, and you leave it off.
Your page reads:
- Question: Why did mid-market gross retention fall from 93% to 89%?
- Who: 10 of 22 churned mid-market accounts, 14 of 40 similar renewed accounts, October 2026. Missing: chains over 30 locations.
- Main reason: Adding a new location broke the rollout. 7 of 10 churned, 2 of 14 retained, and both of those were rescued by a CSM.
- Not the reason: Price came up as often among accounts that stayed (5 of 14) as among those that left (4 of 10).
- Quote: one line from a regional manager about the week they gave up.
- Change: Ship a copy-a-location setup and assign a CSM to every new-site event. Owner: head of product. Date: end of Q1.
- What would change our mind: if next quarter's churned accounts that opened no new site leave at the same rate.
The board conversation is now about a fix with a date, not about whether to cut prices.
Reading the results and deciding
Run each candidate finding through four questions before it goes on the page.
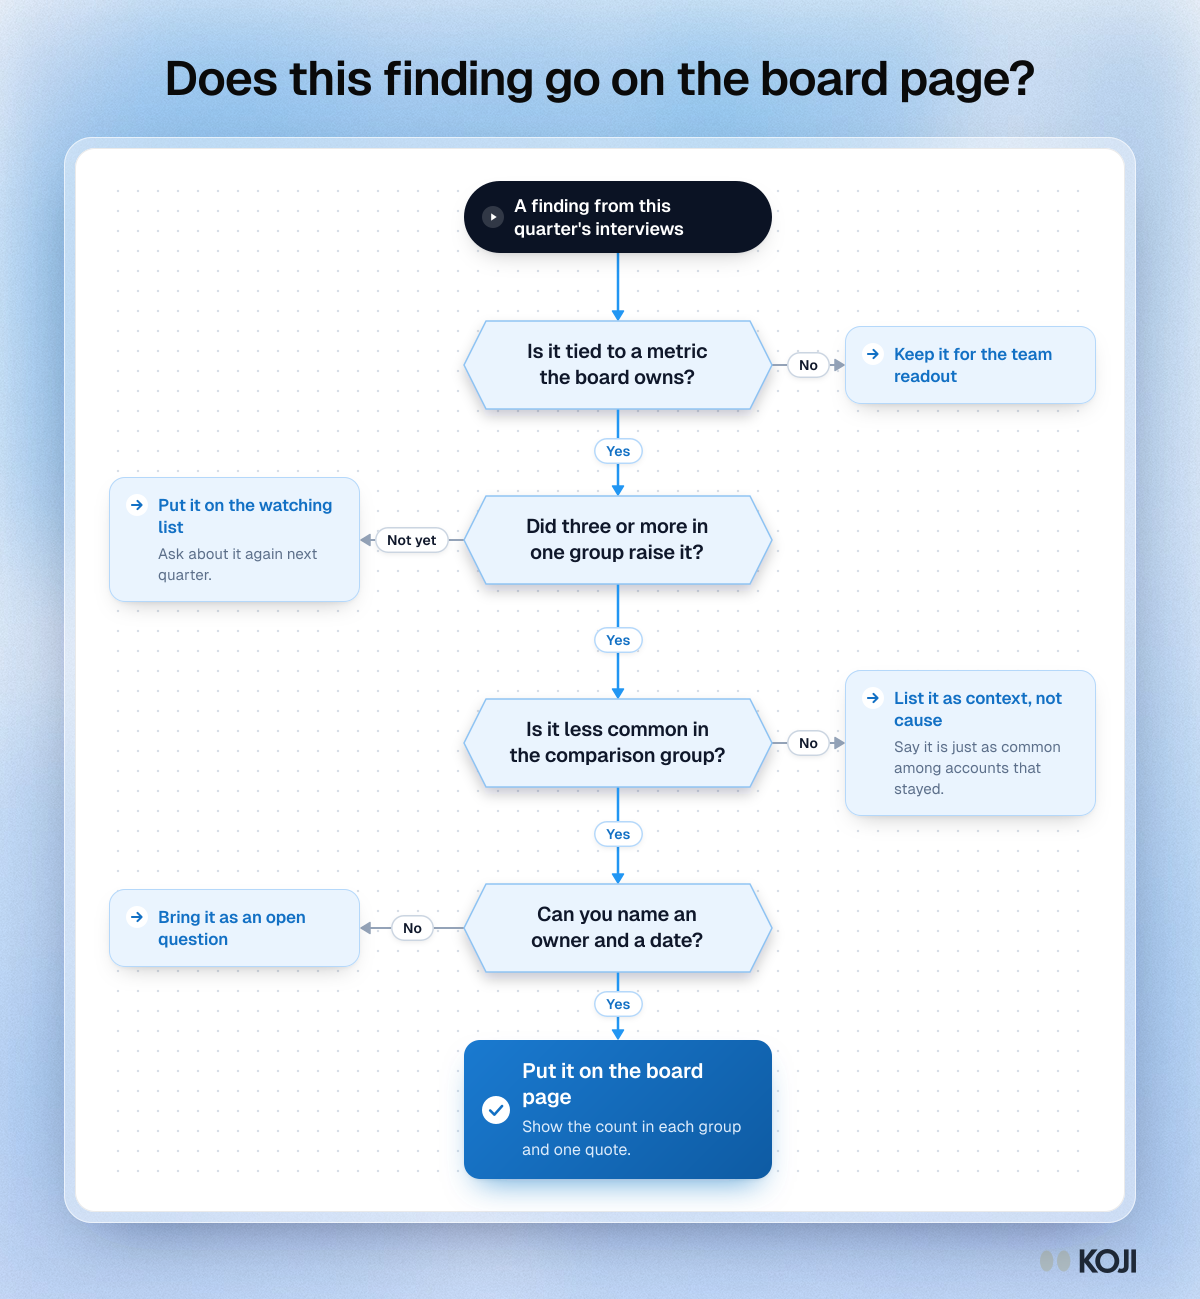
The rules behind it:
- Three or more in a group, or it goes on the watching list. One or two mentions is a lead, not a finding.
- Compare the groups. A reason that's about as common among accounts that stayed is context, not cause. Say so plainly; that's often the most useful line on the page, because it stops the wrong fix.
- Counts under 20, never percentages. "7 of 10" is honest. "70%" invites someone to multiply it by your customer base.
- No owner and date, no recommendation. Bring it as an open question for the board instead.
- When the groups barely differ, say "no clear driver yet". Then name what you'll try next quarter: a different pair of groups, or behavioural data to pair with the interviews.
Run it this week with Koji
You can run all of this by hand with a calendar and a spreadsheet. Koji makes the slow parts faster: recruiting both groups, running the interviews without booking 24 calls, and turning the report into slides.
- Start the study from one message. Describe the question and the two groups ("interview churned and renewed mid-market accounts about why they left or stayed"). The research assistant drafts the brief; paste in the question bank above and keep the follow-ups on.
- Invite both groups by email. On Insights, Interviews and Enterprise plans you can add each list to Participants as its own audience and email them an invitation from the study's Self-recruit tab, with reminders. Keep a property for the group so you can tell the transcripts apart later.
- Let people answer when it suits them. Former customers rarely book a call, but many will answer a 15-minute voice or text interview on their own time. Koji asks the follow-ups in each one.
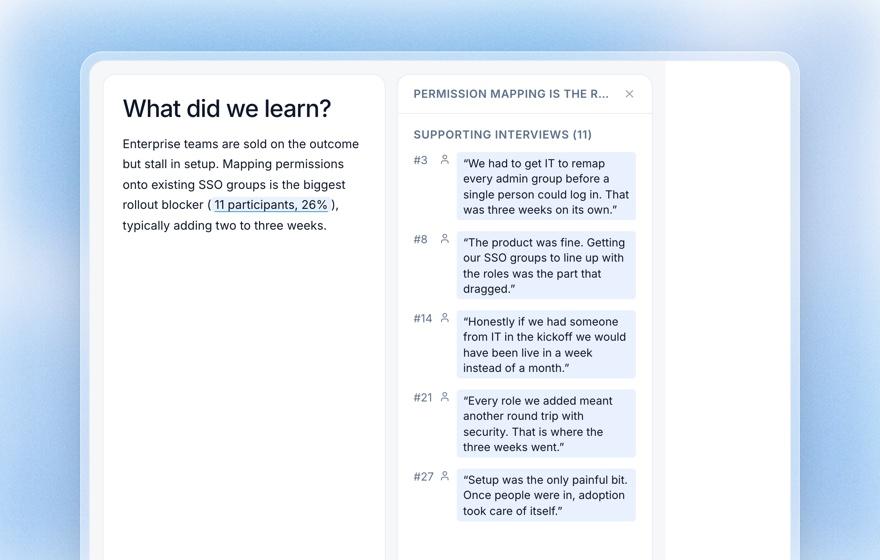
- Check every claim against its quotes. In the report, click a finding to open the supporting responses beside it, and count by group. The guide to tracing report findings to evidence walks through it.
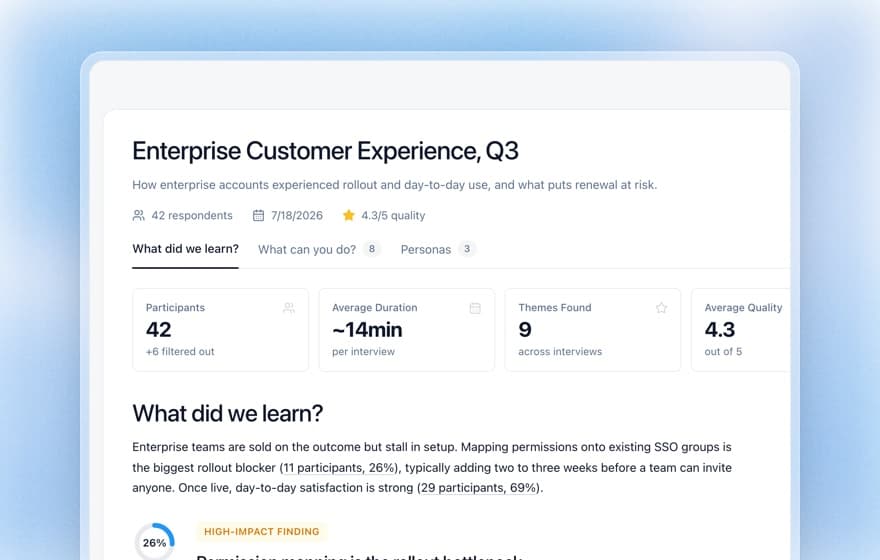
- Download the report as slides or a PDF. Any report downloads as an editable PowerPoint deck (it opens in Keynote and Google Slides too) with a cover, an "at a glance" slide on who you heard from, an executive summary, a slide per insight with a quote, and a slide per question with charts you can edit. You can also take the whole report as a PDF. Downloads work on every plan, including Free. For the board, cut the deck to the seven parts above and keep the full PDF as the appendix. The editing checklist covers the cut.
- Rerun it next quarter. Duplicate the study, refresh the two lists and send it again. Same questions, same categories, a new page. Board members you invite as workspace viewers can read the full report themselves without taking a paid seat.
Common mistakes
- Only interviewing the people who left. Then every common complaint looks like a cause. Always run the comparison group.
- Choosing the quote first. If you start from a great quote, you'll find a count to fit it. Count first.
- Changing the categories every quarter. The board can't see a trend if "onboarding" becomes "activation" and then "time to value".
- A wall of quotes. Ten quotes on one slide read as cherry-picking, however fair they are. One per reason is enough; the rest go in the appendix.
- Hiding who you missed. If you couldn't reach the largest accounts, say so on the page. The board will ask anyway.
- Feature requests on the board page. They belong in the product review. The board needs reasons and decisions.
When research will mislead you
Interviews tell you why people say they did something. They're weaker on what people will do next. On price, people state they'd pay about 21% more than they really do, on average, across 77 studies [7]. So when the page says "customers would pay more for X", pair it with a real test (a new price for new accounts, or a paid pilot) before anyone builds a forecast on it.
Former customers also tidy up their story. "It was too expensive" is often the easy answer for "we never got it working". That's why you ask about events and dates, and why the comparison group matters.
Small groups can't size anything. Ten churned accounts can show you the main reason; they can't tell you what share of revenue it costs. For that, pair the interviews with your own data: tag every churned account with its coded reason and sum the ARR. Then the page can say "accounts that described this lost us €X in ARR this quarter", which is a number from your books, not from a sample.
Where this fits
On the founder's research playbook, this sits in the scaling stage under "How do I show customer evidence to my board and team?". Before it, run churn interviews with the customers who left and the ones who stayed or a win-loss study on bigger deals; those are the studies that feed this page. For a one-off study readout, use the 7-slide readout. More founder playbooks are at Koji for founders.
FAQ
How many customer interviews do I need before I show them to my board? About 10 to 15 per group you're comparing, so 20 to 30 in all. That's enough to see the main reasons. It isn't enough to give percentages, so report counts and say what the sample can't tell you.
Should I use percentages or counts for interview findings? Counts, whenever a group is under about 20 people. "7 of 10" tells the board both the finding and the sample size. "70%" hides the sample and invites people to scale it up.
How do I stop the board fixating on one angry quote? Pick quotes after you've counted, only from the biggest categories, and put the count right next to each one. If a quote is memorable but not typical, leave it in the appendix.
What if the interviews contradict our retention data? Show both and say which you trust for what. Usage and revenue data tell you what happened and how much it cost; interviews tell you why. If they disagree, that's a finding, and the next quarter's study should be designed to settle it.
Can I share the full research report with board members? Yes. Send the page in the board pack and the full report as the appendix. In Koji you can download it as a PDF or invite board members as workspace viewers so they can read every report themselves.
Your next step
Write the one question for next quarter's board meeting today, tied to a number on your metrics slide, and send it to your lead investor. Then pull the two lists. If you want the interviews to run while you get on with the quarter, start a study in Koji and invite both groups from the same place.
References
- PwC. "Board expertise gaps are rising as oversight demands grow: Insights from PwC's 2026 Annual Corporate Directors Survey." PwC press release, 2026. https://www.pwc.com/us/en/about-us/newsroom/press-releases/pwc-2026-annual-corporate-directors-survey.html
- Board Intelligence. "The state of board effectiveness in 2025." Board Intelligence blog, 2025. https://www.boardintelligence.com/blog/the-state-of-board-effectiveness-in-2025
- SaaS Capital. "2025 B2B SaaS Retention Benchmarks." SaaS Capital research report, 2025. https://www.saas-capital.com/wp-content/uploads/2025/09/RB32WS1-2025-B2B-SaaS-Retention-Benchmarks.pdf
- Freling, T., Yang, Z., Saini, R., Itani, O. and Abualsamh, R. "When poignant stories outweigh cold hard facts: A meta-analysis of the anecdotal bias." Organizational Behavior and Human Decision Processes, 160, 2020. https://econpapers.repec.org/RePEc:eee:jobhdp:v:160:y:2020:i:c:p:51-67
- Hennink, M. and Kaiser, B. "Sample sizes for saturation in qualitative research: A systematic review of empirical tests." Social Science and Medicine, 292, 2022. https://pubmed.ncbi.nlm.nih.gov/34785096/
- Wilson, E. B. "Probable inference, the law of succession, and statistical inference." Journal of the American Statistical Association, 22(158), 1927. https://doi.org/10.2307/2276774
- Schmidt, J. and Bijmolt, T. "Accurately measuring willingness to pay for consumer goods: A meta-analysis of the hypothetical bias." Journal of the Academy of Marketing Science, 48, 2020. https://cris-portal.uni-muenster.de/portal/en/publication/60727941
Further reading
- Bryan Schreier, "Preparing a Board Deck", Sequoia: a short, sane structure for the whole board deck, so your customer page fits into it. https://articles.sequoiacap.com/preparing-a-board-deck
- First Round Review, "Board Meetings 101 for Early-Stage Founders": how experienced founders run the meeting around the deck, including pre-wiring bad news. https://review.firstround.com/board-meetings-101-for-early-stage-founders/
- Koji, Presenting research findings to stakeholders: the general rules for turning a study into a decision, for any audience.
- Koji, k-anonymity for segment reporting: when a segment is too small to report without identifying the customer, which matters once you cut a board page by account size.