Tracing Report Findings Back to the Evidence
Every finding, chart and recommendation in a Koji report links to the interviews behind it. Learn how to open the evidence panel, read supporting quotes and check a finding before you share it.
To check where a finding in a Koji report comes from, click it. Every underlined claim in the summary, every finding card's View supporting responses button, every bar, slice and scale cell in a chart, and every recommendation opens an evidence panel beside the report. It lists the interviews behind that claim, each with the participant's own words highlighted, and one more click opens the full transcript, scrolled to the exact message. You never have to take an AI summary on trust: the people behind each sentence are one click away.
This guide covers where the evidence lives in a report, how to read the panel, and a quick routine for checking a finding before you share it.
Why traceable findings matter
AI analysis is fast, and that speed is only useful if people believe the output. Stakeholders who weren't in the interviews will ask the same question every researcher has heard: "How many people actually said that?" A summary that can't answer it gets politely ignored.
Trust in AI output is still low. In the KPMG and University of Melbourne global study Trust, attitudes and use of artificial intelligence: A global study 2025, which surveyed over 48,000 people in 47 countries, only 46% said they were willing to trust AI systems. Research teams feel that gap directly. The fix isn't a disclaimer. It's showing the work.
Traditional survey tools give you a chart and stop there. If 34% picked "too expensive", you know the number but not the story behind it. Koji keeps the number and the story together: every figure in a report is linked to the interviews it was counted from, so you can read why people said what they said, in their words.
Where the evidence lives in a report
A Koji report opens on the What did we learn? tab. Evidence links run through the whole page.
Highlighted claims in the summary
The summary at the top of What did we learn? is written as a short story of what you found. Claims that rest on specific interviews are underlined. Hover over one and it highlights; click it (or press Enter when it has keyboard focus) and the evidence panel opens with that sentence as its description. Screen readers announce each claim together with how many interviews support it.
The same clickable claims appear in finding-card bullets, recommendation descriptions and the From the follow-ups notes under structured questions.
Finding cards
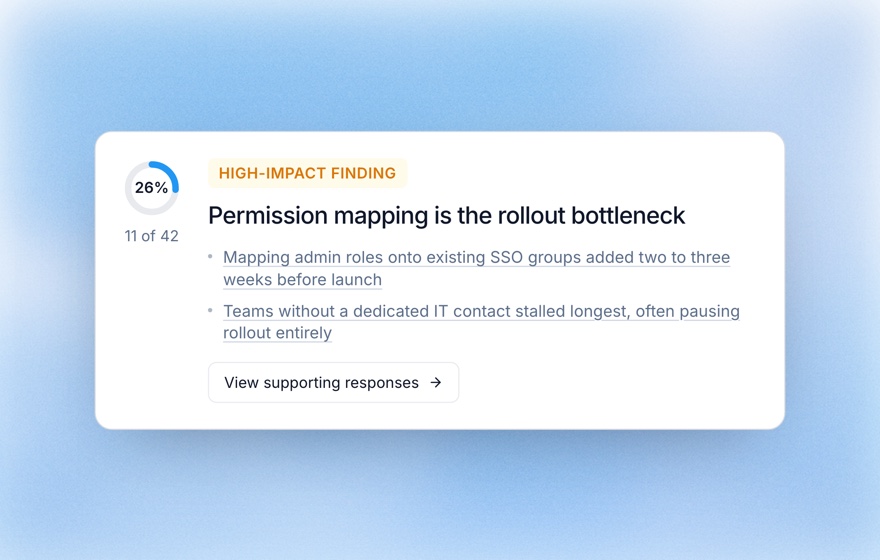
Each finding card shows:
- A prevalence ring with a percentage and an "N of M" count: how many participants support the finding out of the interviews in the report.
- A label that reflects priority and reach: Critical risk, High-impact finding, Notable pattern or Emerging signal.
- The headline and key points.
- View supporting responses, which opens the panel with every interview behind the finding.
Cards are sorted by how many participants support them, so the most widely shared findings come first.
Charts
Every chart in Findings by question and the appendix is clickable:
- Bar charts (themes, single choice, multiple choice and ranking questions): click a bar to see the interviews counted in it. Theme bars also show the phrases participants actually used, since related phrasings are grouped into one theme.
- Pie charts (yes/no questions and NPS breakdowns): click a segment or its legend item.
- Scale charts (ratings, NPS, CSAT): click a score to see who gave it, and why.
- Notable quotes: click a quote to see it in context.
Each chart also carries a sample-strength badge, from Insufficient sample to Strong sample, so you can see at a glance how much weight a split can bear. Koji supports six structured question types (open-ended, scale, single choice, multiple choice, ranking and yes/no), and each one gets its own chart; see the structured questions guide.
Recommendations
On the What can you do? tab, each action shows a supporter count and a confidence label (High confidence, Moderate confidence or Low confidence). Hover the label to see "N of M participants". Expand a recommendation to see the theme it's Grounded in, a representative quote, and View supporting responses.
Personas
On the Personas tab, each persona's participant count is a button. Click it to open the interviews behind that persona, and click the In their words quote to open the interview it came from.
Reading the evidence panel
On a desktop screen the panel opens to the right and pushes the report aside, so the claim and its evidence stay side by side. On smaller screens it opens full screen.
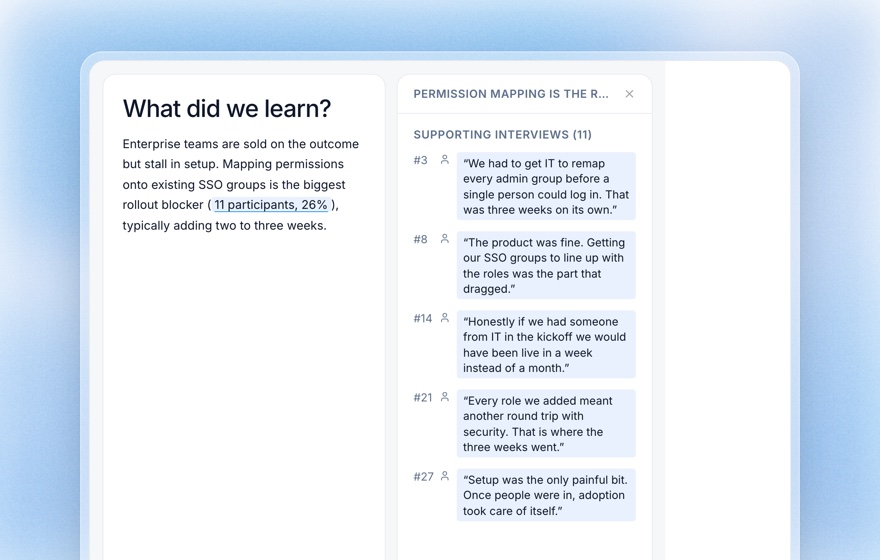
Top to bottom, the panel shows:
- Description: the exact text or chart label you clicked.
- Computation details: a plain line explaining how the figure was counted, for example "Drawn from 11 interviews the analysis identified as supporting this claim." This line is generated from the data, not written by the AI, so it always matches the count.
- Supporting interviews (N): one row per interview, labelled by participant number (#7, #12), with the supporting quote highlighted. Participant names don't appear in these rows.
For choice questions in the Question Coverage section of the appendix, the panel groups people by the option they picked under Responses by answer, so you can compare the reasons behind each choice.
Opening the full transcript
Click any row to open that interview inside the panel, without leaving the report. It has two tabs, Insights and Transcript. When the evidence points to a specific message, the panel opens on Transcript and scrolls straight to it, with the supporting phrase highlighted. Use Back to return to the list.
Reading the turn before and after a quote is the fastest way to check it wasn't taken out of context. It also shows you how the AI interviewer's follow-up questions drew the answer out, which is often where the most useful detail sits.
A five-minute routine for checking a finding
Before you put a finding in a deck or a roadmap, run through this:
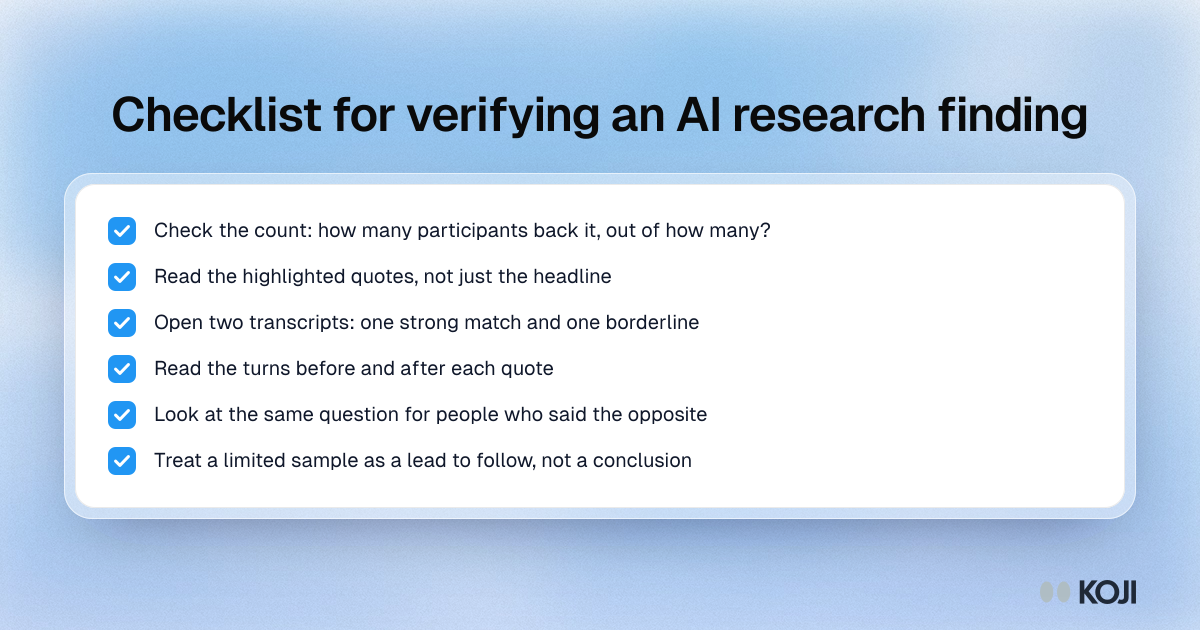
- Check the count. Look at the "N of M". Two people out of forty is a lead worth following, not a conclusion.
- Read the quotes, not just the headline. Do the highlighted words actually say what the finding claims?
- Open two transcripts. Pick one that agrees strongly and one that's borderline. Read the surrounding turns.
- Look for the counter-signal. Check the chart for the same question: did a meaningful group say the opposite?
- Mind the sample badge. If a split is marked Limited sample, report it as directional.
Which interviews a report includes
A report counts completed interviews that have been analysed. Previews and test runs never appear, and the lowest-effort interviews are filtered out by the quality gate (you aren't charged for those either). When interviews were filtered out, the Participants card shows "+N filtered out", so the "M" in every "N of M" matches the interviews actually in the report.
Generating or refreshing a report uses 5 credits. Regenerate stays disabled until new qualifying interviews arrive, so you won't spend credits on an identical report. Each refresh creates a new version, and the evidence links always point at the interviews in that version.
Evidence on shared reports
When you publish a report, people with the link see the same clickable summary, finding cards, charts and recommendations, and they can open the evidence panel with its quotes and computation details. They can't open full transcripts: those stay inside your workspace. Quotes in recommendations and notable quotes show the participant's display name if one was collected, otherwise an anonymous participant ID, so think about what you collect in your intake form before you share widely. See Publishing and sharing reports.
Tips for presenting traceable findings
- Quote the count with the claim. "11 of 42 participants (26%) said permission mapping slowed rollout" lands better than "many users".
- Link, don't screenshot. A published report lets a sceptical stakeholder click through to the quotes themselves.
- Pair a number with a voice. One verbatim quote next to a percentage makes both more believable.
- Say what the sample can't tell you. Naming the limits makes the rest of your findings more credible, not less.
Related Resources
Related Articles
Generating Research Reports
Create comprehensive aggregate reports across all your interviews — including summaries, themes, recommendations, and statistics.
How the Quality Gate Works
Understand Koji's quality gate — conversations scoring below 3/5 are completely free and don't consume credits, protecting your research budget.
Publishing & Sharing Reports
Make your research reports accessible to stakeholders, team members, and decision-makers.
How to Read Your Koji Research Report: A Section-by-Section Guide
A complete walkthrough of every section in a Koji research report — from the overview and themes to quantitative charts, key quotes, and the quote behind every claim, so you can extract maximum value from your findings.
Structured Questions in AI Interviews
Mix quantitative data collection — scales, ratings, multiple choice, ranking — with AI-powered conversational follow-up in a single interview.
Viewing Interview Transcripts
How to read, navigate, and get value from your interview transcripts in Koji.