How to Quantify Qualitative Data Without Overclaiming
How to turn coded interview themes into counts you can defend: count people not mentions, give the base, add the uncertainty, and know when a survey is the better tool.
You quantify qualitative data by turning coded themes into counts you can defend: how many participants raised each theme, in which segments, and how often themes appear together. Count people, not mentions. Report the count with its base ("7 of 12 participants"), not a bare percentage. And never treat a count from a small, purposive sample as an estimate of how common something is in your whole market. Done this way, numbers make qualitative findings sharper. Done carelessly, they make weak findings look strong.
This guide covers when counting helps, the five levels of quantification, a step-by-step method, how to report counts honestly, and the mistakes that turn useful numbers into misleading ones.
Should qualitative researchers count at all?
The argument is older than most product teams. Margarete Sandelowski titled a 2001 paper "Real qualitative researchers do not count", and then spent it showing that they do, all the time. Every time you write "most participants", "a few" or "this came up repeatedly", you have made a quantitative claim. You just haven't said what it is.
Joseph Maxwell (2010) argues for what Howard Becker called quasi-statistics: "simple counts of things to make statements such as 'some,' 'usually,' and 'most' more precise." The case for it is practical. Vague quantifiers mean different things to different readers, and stakeholders will fill in the gap with whatever supports the decision they already wanted.
The case against is also real. Counts invite readers to treat interviews like a survey. A theme that 8 of 12 people mentioned is not "67% of customers". The sample was chosen to be informative, not representative, and the interview was shaped by what you asked.
The working answer: count to be precise about your sample, never to generalise beyond it.
The five levels of quantification
Not all counting is the same. Each level answers a different question, and each needs more care than the last.
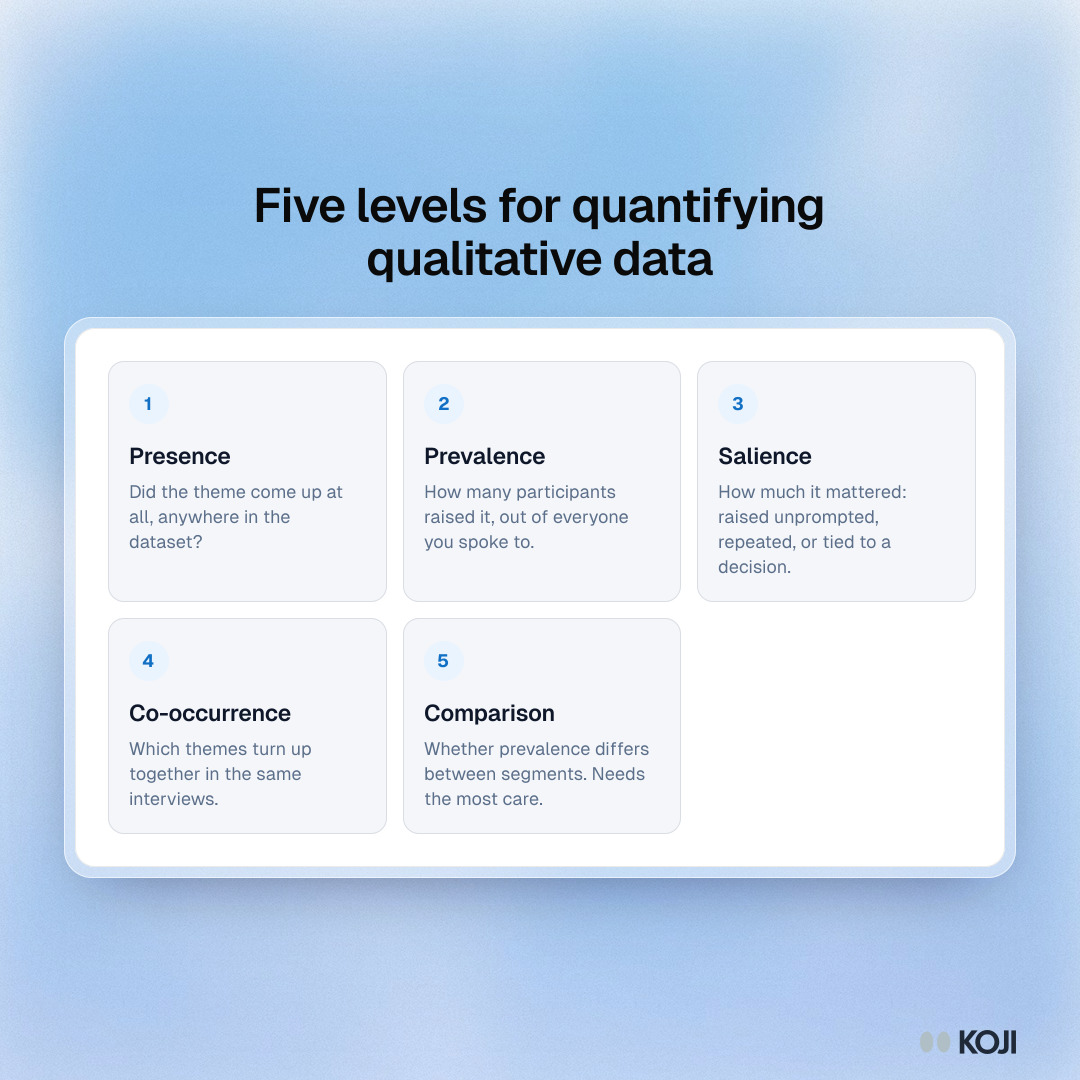
- Presence. Did this theme come up at all? Yes or no, across the dataset. Useful for discovery: "Nobody mentioned price" or "Three distinct workarounds appeared."
- Prevalence. How many participants raised it? The count of people, out of everyone you spoke to. This is the level most reports need.
- Salience. How much did it matter to the people who raised it? Did they bring it up unprompted, return to it, or tie it to a decision such as cancelling? A theme five people mentioned in passing may matter less than one that two people built their whole story around.
- Co-occurrence. Which themes show up in the same interviews? If everyone who mentions slow onboarding also mentions a missing integration, those may be one problem, not two.
- Comparison. Does prevalence differ between segments, such as new vs long-term customers, or admins vs end users? This is where small samples fail fastest, because each segment is smaller than the whole.
How to quantify qualitative data, step by step
1. Code first, count second
You cannot count themes you have not defined. Code the transcripts first (see coding qualitative data), group the codes into themes, and write a one-line definition for each theme: what counts and what doesn't. Without definitions, two people will count the same transcripts differently.
2. Decide your unit: people, not mentions
Count the number of participants who raised a theme, not the number of times it was said. One talkative participant who complains about export five times is one data point. Counting mentions rewards whoever talked longest.
3. Build a participant-by-theme matrix
Put participants in rows and themes in columns. Mark each cell 1 if that person raised the theme and 0 if not. Add columns for the segment each person belongs to and a note on whether they raised the theme unprompted or after you asked.

Photo by Andreea Avramescu on Unsplash
That one table gives you prevalence (column totals), co-occurrence (pairs of columns), and segment comparison (filter by segment). It is also easy to check: anyone can open a cell and look at the quote behind it.
4. Separate prompted from unprompted
If your guide asked about pricing, then "10 of 12 talked about pricing" tells you very little. Everyone was asked. Report prompted and unprompted mentions separately, or report only what people raised on their own for themes you asked about directly.
5. Add the uncertainty
A count from 12 people has a wide margin around it. If 5 of 12 participants raised a theme, that is 42% of your sample, but a standard 95% interval (the adjusted Wald method) runs from about 19% to 68%. With 9 of 12 the interval is roughly 46% to 92%. Even the best case cannot tell you whether a theme is a slight majority or almost universal.
Zero counts need care too. Hanley and Lippman-Hand (1983) showed that if something happens in none of n cases, you can be 95% confident its true rate is no more than about 3 in n. So "no one of 12 mentioned it" still allows a rate of up to roughly 25%. Absence in a small sample is weak evidence of absence. The theme detection limit guide covers this in more depth.
6. Check that the sample can support the claim
Counts are only as good as the set of interviews behind them. Hennink, Kaiser and Marconi (2017) found that in 25 interviews, the range of themes was identified by about interview 9, but a full understanding of those themes took 16 to 24 interviews. Squire and colleagues (2024) looked at five studies and found that near saturation came after 33% to 60% of the planned interviews, while true saturation needed 91% to 100%. If you stop early, your counts for rarer themes will be unstable, even if your list of themes looks complete.
How to report counts without overclaiming
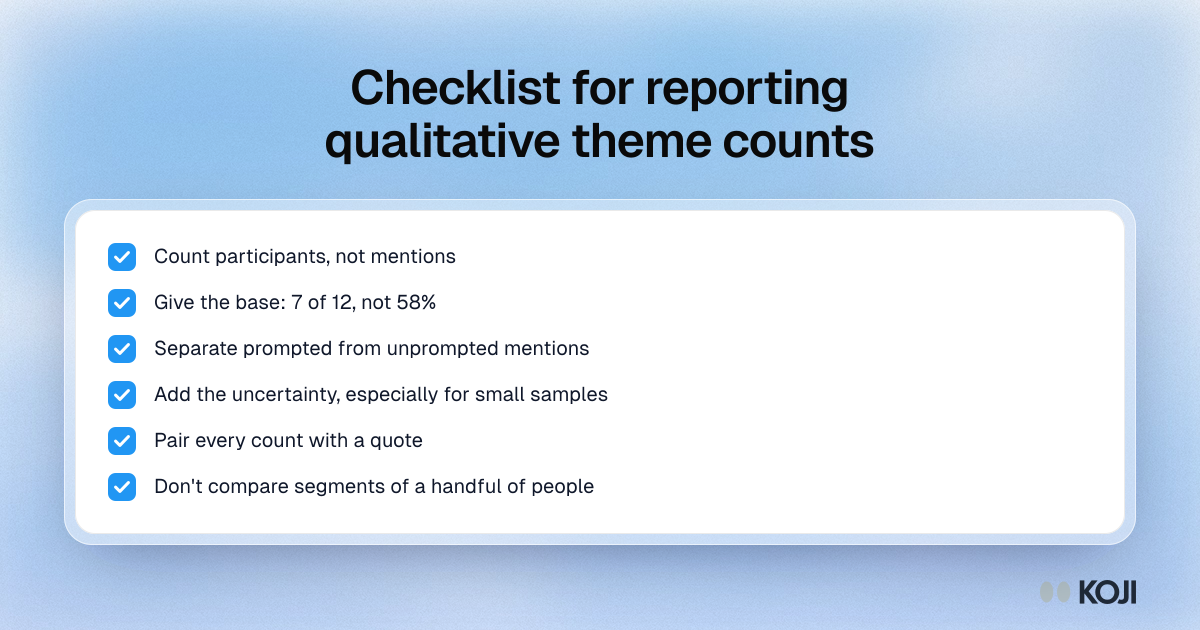
- Always give the base. "7 of 12 participants" is honest. "58%" alone is not, because it hides how small the sample was.
- Prefer counts to percentages under about 20 participants. A percentage implies precision you don't have.
- Say who you asked. "7 of 12 admins we recruited from churned accounts" tells the reader what the number can and cannot mean.
- Pair every count with a quote. The number tells people how widespread a theme was in your sample. The quote tells them what it was.
- Rank with care. If theme A was raised by 6 people and theme B by 5, you do not know that A is more common. Group themes into rough bands ("most", "about half", "a few") with counts in brackets.
- Don't compare tiny segments. 3 of 4 enterprise customers vs 2 of 8 SMB customers looks like a big difference. It is four people versus eight.
When to switch to a survey
Counting interviews tells you what is present and roughly how widespread it is among the people you spoke to. If the decision depends on how common something is across your whole customer base, you need a different method: a survey or structured questions answered by a larger, better-sampled group. A common sequence is interviews to find the themes, then a short survey to measure them. The interviews tell you what options to put in the survey; the survey tells you how the population splits.
Common mistakes
- Counting mentions instead of people. It rewards the most talkative participants.
- Reporting percentages from small samples. "75% of users want X" from 8 interviews will be repeated in a board deck as fact.
- Ignoring how the question was asked. Prompted themes inflate counts.
- Treating silence as absence. No one mentioning something in 10 interviews does not mean nobody cares about it.
- Letting the count replace the meaning. A theme raised by two people who both cancelled because of it may matter more than one raised by ten who shrugged.
How Koji helps
Koji runs AI-moderated interviews and builds the analysis as interviews come in, with counting built on the right unit.
Themes are counted by interviews, not mentions. Koji's report groups related phrasings into themes and counts the number of interviews that mention each one, so one talkative participant cannot inflate a theme.
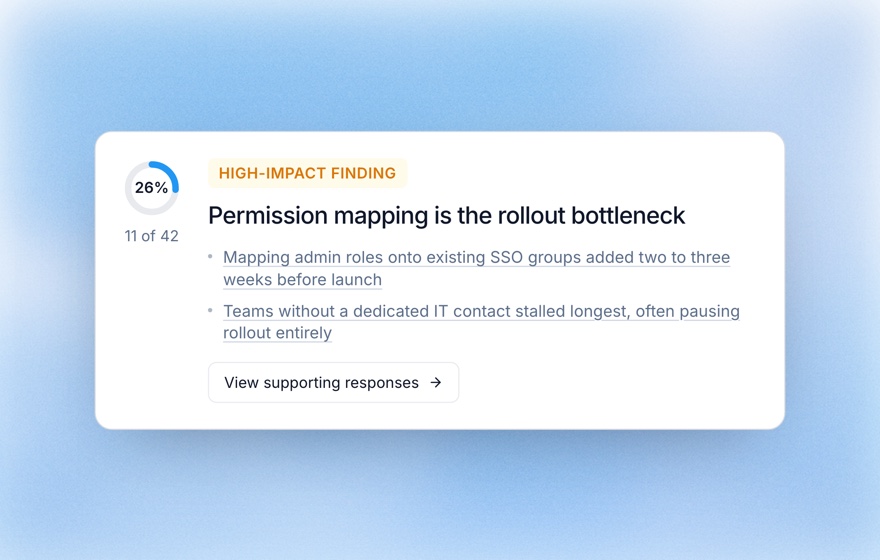
Every number links to the evidence. Findings show how many participants support them, as a share and as a count, with a button to view the supporting responses. The quotes shown are checked against the transcript, so a reader can open any count and see the people behind it.
Structured questions give you real counts where you need them. When you know in advance that you need a number, add a structured question such as a scale, single choice or ranking to the interview. Koji asks it conversationally and charts the answers in the report, while the open-ended questions around it explain the why. That avoids the problem of counting a theme you only asked some people about.
Larger samples are practical. Participants take the interview by voice or text whenever it suits them, so a few dozen interviews does not mean a few dozen calendar slots for a moderator. You can set a response limit so the study closes itself at the size you planned.
The judgement is still yours. Koji counts consistently; it cannot tell you whether 9 of 30 is a big deal for your decision. That part of quantifying qualitative data stays with the researcher.
Related Resources
- Structured questions guide
- Theme detection limit vs quantification
- Coding qualitative data
- Thematic analysis guide
- Confidence intervals for small UX samples
- How many interviews are enough?
Sources
- Sandelowski, M. (2001). Real qualitative researchers do not count: The use of numbers in qualitative research. Research in Nursing & Health, 24(3), 230–240.
- Maxwell, J. A. (2010). Using numbers in qualitative research. Qualitative Inquiry, 16(6), 475–482.
- Hennink, M. M., Kaiser, B. N., & Marconi, V. C. (2017). Code saturation versus meaning saturation: How many interviews are enough? Qualitative Health Research, 27(4), 591–608.
- Squire, C. M., Giombi, K. C., Rupert, D. J., Amoozegar, J., & Williams, P. (2024). Determining an appropriate sample size for qualitative interviews to achieve true and near code saturation: Secondary analysis of data. Journal of Medical Internet Research, 26, e52998.
- Hanley, J. A., & Lippman-Hand, A. (1983). If nothing goes wrong, is everything all right? Interpreting zero numerators. JAMA, 249(13), 1743–1745.
- Agresti, A., & Coull, B. A. (1998). Approximate is better than "exact" for interval estimation of binomial proportions. The American Statistician, 52(2), 119–126.
Related Articles
How to Code Qualitative Data: A Step-by-Step Guide
Learn the complete process of qualitative coding — from building a codebook to identifying themes — and how AI tools like Koji automate the most time-consuming parts.
Confidence Intervals for Small-Sample UX Research: Completion Rates, Ratings and Task Times
How to put confidence intervals around UX metrics from 5 to 20 participants: the adjusted Wald interval for completion rates, t-intervals for rating scales, and log-transformed intervals with the geometric mean for task times, with worked examples.
How Many Interviews Are Enough? A Guide to Sample Size
Understand saturation, practical guidelines, and research-backed recommendations for qualitative sample sizes.
Structured Questions in AI Interviews
Mix quantitative data collection — scales, ratings, multiple choice, ranking — with AI-powered conversational follow-up in a single interview.
The Complete Guide to Thematic Analysis
Learn how to systematically analyze qualitative data using Braun and Clarke's six-phase thematic analysis framework.
The Theme Is Real and the Percentage Is Noise: Detection vs Quantification Limits (2026)
Finding a theme and measuring how common it is are two different instruments with two different thresholds. Analytical chemistry separates them formally, and qualitative research should too.