Free to save and share

Frameworks and cheat sheets for customer research

Every framework, checklist and comparison from our guides, as an image you can download, drop into a deck or share with your team.
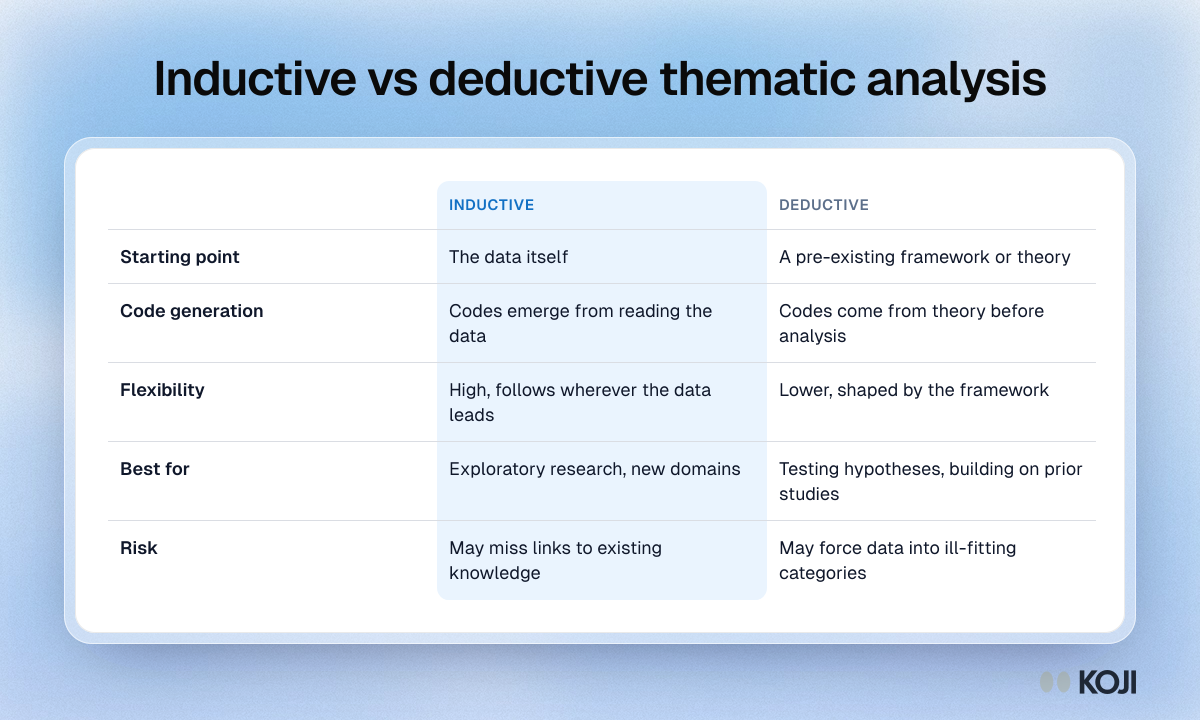
Table comparing inductive and deductive thematic analysis on starting point, code generation, flexibility, best use and risk.

Reference table

Inductive vs deductive thematic analysis
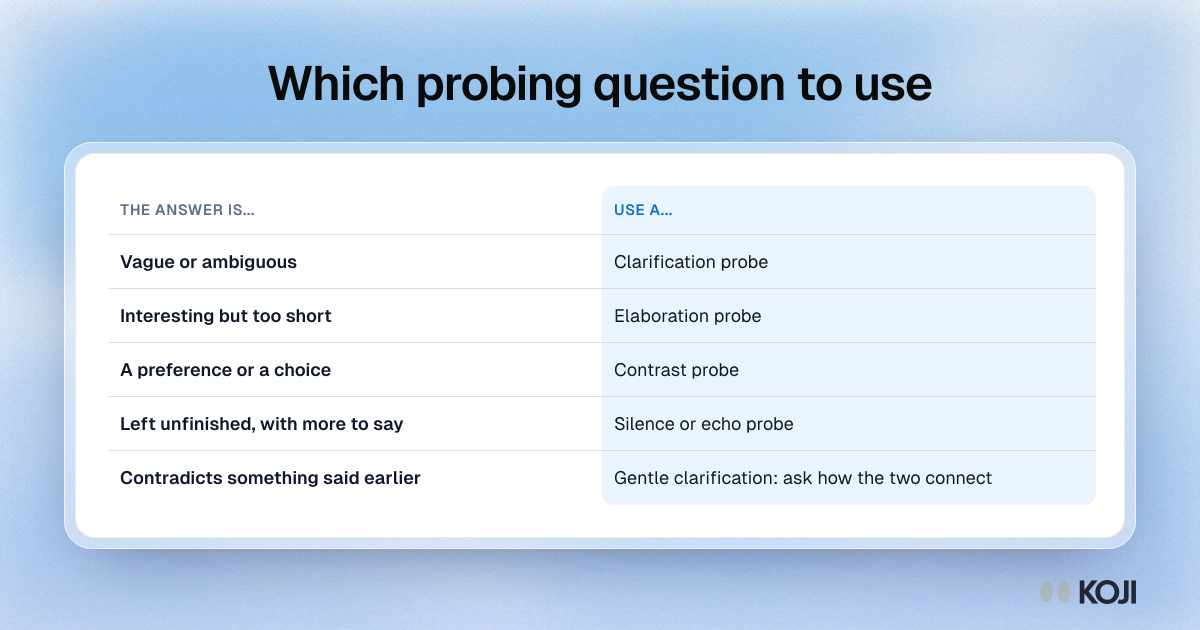
Table matching the kind of interview answer to the probe to use: clarification, elaboration, contrast, silence, echo or a gentle check on contradictions.

Reference table

Which probing question to use
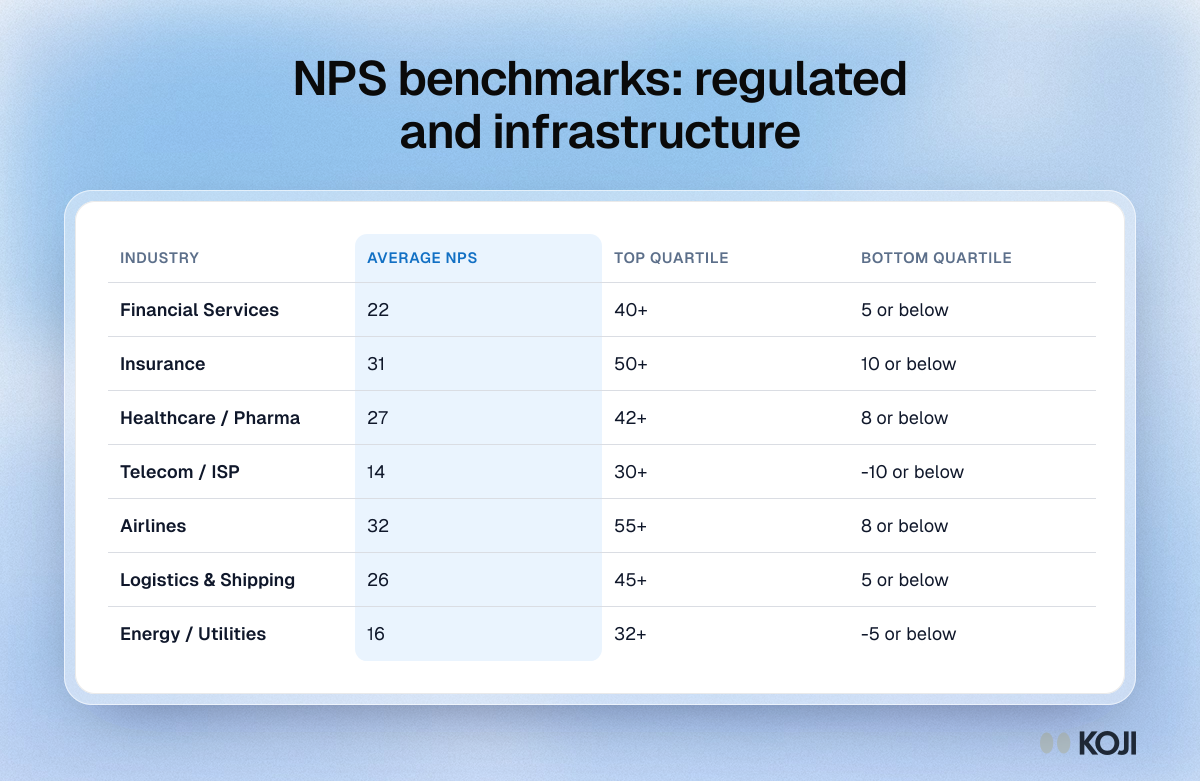
Table of 2026 NPS benchmarks for seven regulated industries, including finance, insurance, healthcare and telecom, with quartile cut-offs.

Reference table

NPS benchmarks: regulated and infrastructure
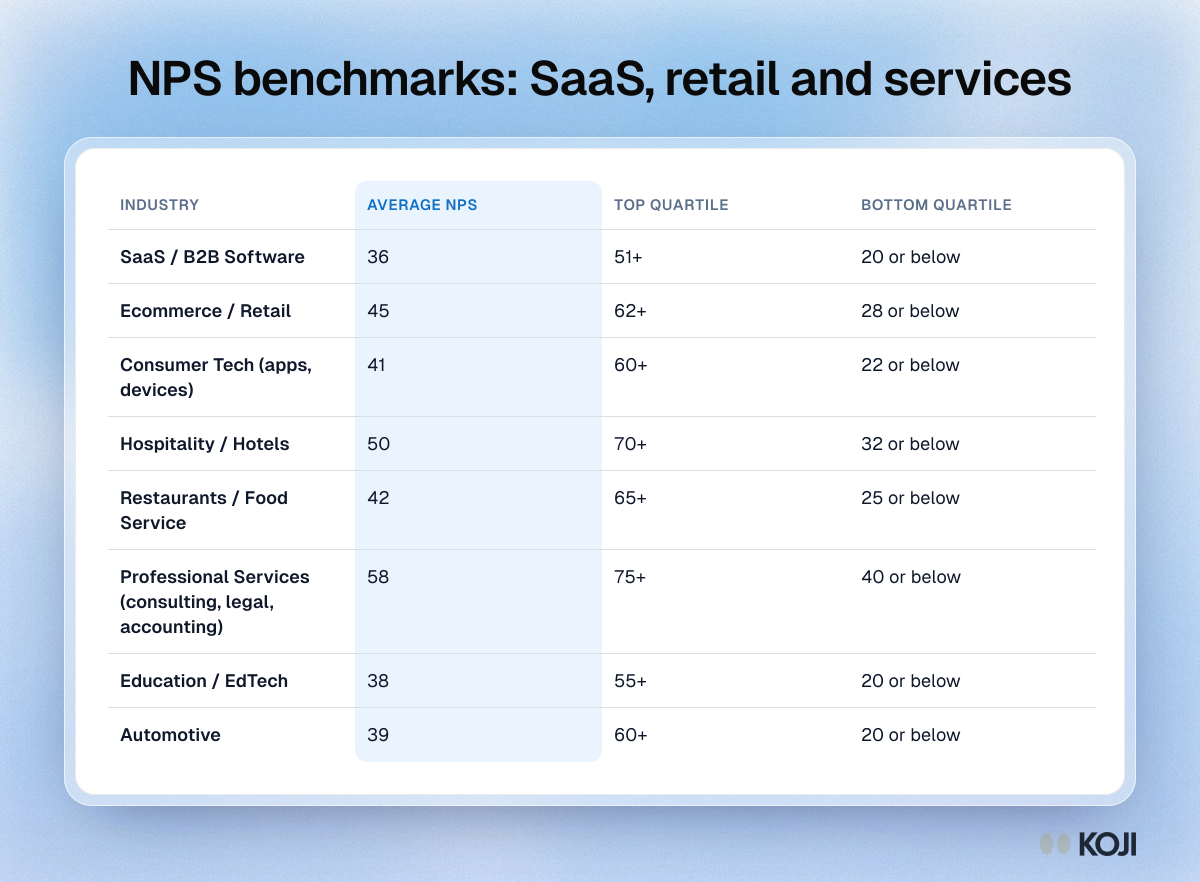
Table of 2026 NPS benchmarks for eight industries, including SaaS, ecommerce and hospitality, with average, top quartile and bottom quartile scores.

Reference table

NPS benchmarks: SaaS, retail and services
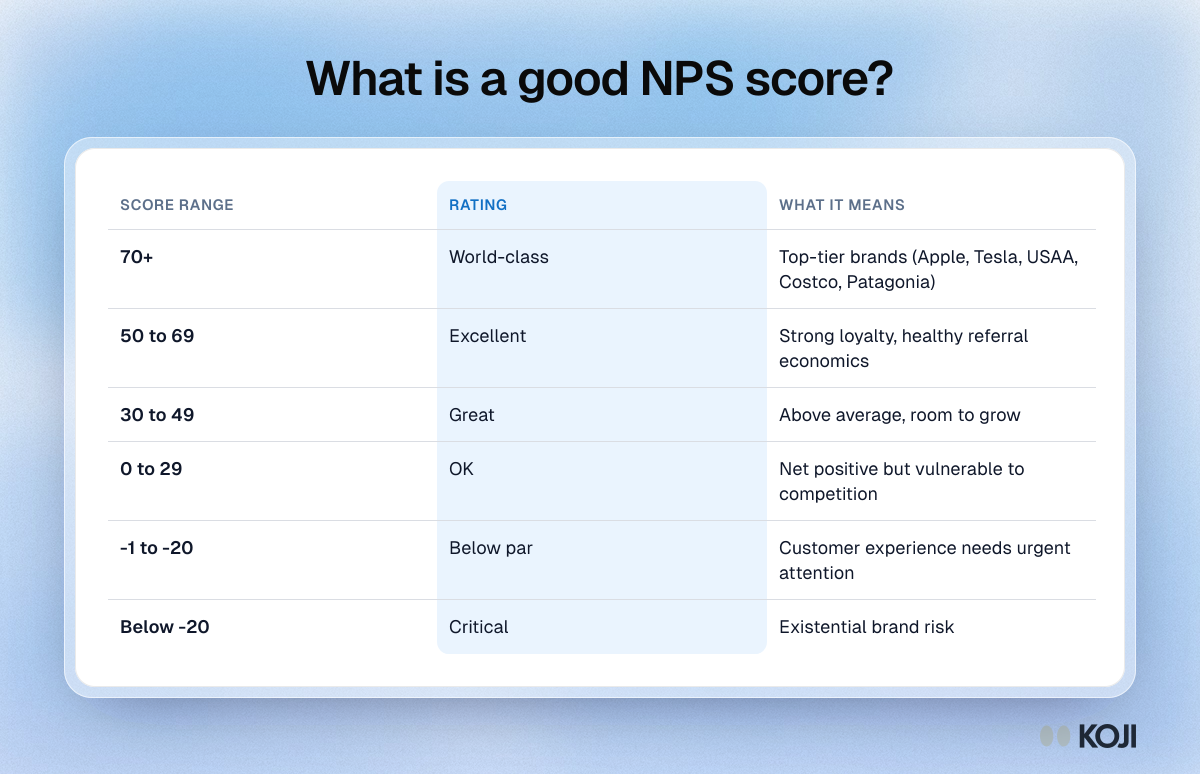
Table showing how to read a Net Promoter Score, from 70 and above rated world-class down to below minus 20 rated critical, with what each range means.

Reference table

What is a good NPS score?
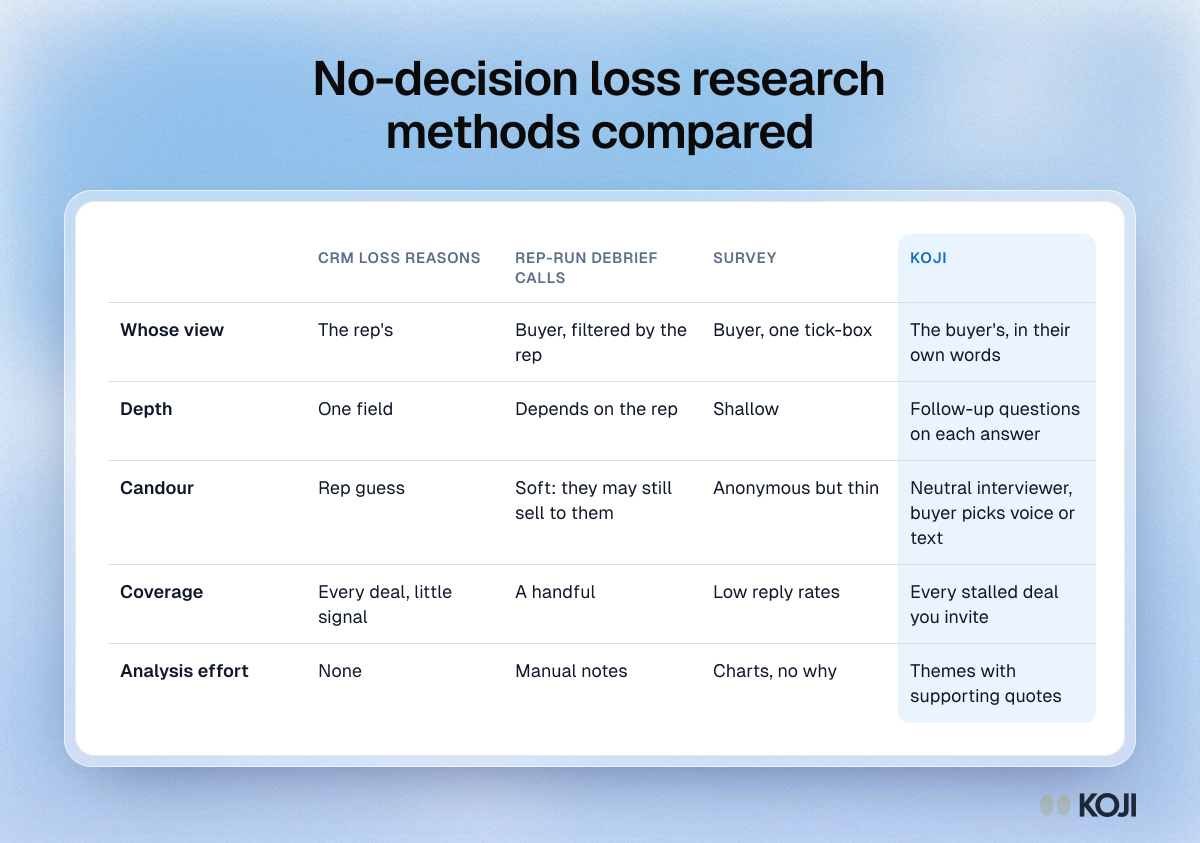
Table comparing CRM loss reasons, rep-run debrief calls, surveys and Koji for no-decision loss research on view, depth, candour, coverage and analysis effort.

Reference table

No-decision loss research methods compared
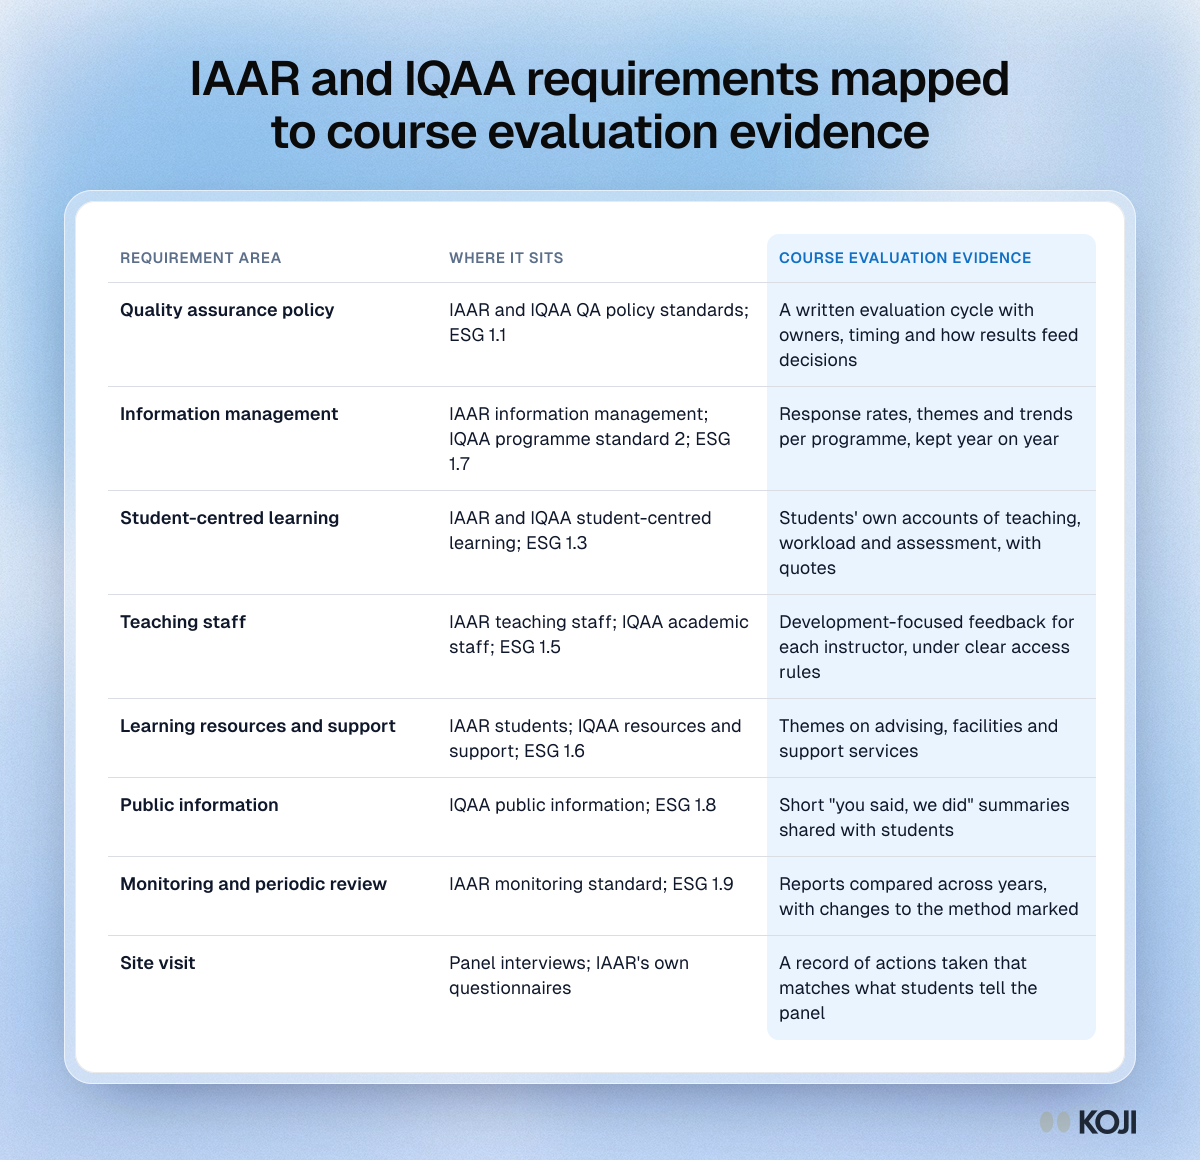
Table mapping IAAR and IQAA accreditation requirements in Kazakhstan to course evaluation evidence, from QA policy to periodic review.

Reference table

IAAR and IQAA requirements mapped to course evaluation evidence
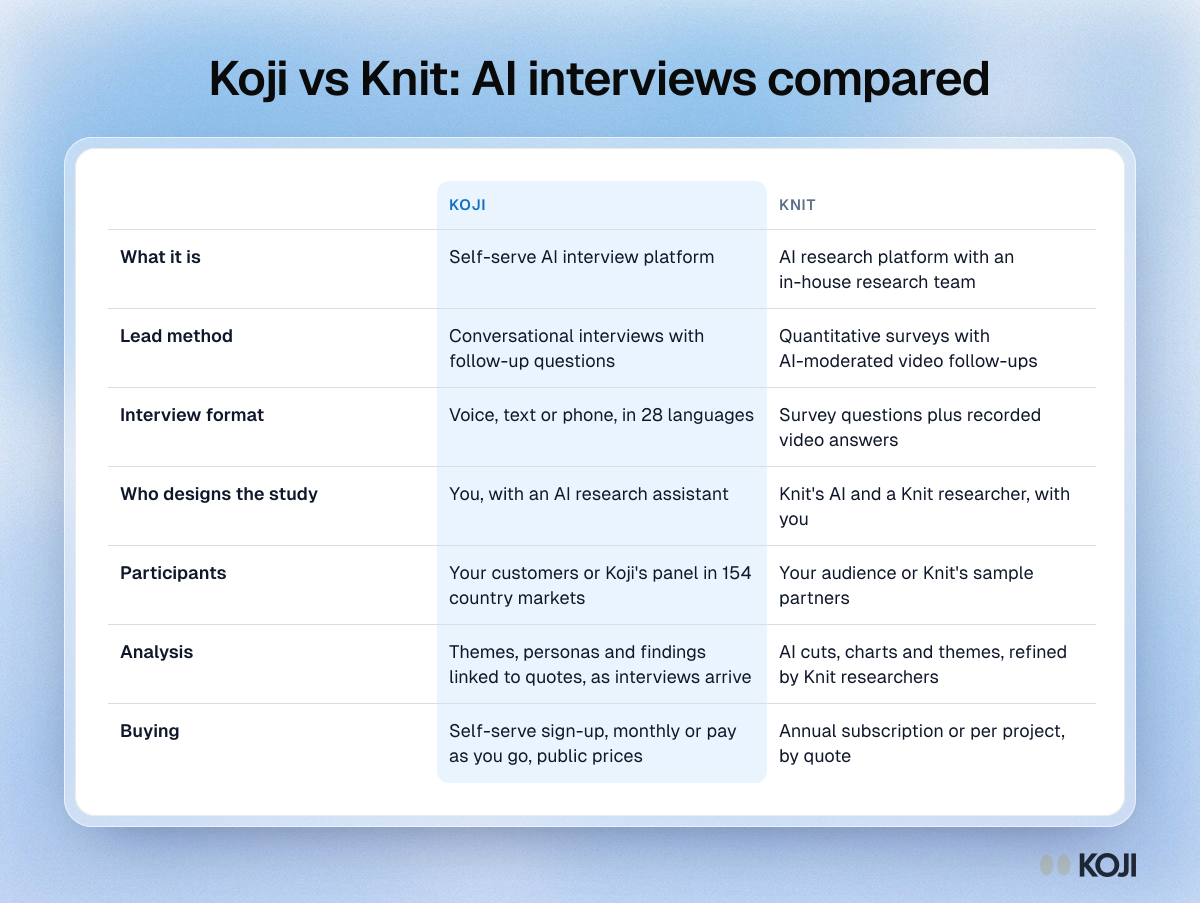
Table comparing Koji and Knit on method, interview format, study design, participants, analysis and how you buy

Reference table

Koji vs Knit: AI interviews compared
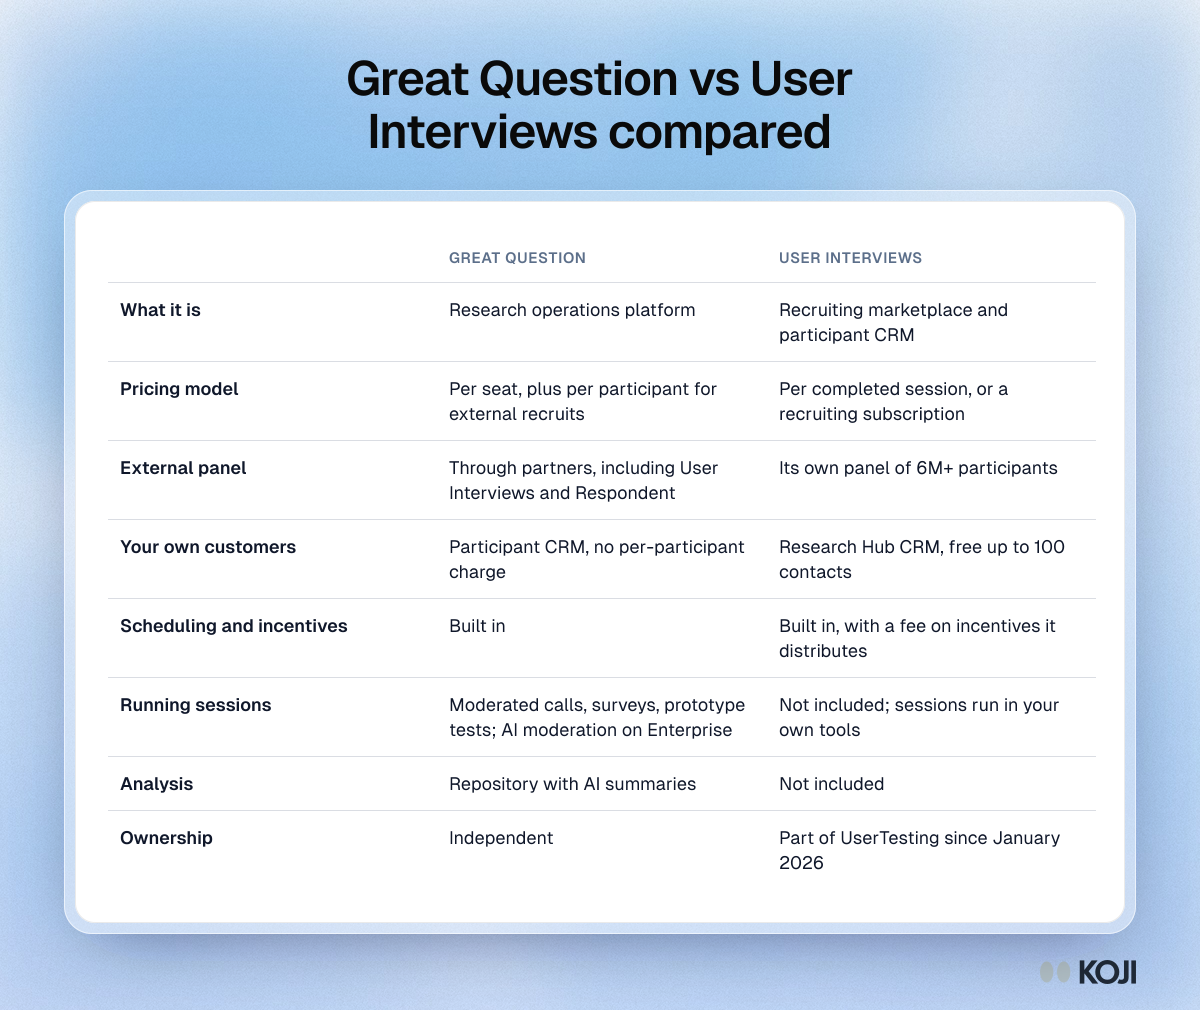
Table comparing Great Question and User Interviews on pricing model, panel access, CRM, scheduling, running sessions and analysis

Reference table

Great Question vs User Interviews compared
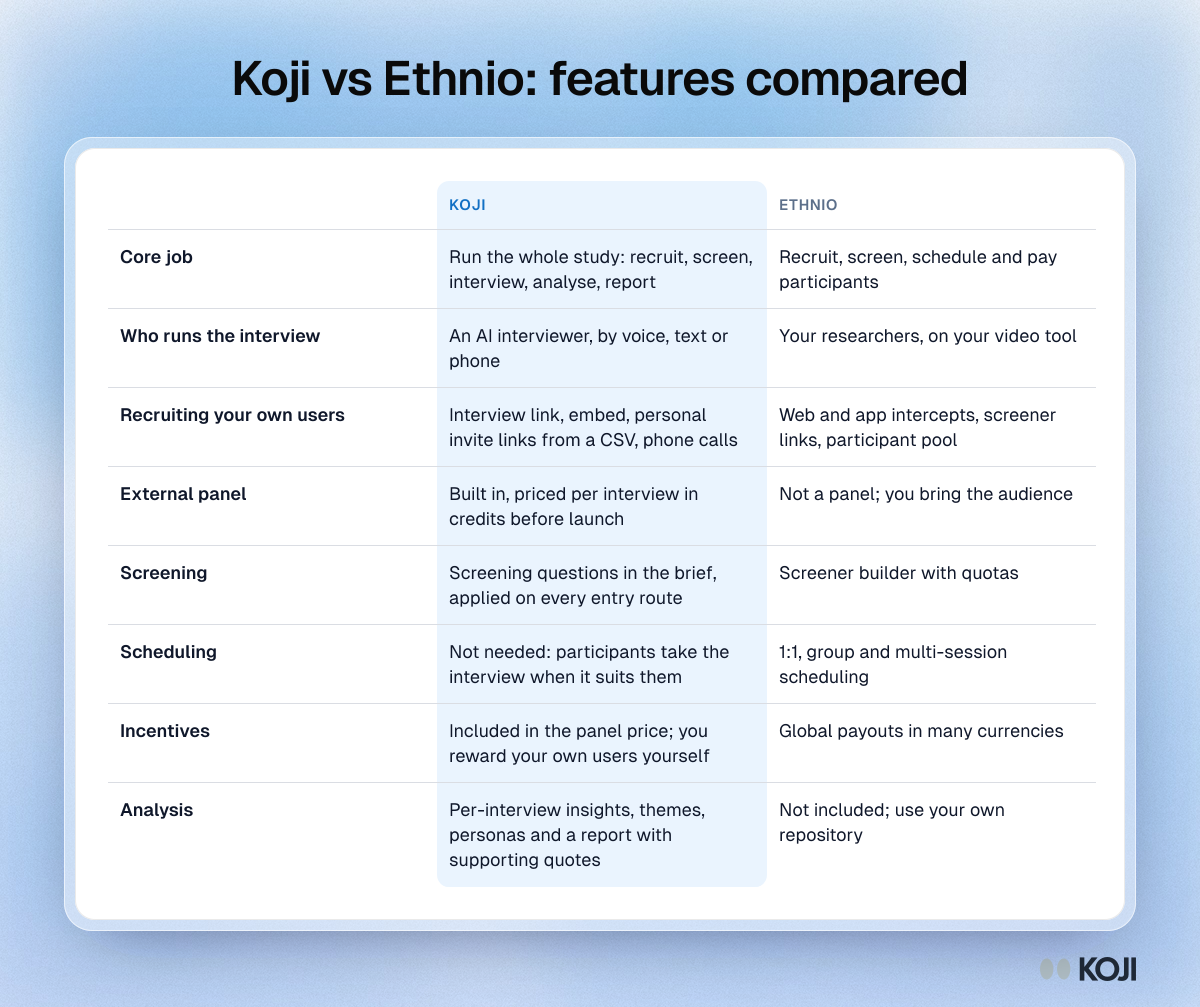
Table comparing Koji and Ethnio on core job, who runs the interview, recruiting, panel access, scheduling and analysis

Reference table

Koji vs Ethnio: features compared
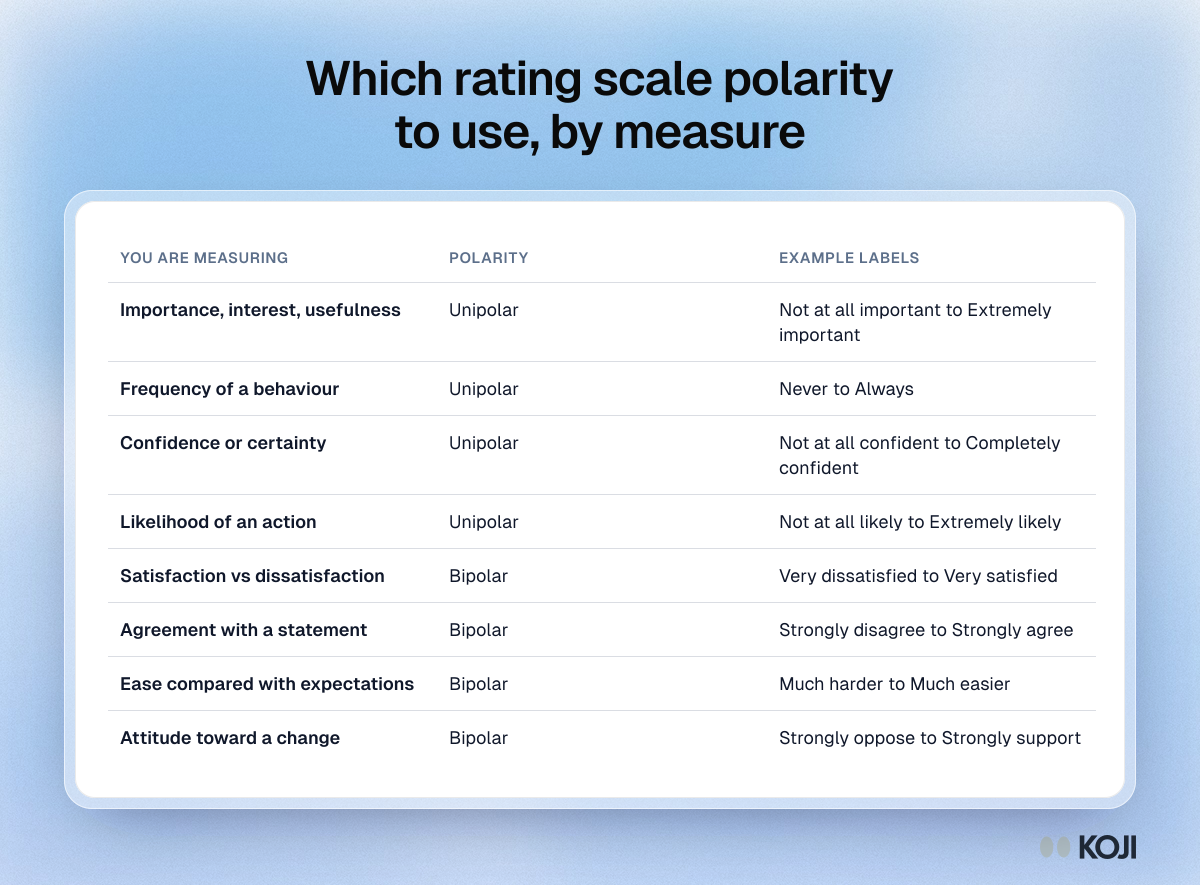
Table of common survey measures and their polarity, from importance and frequency to satisfaction and agreement, with example labels

Reference table

Which rating scale polarity to use, by measure
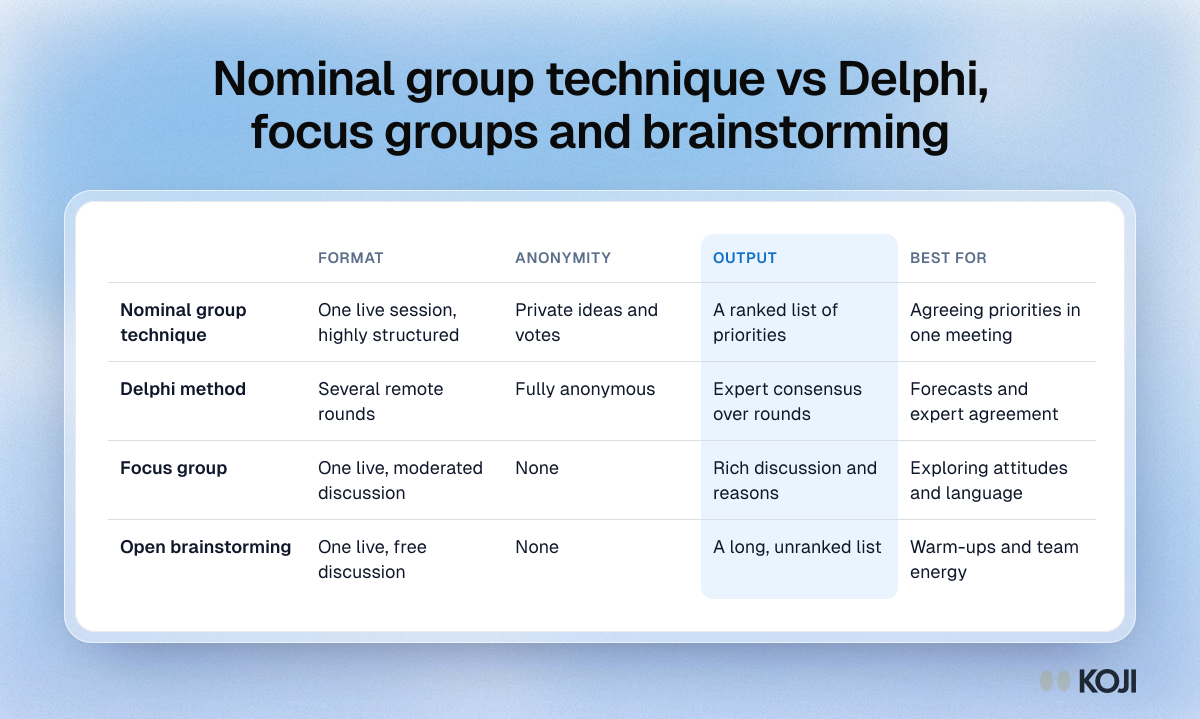
Table comparing the nominal group technique, Delphi method, focus groups and open brainstorming by format, anonymity, output and best use

Reference table

Nominal group technique vs Delphi, focus groups and brainstorming
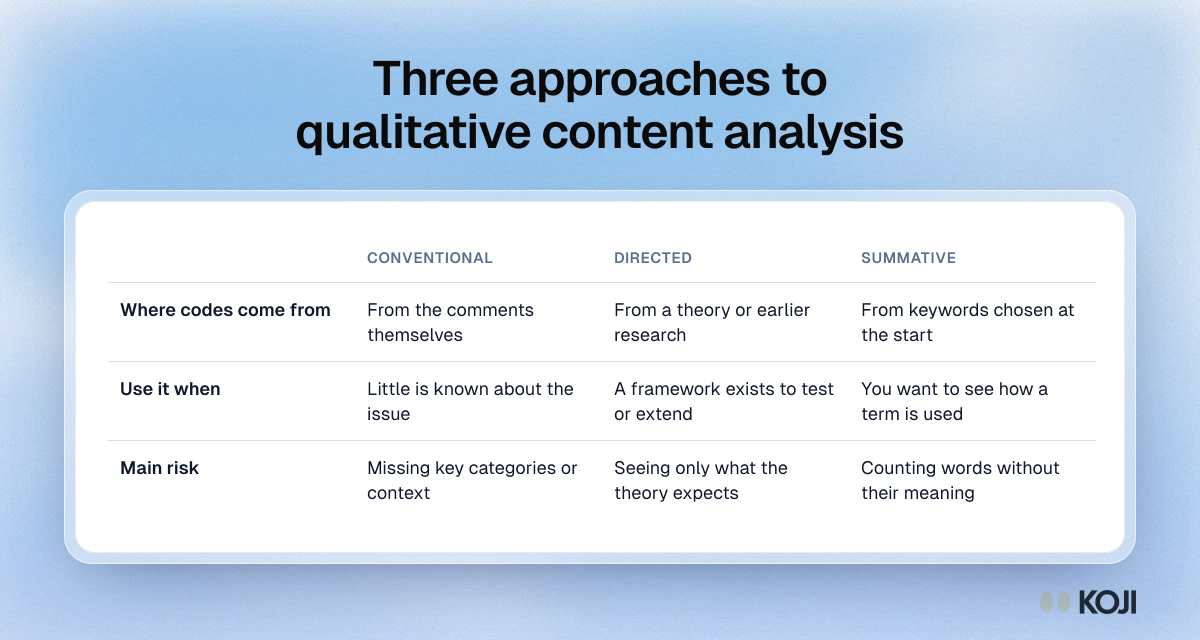
Table comparing conventional, directed and summative qualitative content analysis by where codes come from, when to use each and the main risk.

Reference table

Three approaches to qualitative content analysis
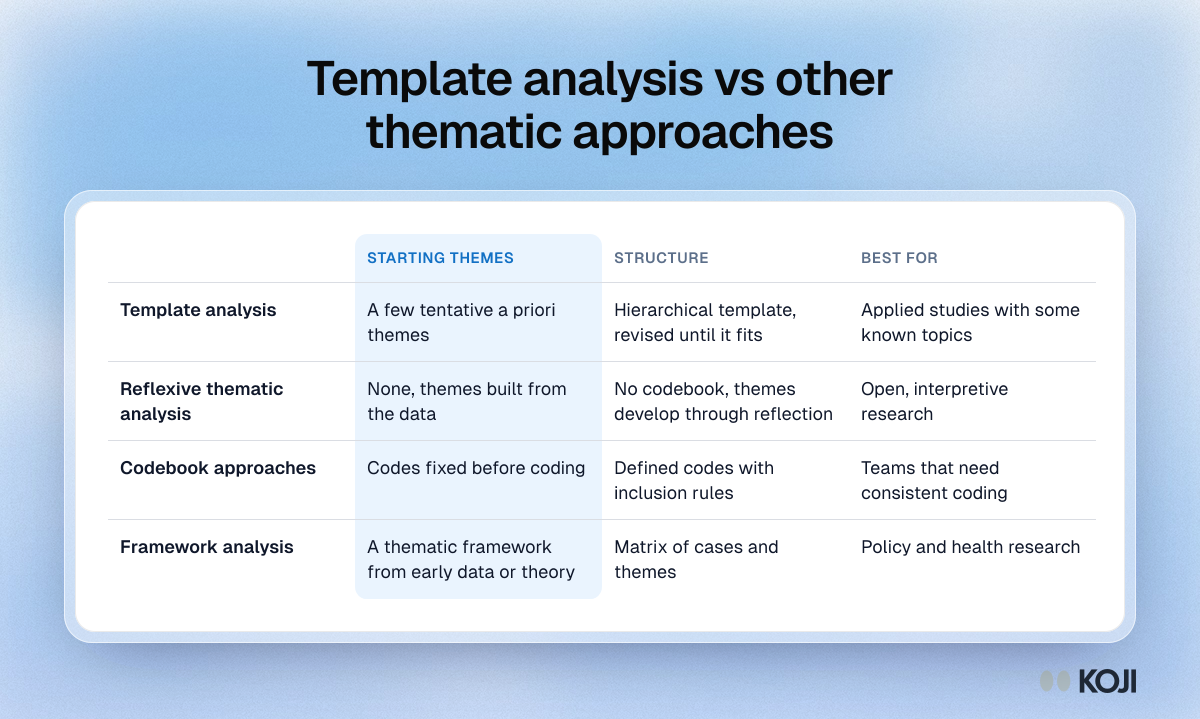
Table comparing template analysis with reflexive thematic analysis, codebook approaches and framework analysis on starting themes, structure and best use

Reference table

Template analysis vs other thematic approaches
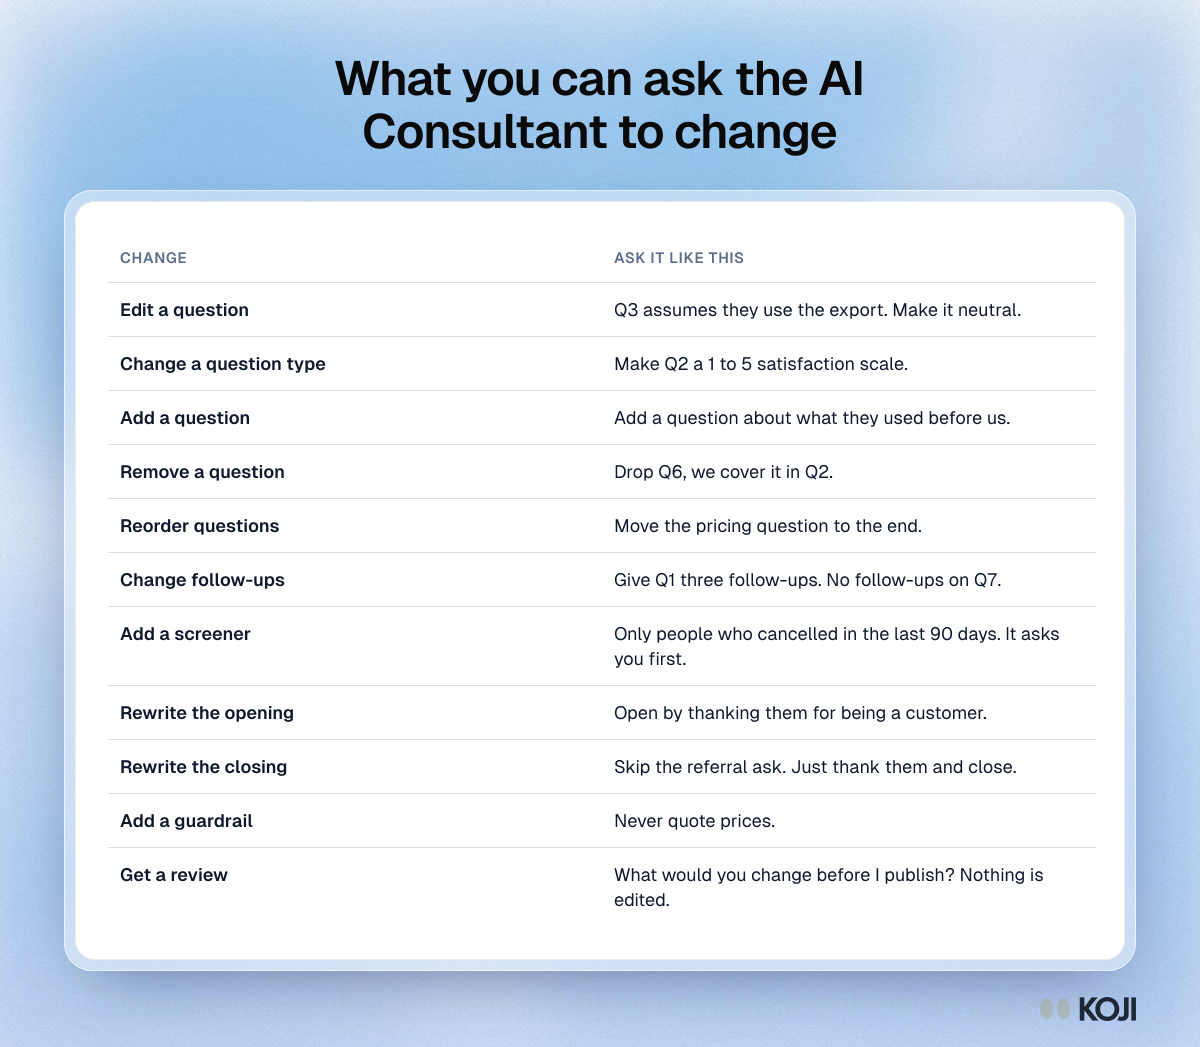
Table of changes you can ask Koji's AI Consultant to make to a research brief, with an example request for each

Reference table

What you can ask the AI Consultant to change
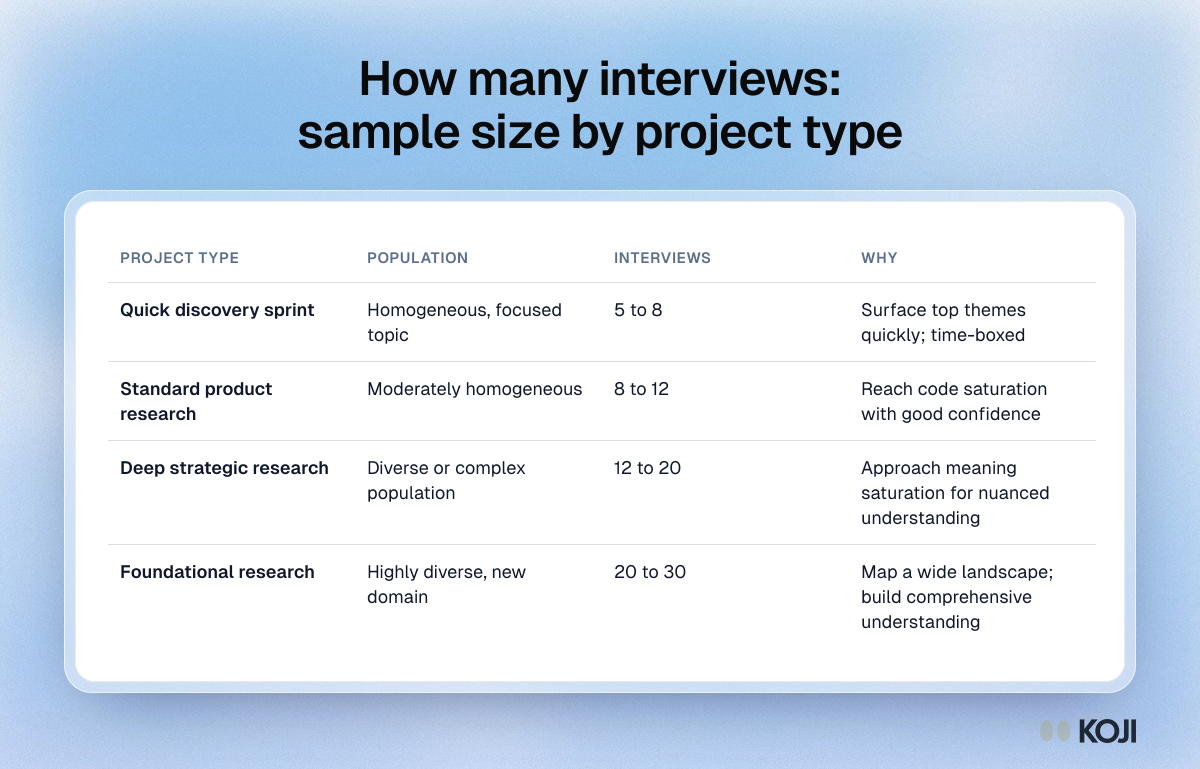
Table of interview counts by project type, from 5 to 8 for a discovery sprint to 20 to 30 for foundational research, with population and reasoning.

Reference table

How many interviews: sample size by project type
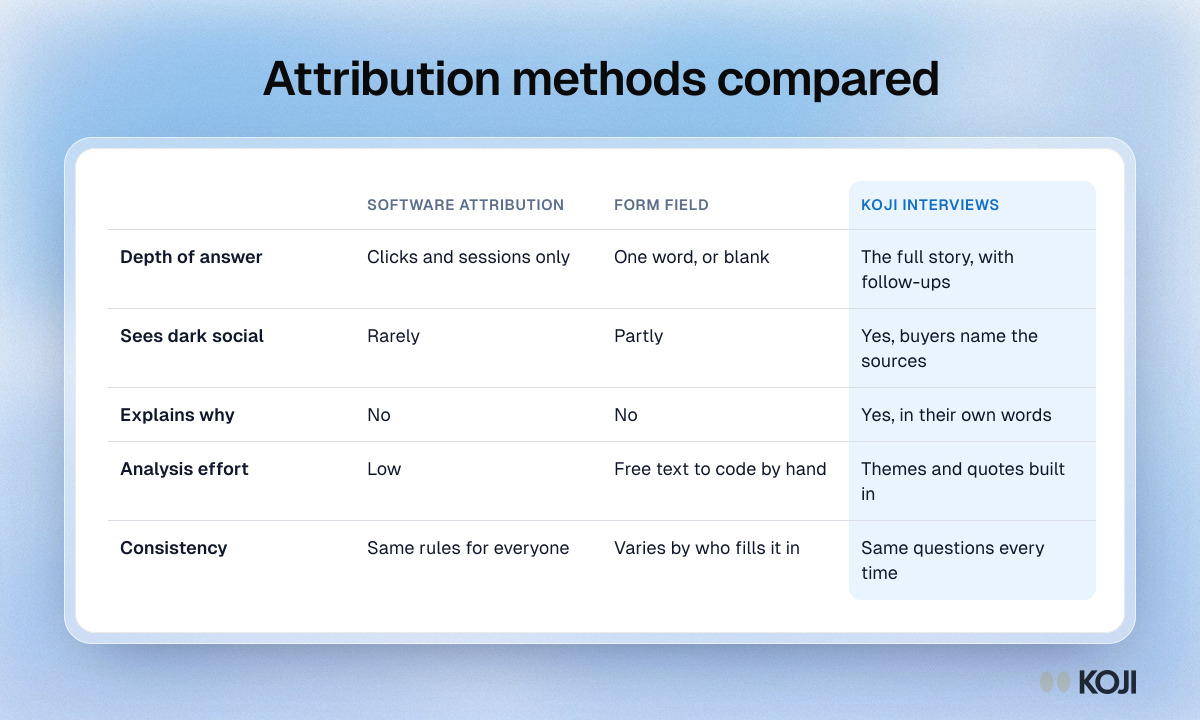
Table comparing software attribution, a form field and Koji interviews on depth, dark social, why, analysis effort and consistency.

Reference table

Attribution methods compared
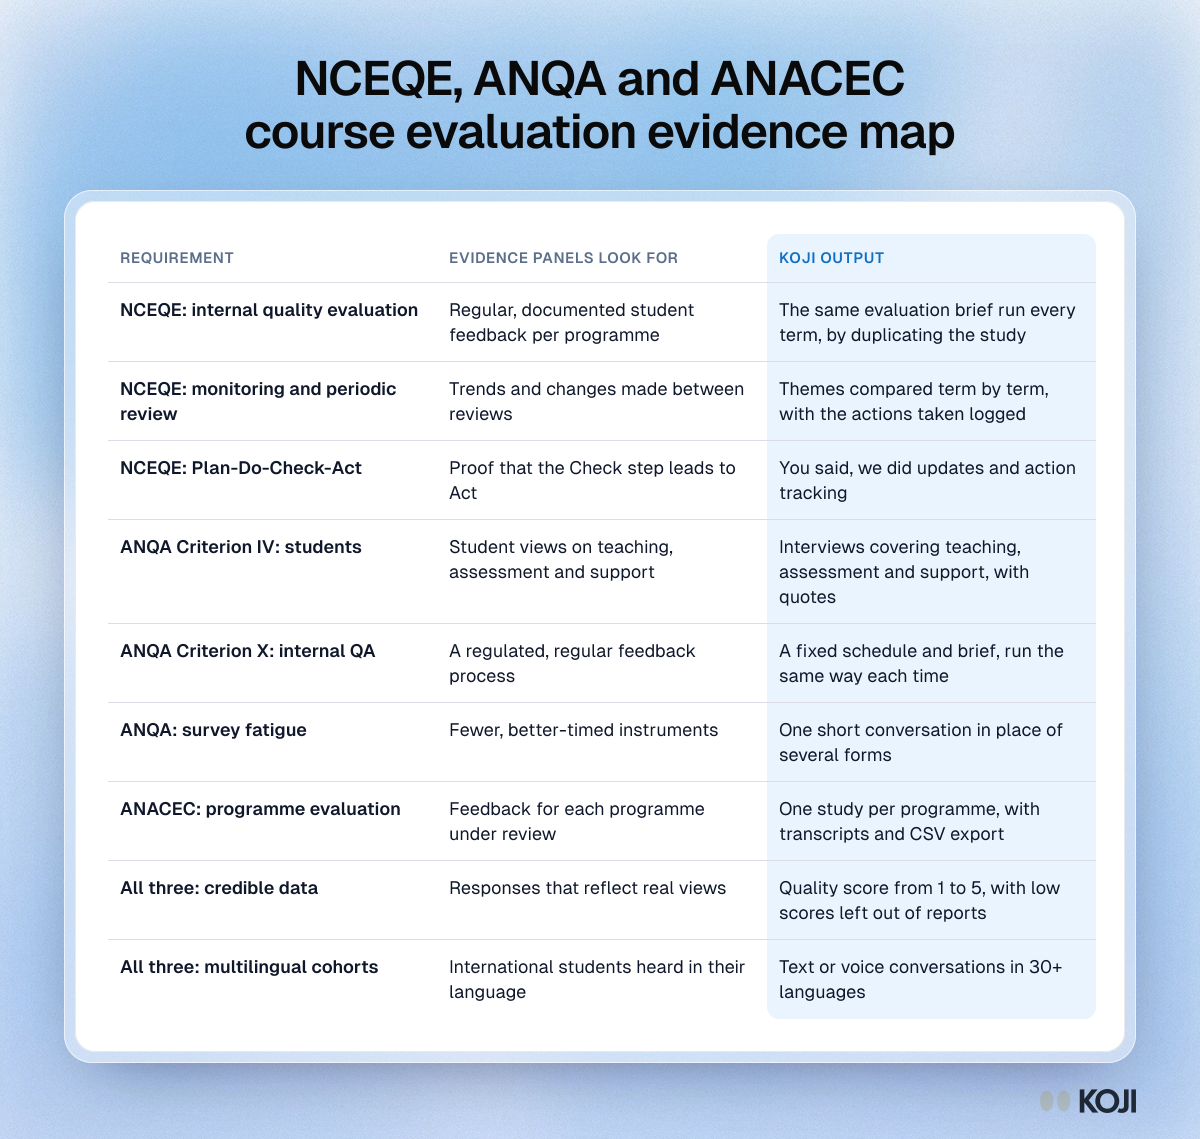
Table mapping NCEQE, ANQA and ANACEC requirements to the student feedback evidence panels look for and the matching course evaluation output.

Reference table

NCEQE, ANQA and ANACEC course evaluation evidence map
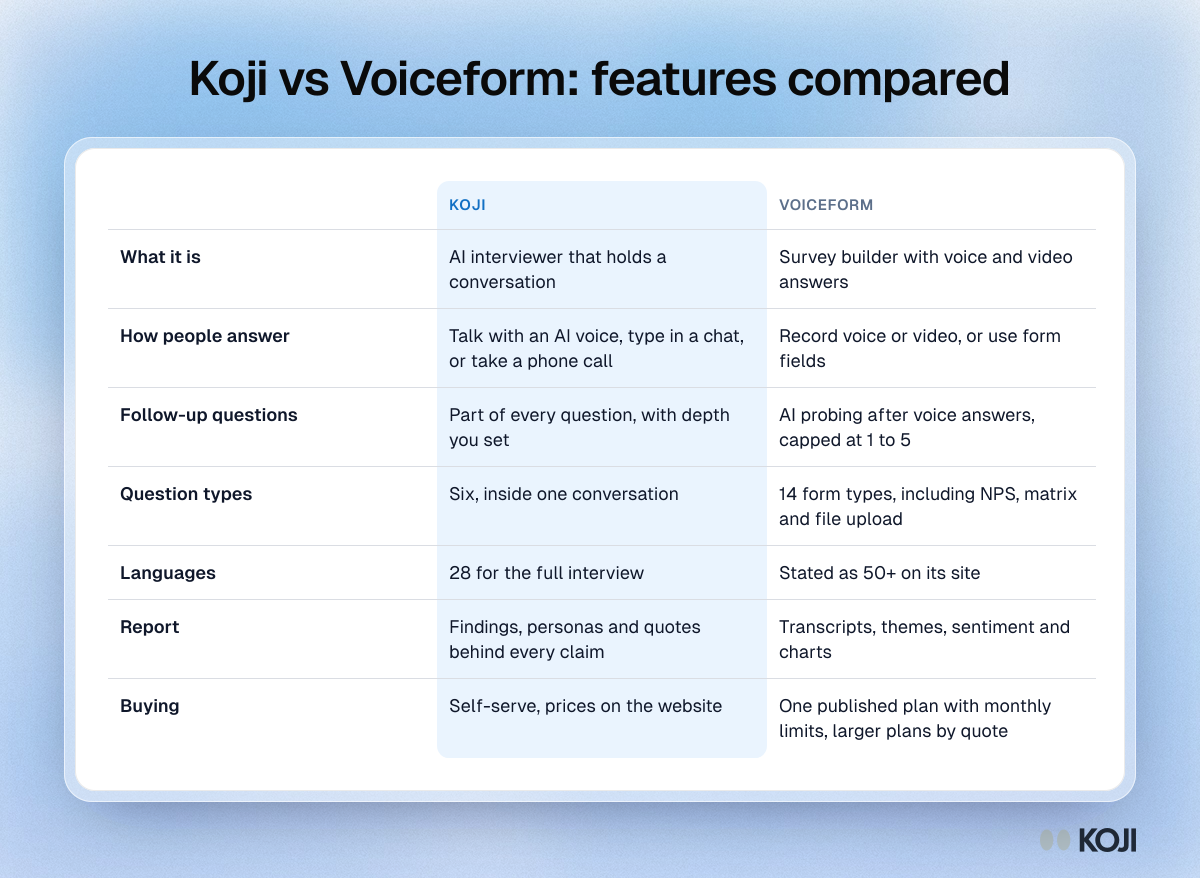
Table comparing Koji and Voiceform on what each tool is, how people answer, follow-ups, question types, languages, reports and buying

Reference table

Koji vs Voiceform: features compared
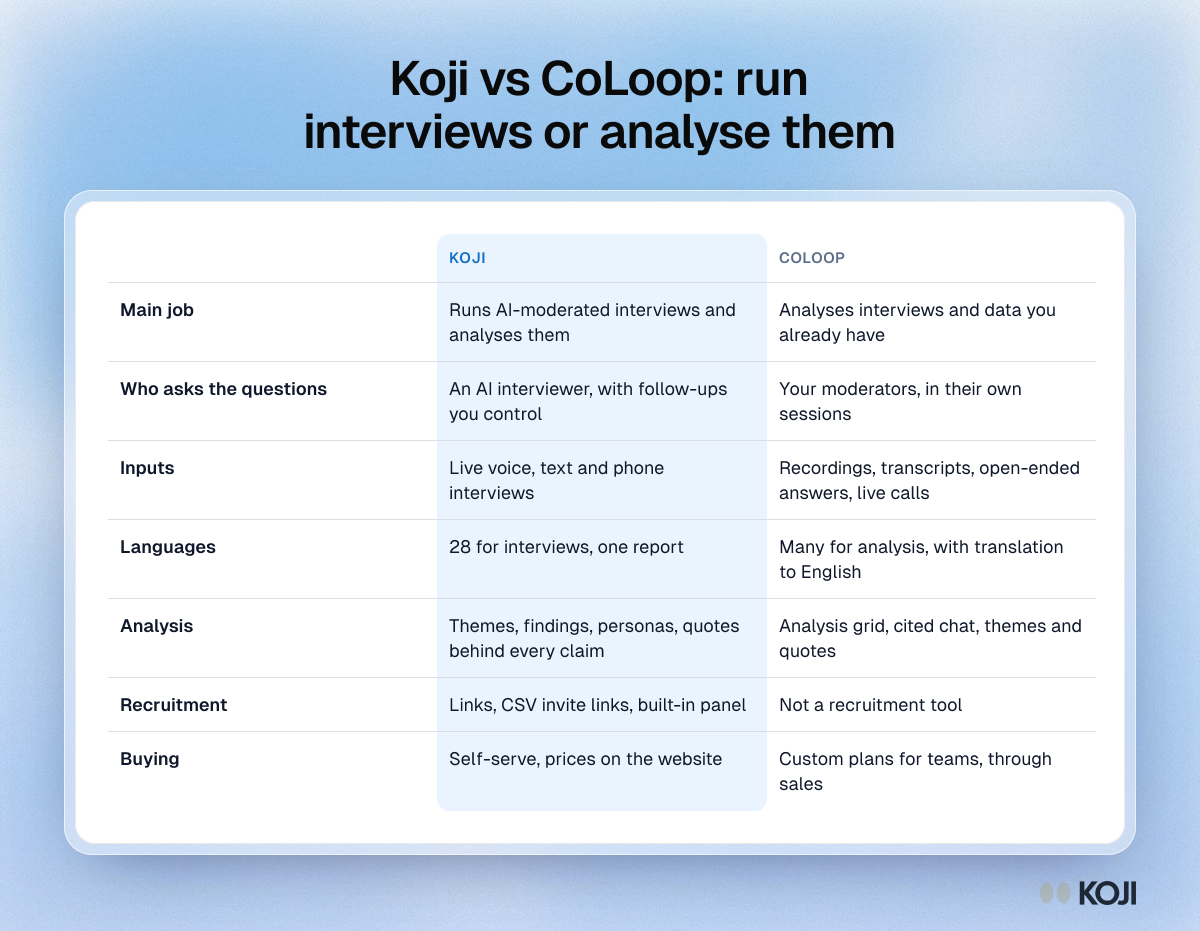
Table comparing Koji and CoLoop on main job, who asks the questions, inputs, languages, analysis, recruitment and buying

Reference table

Koji vs CoLoop: run interviews or analyse them
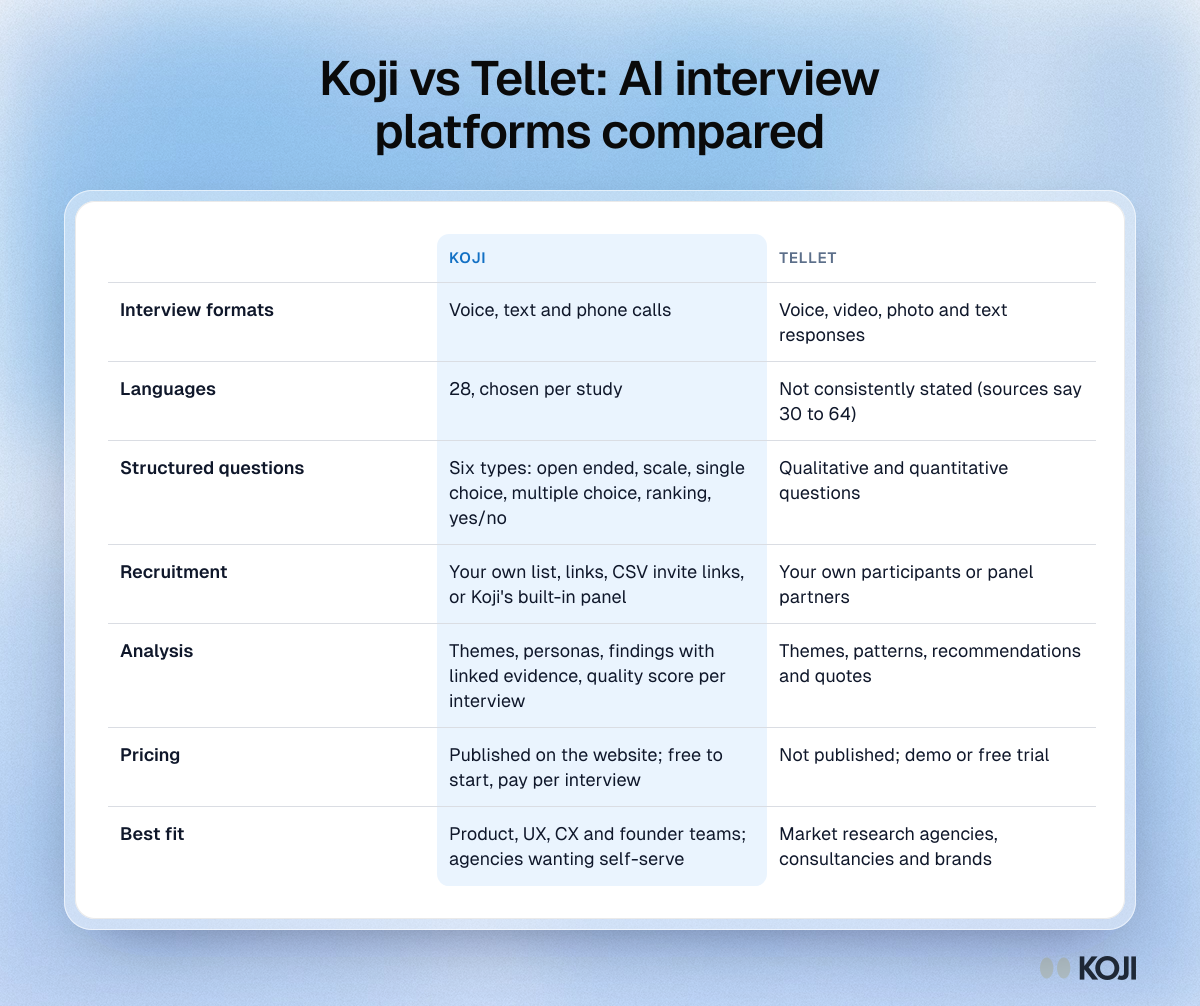
Table comparing Koji and Tellet on interview formats, languages, question types, recruitment, analysis and how each is bought

Reference table

Koji vs Tellet: AI interview platforms compared
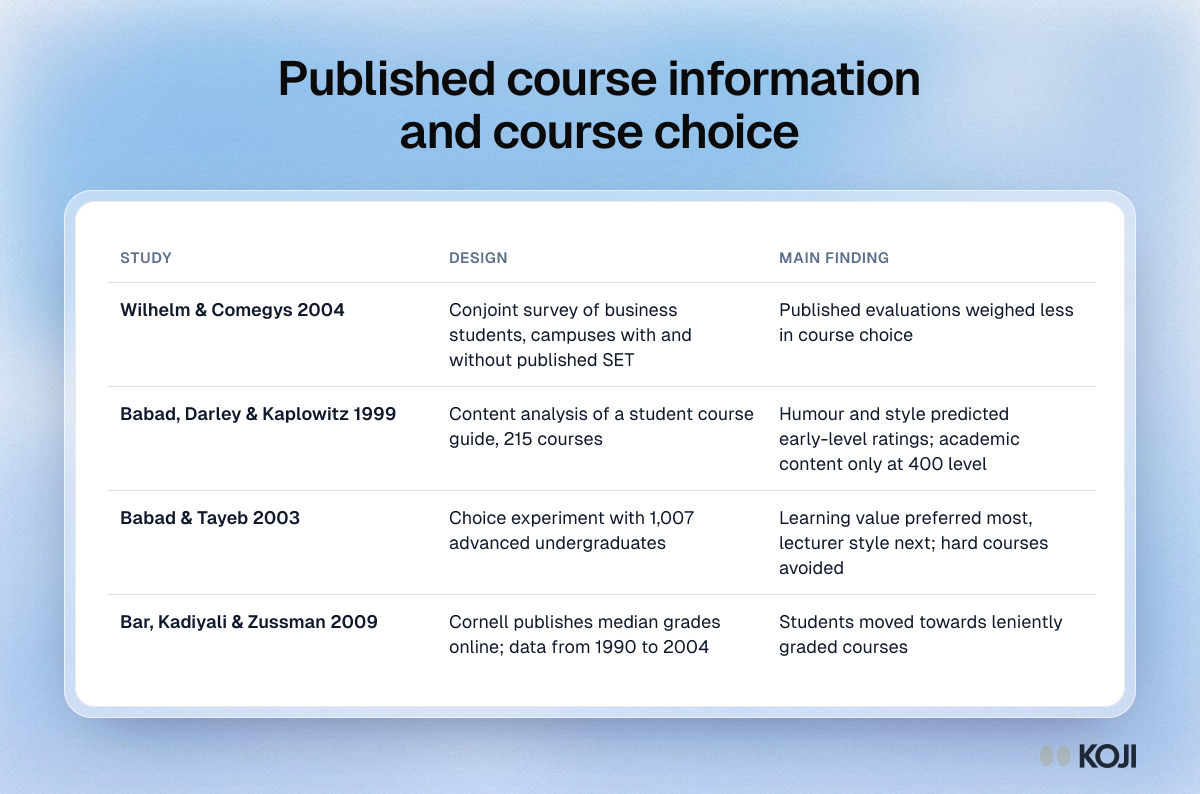
Table summarising four studies on publishing course information and how students choose courses, with design and main finding for each.

Reference table

Published course information and course choice
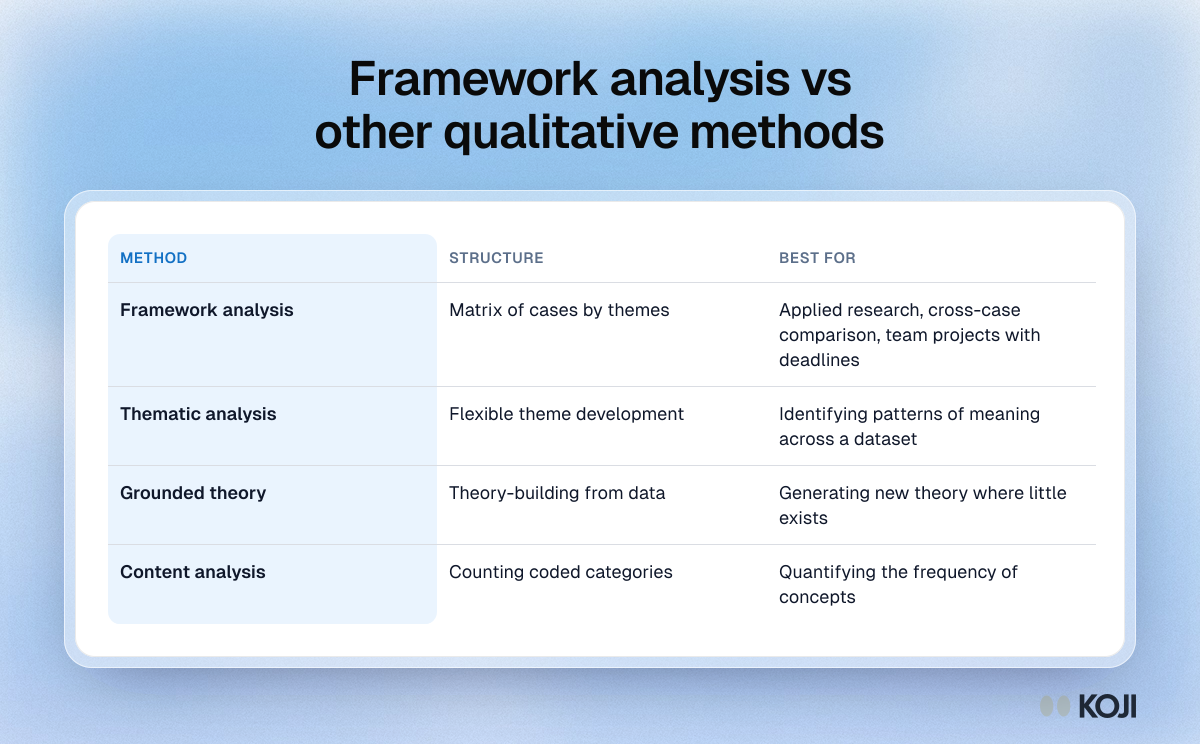
Table comparing framework analysis, thematic analysis, grounded theory and content analysis by structure and by what each method is best for.

Reference table

Framework analysis vs other qualitative methods
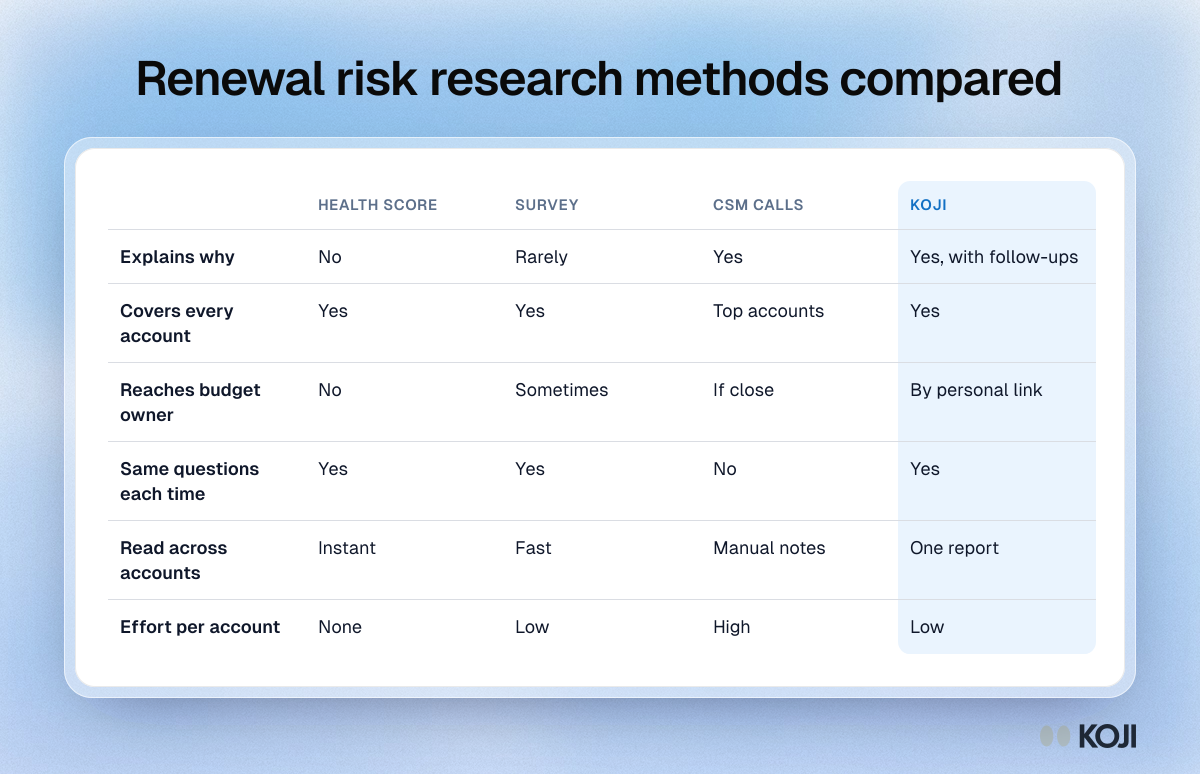
Table comparing health scores, surveys, CSM calls and Koji AI interviews for renewal risk research on explanation, coverage, consistency and effort.

Reference table

Renewal risk research methods compared
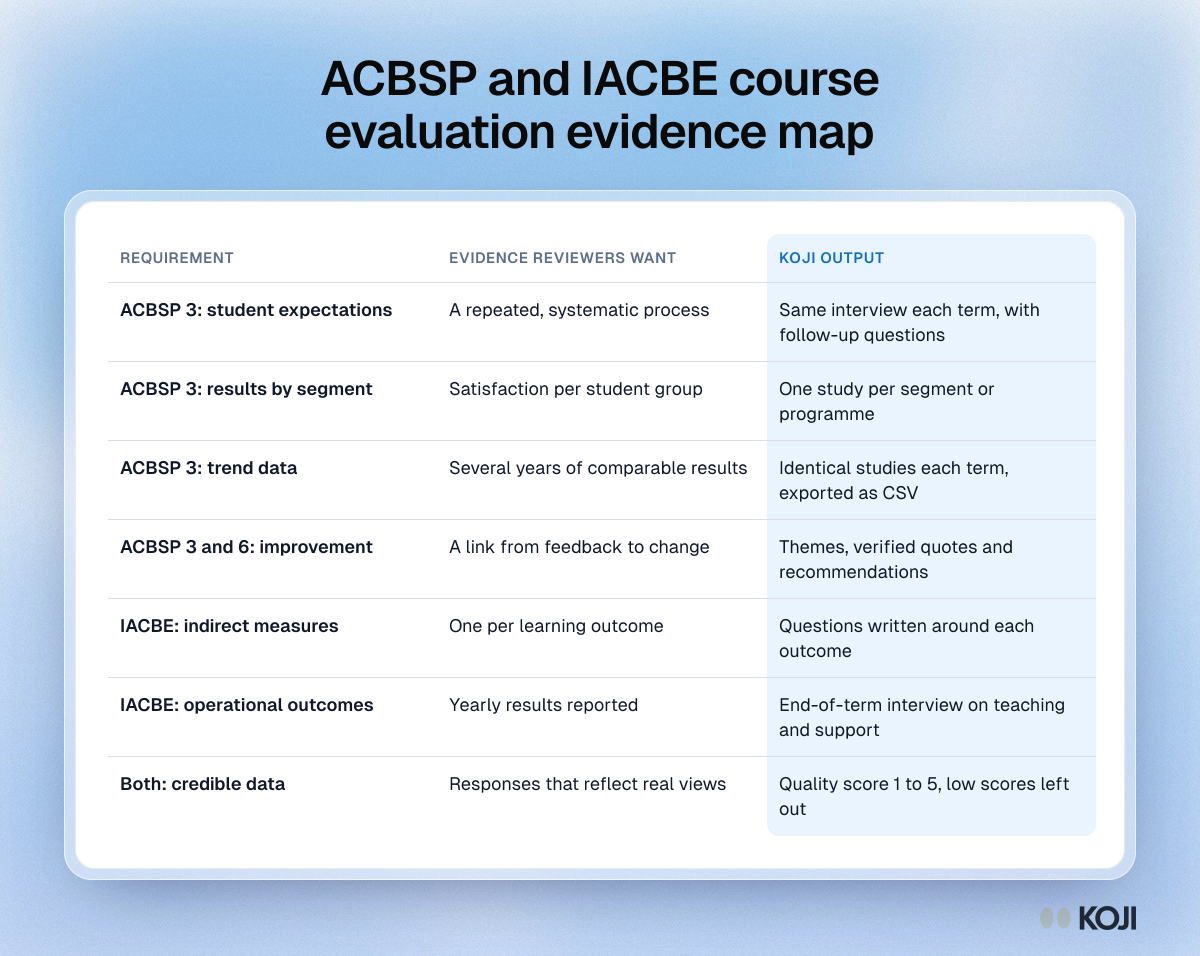
Table mapping ACBSP Standard 3 and IACBE outcomes assessment requirements to course evaluation outputs, from segment results to indirect measures.

Reference table

ACBSP and IACBE course evaluation evidence map
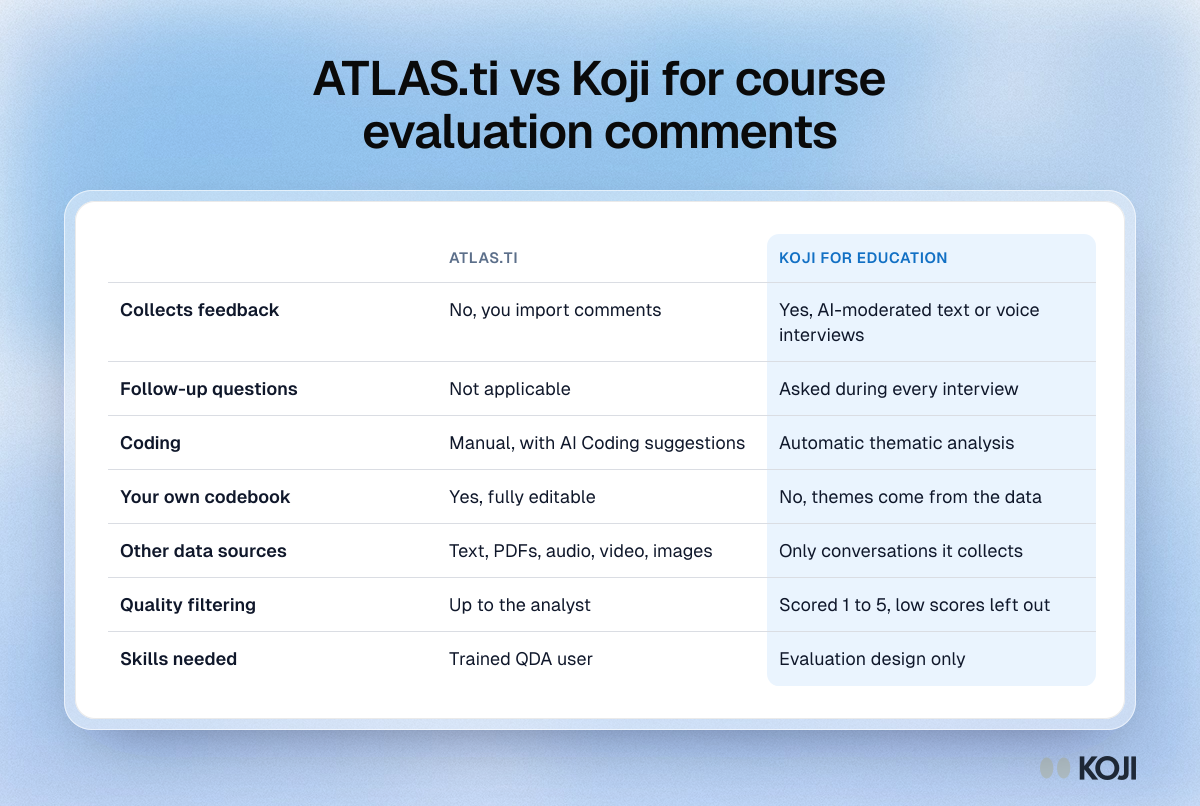
Comparison table of ATLAS.ti and Koji for course evaluation comments: collection, follow-up questions, coding, codebook control and quality filtering.

Reference table

ATLAS.ti vs Koji for course evaluation comments
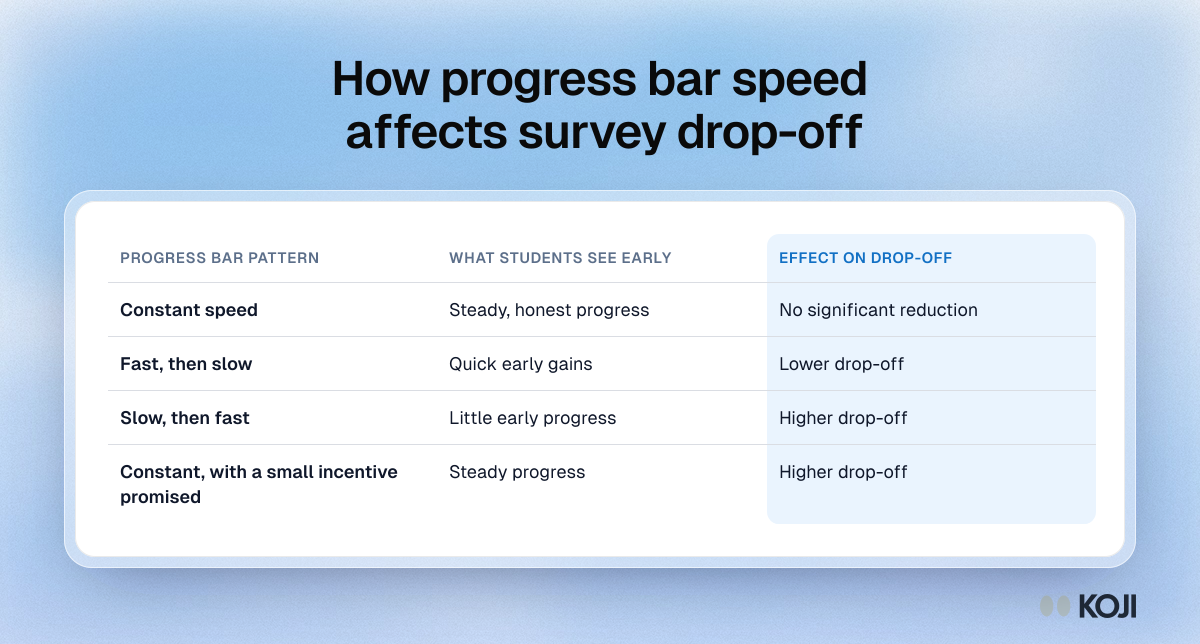
Table comparing four progress bar patterns in web surveys and their effect on drop-off, from a meta-analysis of 32 randomised experiments.

Reference table

How progress bar speed affects survey drop-off
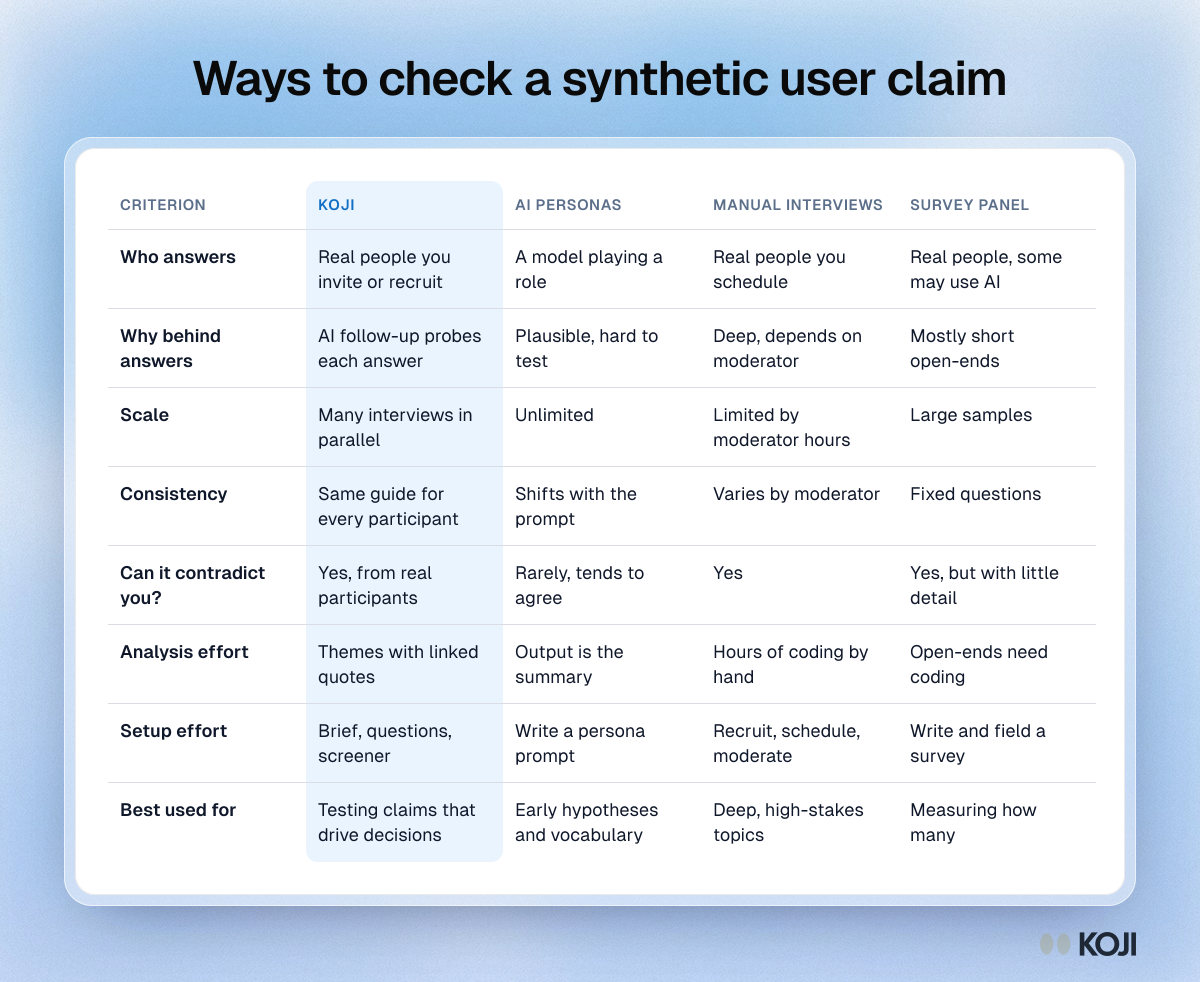
Table comparing Koji, AI personas, manual interviews and survey panels for checking a synthetic user claim, on who answers, depth, scale and analysis effort.

Reference table

Ways to check a synthetic user claim
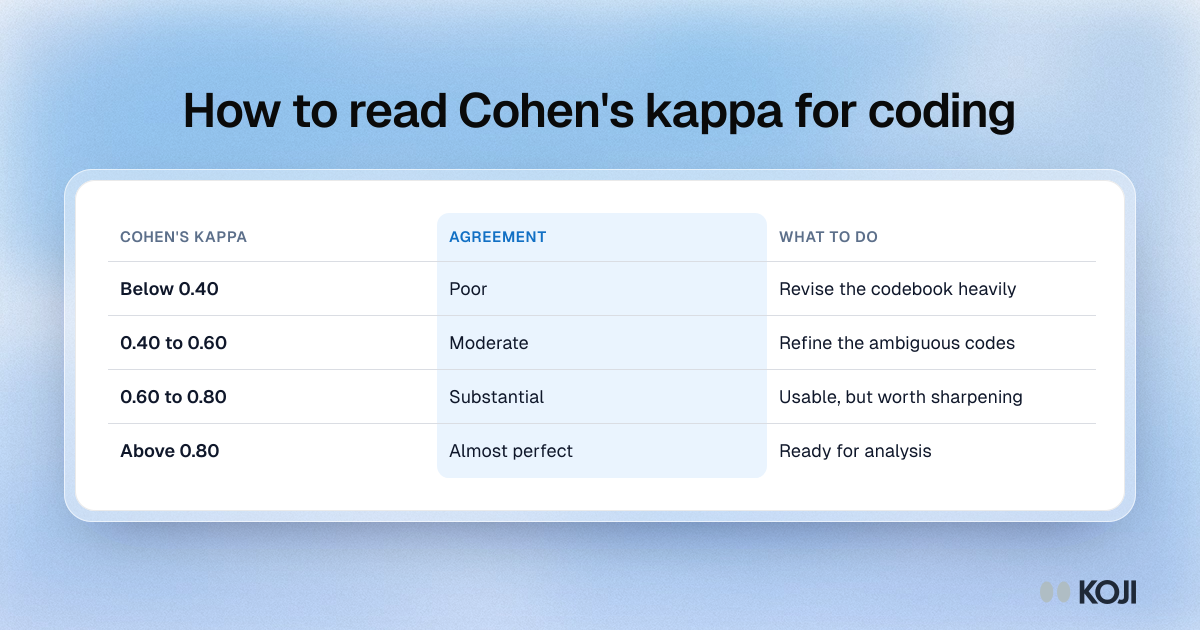
Table of Cohen's kappa thresholds for inter-coder agreement, from poor below 0.40 to almost perfect above 0.80, with what to do at each level.

Reference table

How to read Cohen's kappa for coding
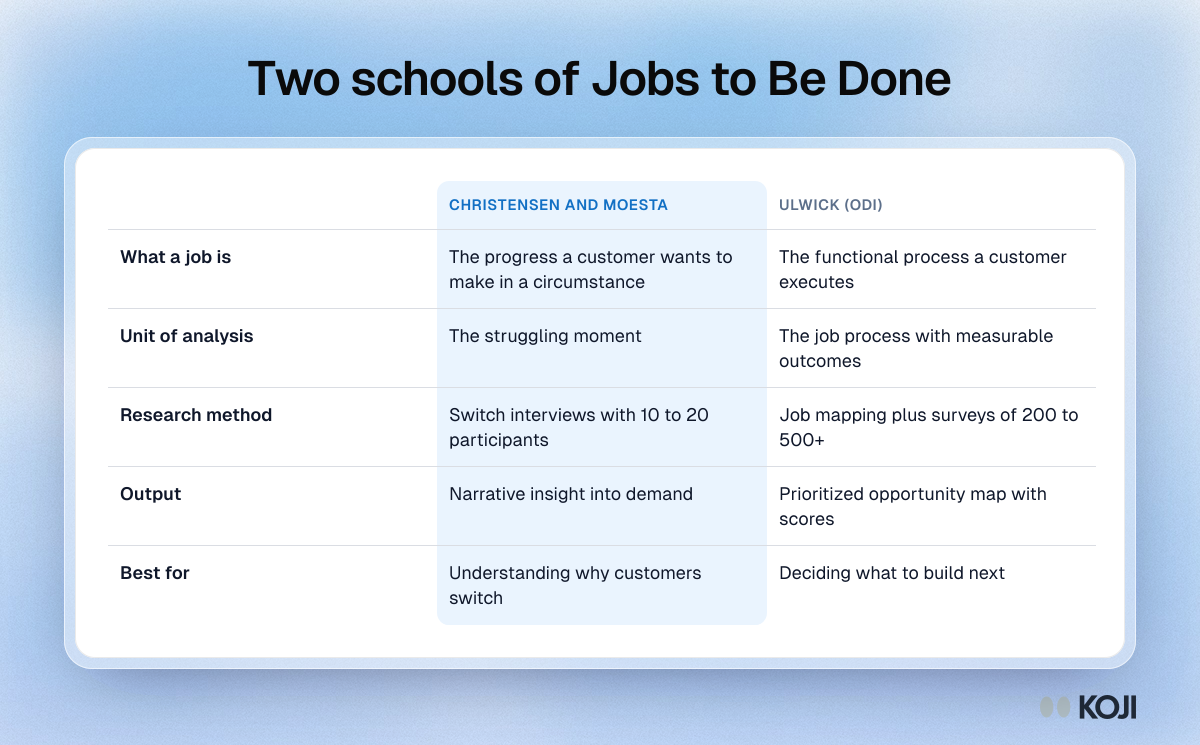
Table comparing the two schools of Jobs to Be Done, Christensen and Moesta against Ulwick's ODI, on definition, method, output and best use.

Reference table

Two schools of Jobs to Be Done
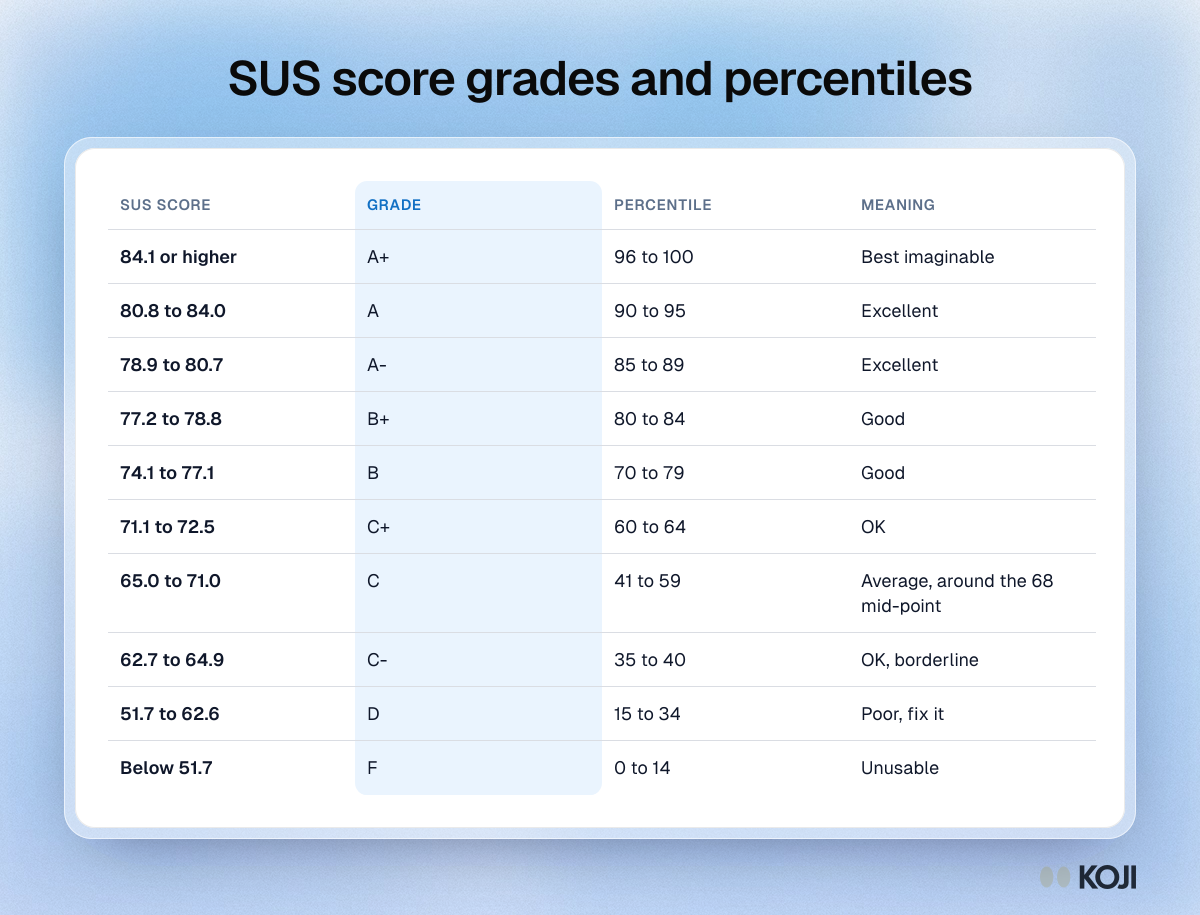
Table of System Usability Scale scores with letter grade, percentile and meaning, from A+ at 84.1 or higher down to F below 51.7, with 68 as the average.

Reference table

SUS score grades and percentiles