Free to save and share

Frameworks and cheat sheets for customer research

Every framework, checklist and comparison from our guides, as an image you can download, drop into a deck or share with your team.
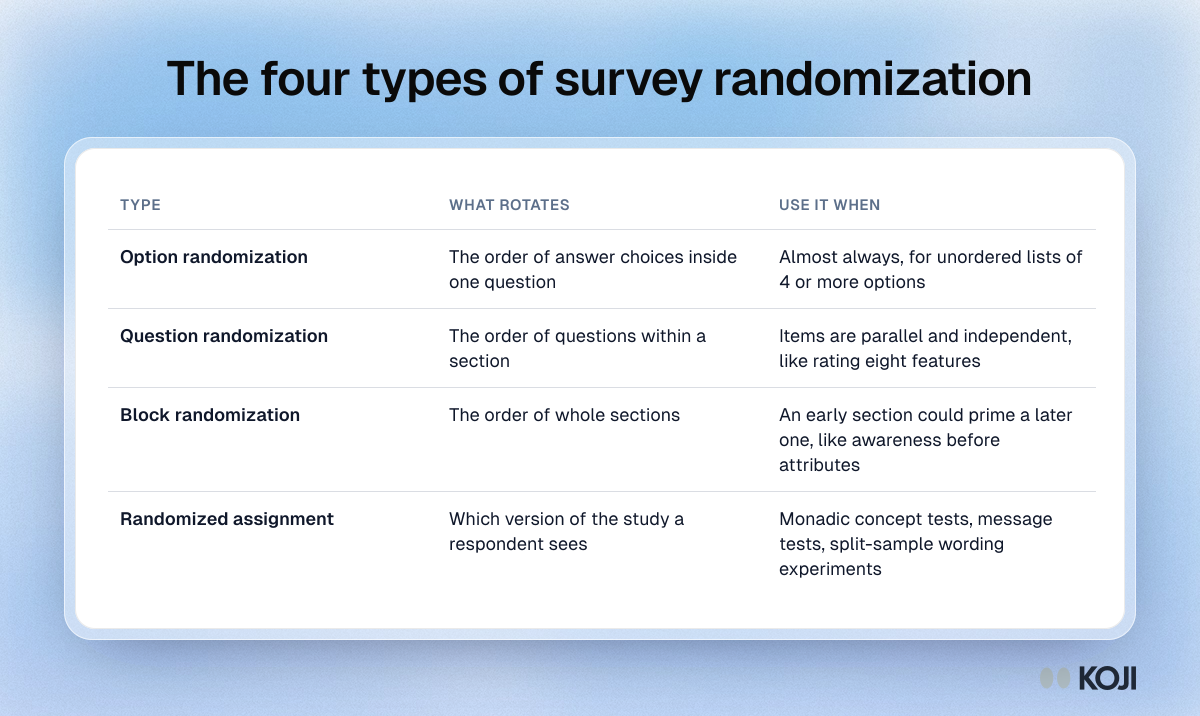
Table of the four types of survey randomization: option, question, block and randomized assignment, with what each rotates and when to use it.

Reference table

The four types of survey randomization
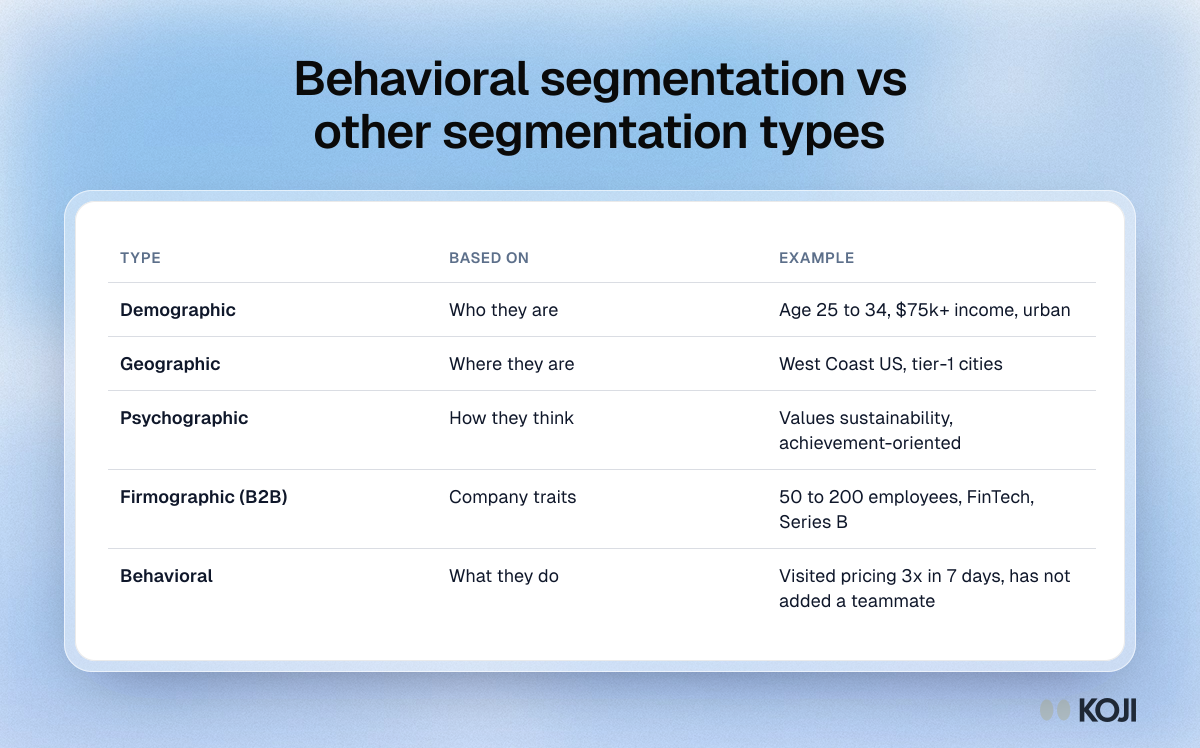
Table comparing five segmentation types by what each is based on, with examples: demographic, geographic, psychographic, firmographic and behavioral.

Reference table

Behavioral segmentation vs other segmentation types
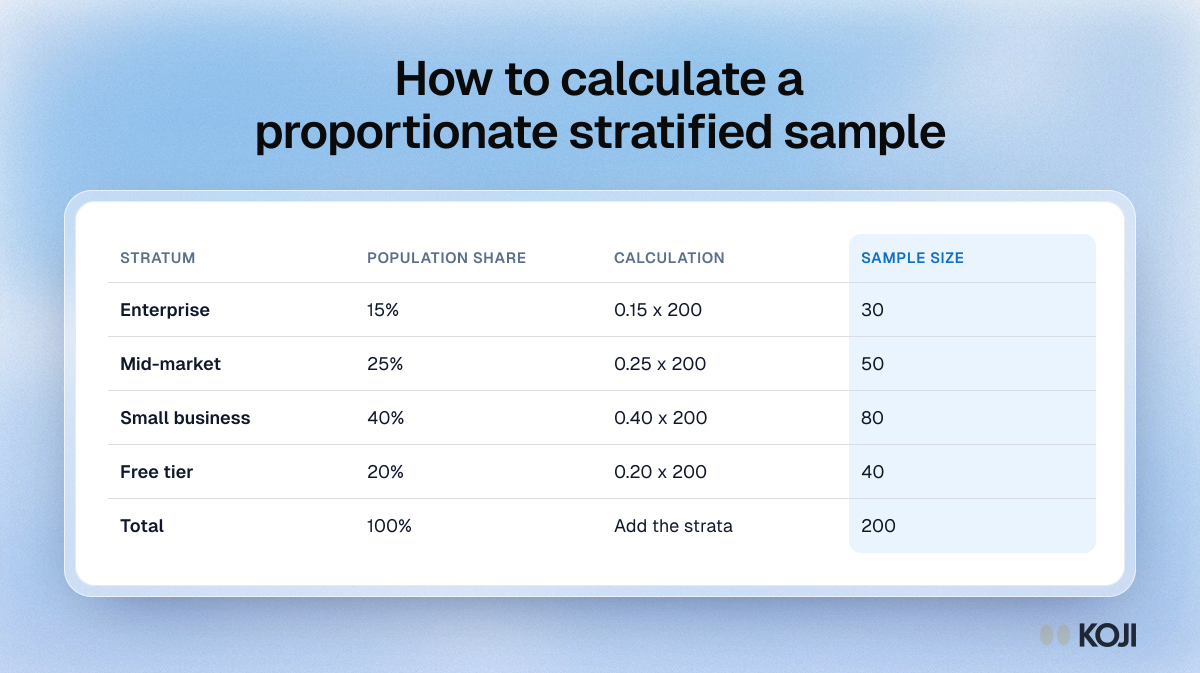
Table of a proportionate stratified sample of 200: enterprise 30, mid-market 50, small business 80 and free tier 40, each share multiplied by 200.

Reference table

How to calculate a proportionate stratified sample
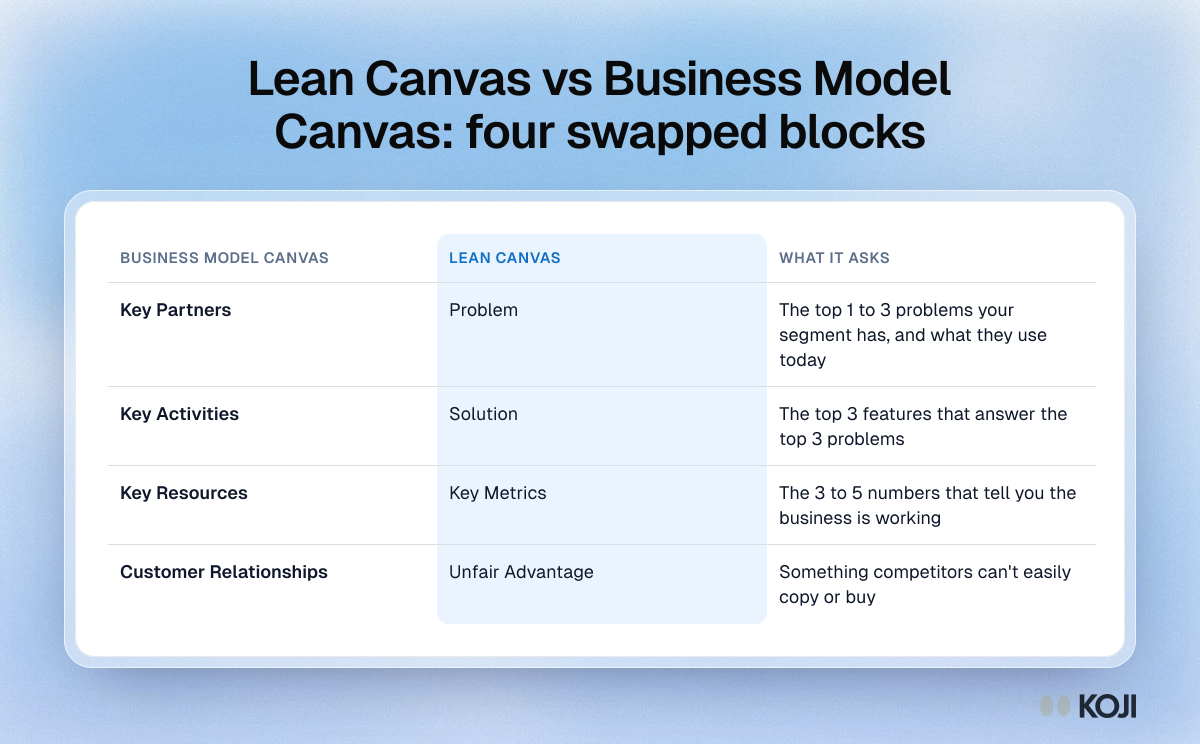
Table of the four Business Model Canvas blocks the Lean Canvas swaps out, and the problem, solution, metrics and advantage blocks that replace them

Reference table

Lean Canvas vs Business Model Canvas: four swapped blocks
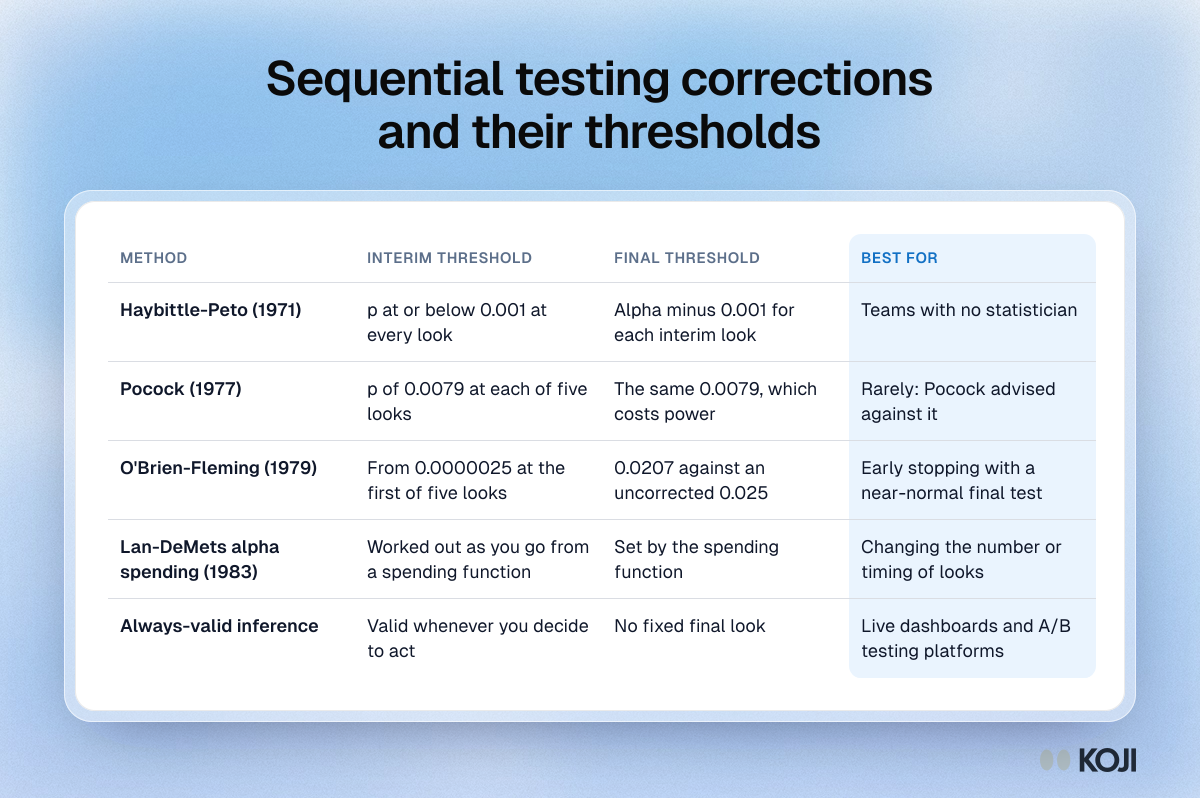
Table comparing five ways to correct for interim looks, Haybittle-Peto, Pocock, O'Brien-Fleming, alpha spending and always-valid inference, by threshold

Reference table

Sequential testing corrections and their thresholds
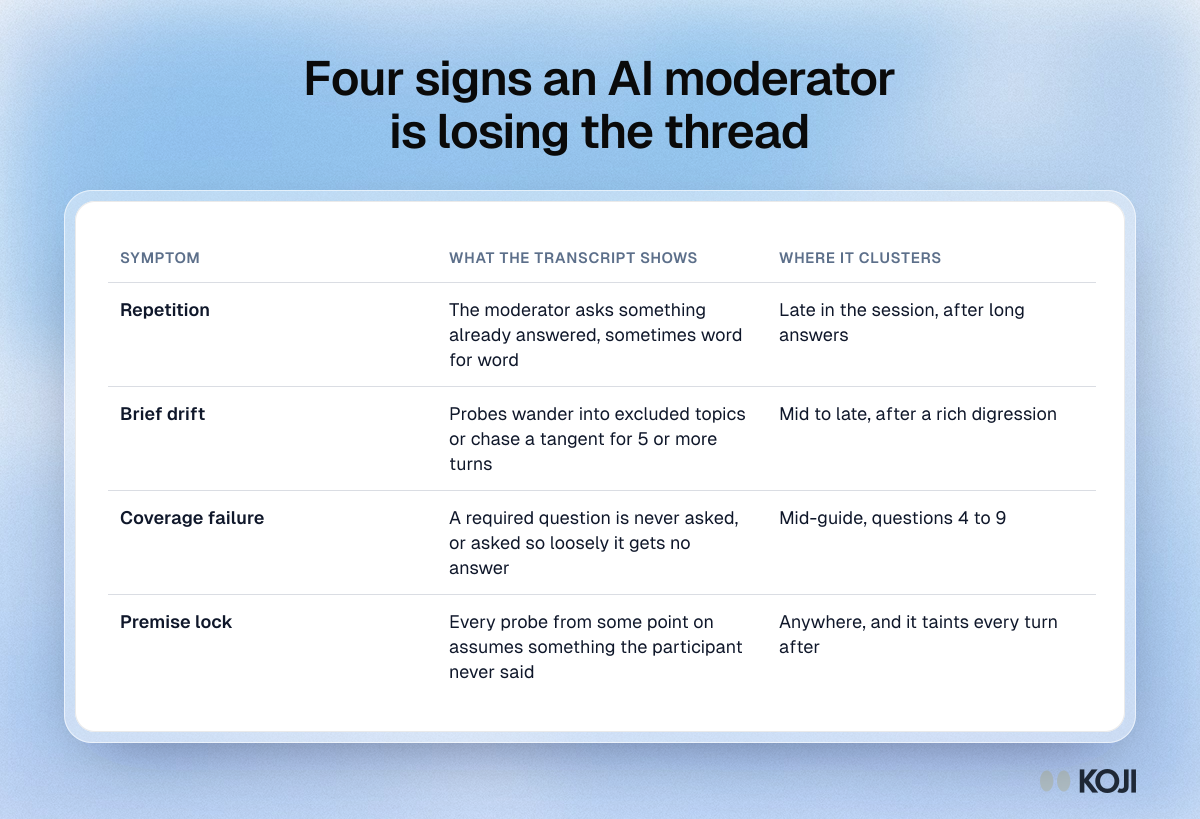
Table of four signs of long-session AI interview degradation, repetition, brief drift, coverage failure and premise lock, with where each one shows up

Reference table

Four signs an AI moderator is losing the thread
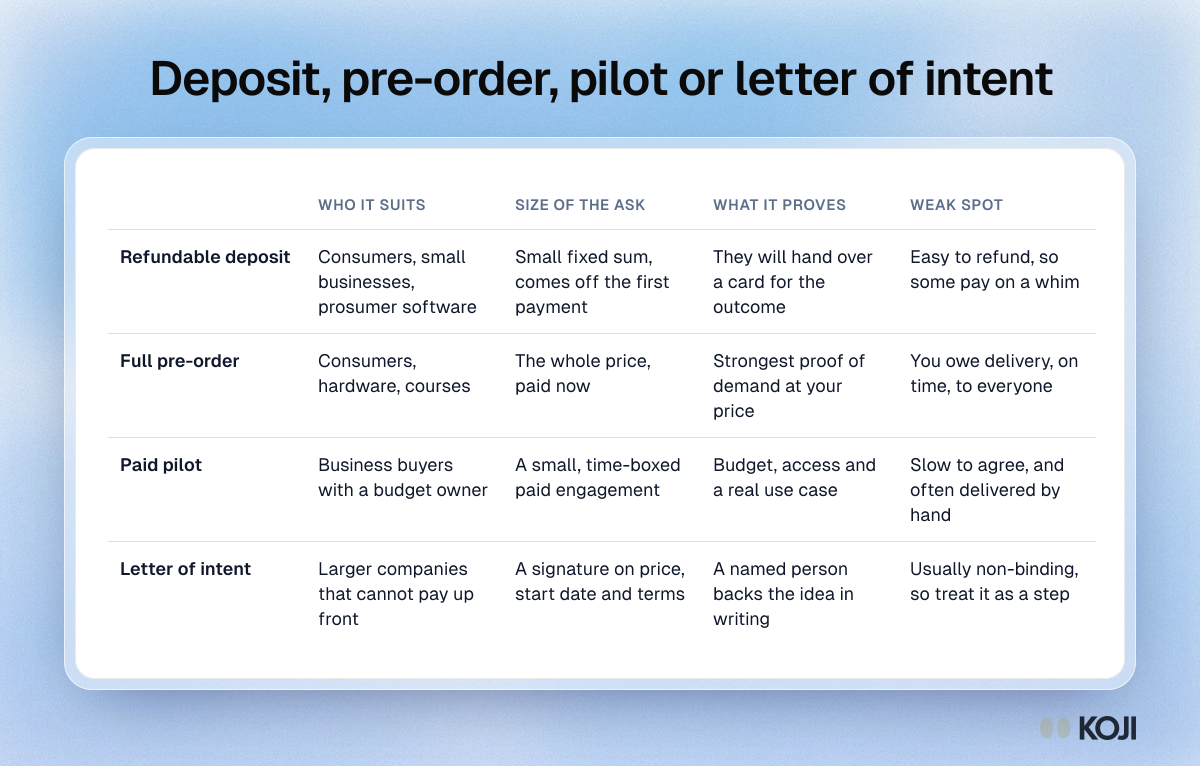
Table comparing four ways to pre-sell: deposit, pre-order, paid pilot and letter of intent, by who each suits, the ask, what it proves and its weak spot.

Reference table

Deposit, pre-order, pilot or letter of intent
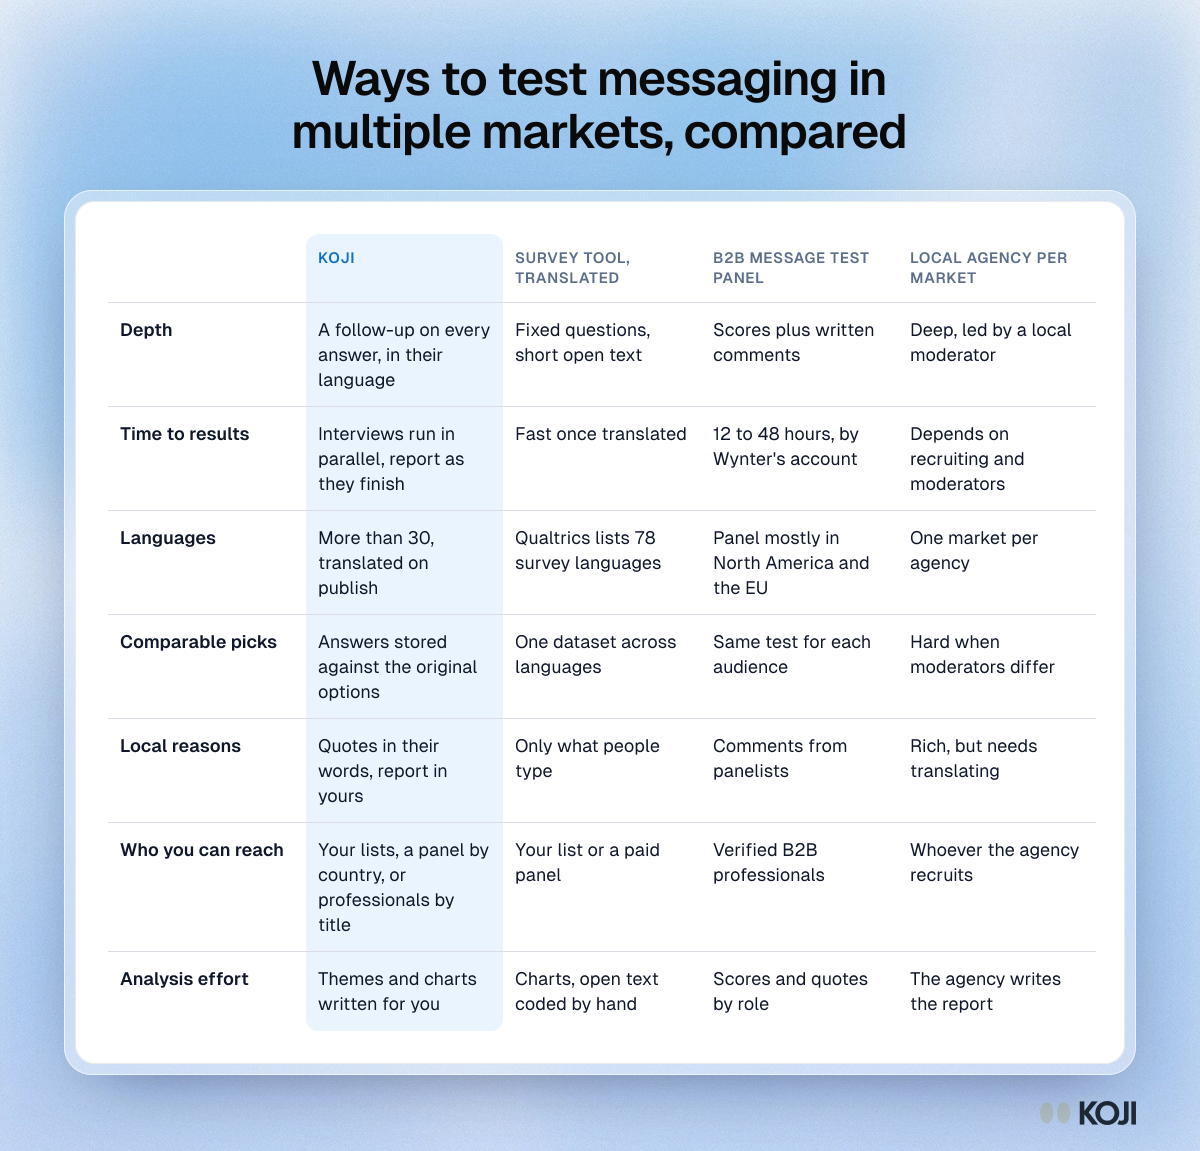
Table comparing Koji, a translated survey tool, a B2B message test panel and a local agency for testing messages across markets.

Reference table

Ways to test messaging in multiple markets, compared
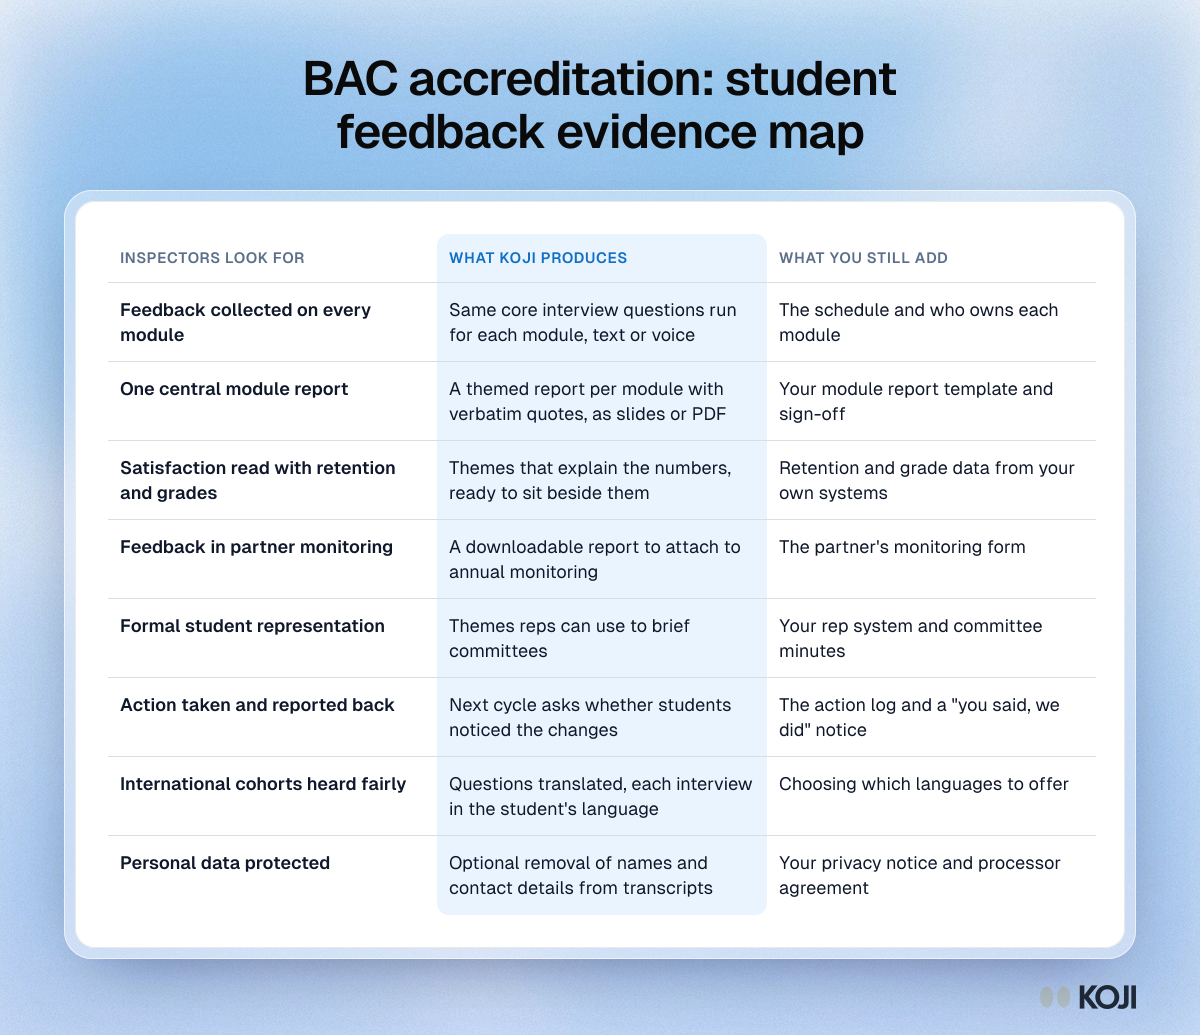
Table mapping what BAC inspectors look for in student feedback to what Koji produces and what a provider still adds, across eight areas.

Reference table

BAC accreditation: student feedback evidence map
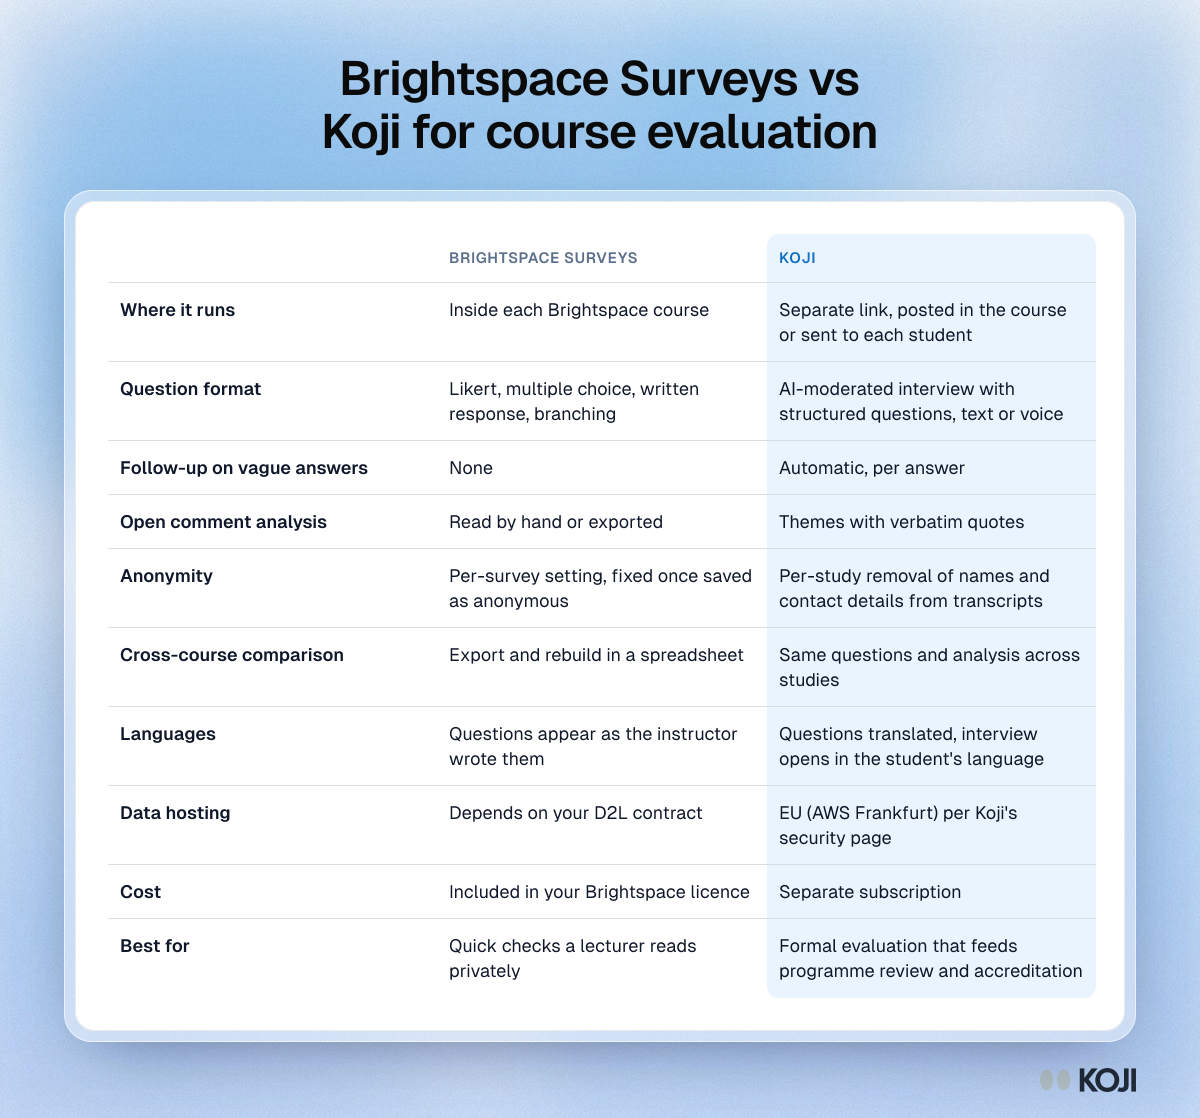
Table comparing Brightspace Surveys and Koji for course evaluation across ten points, from follow-up questions and comment analysis to hosting and cost.

Reference table

Brightspace Surveys vs Koji for course evaluation
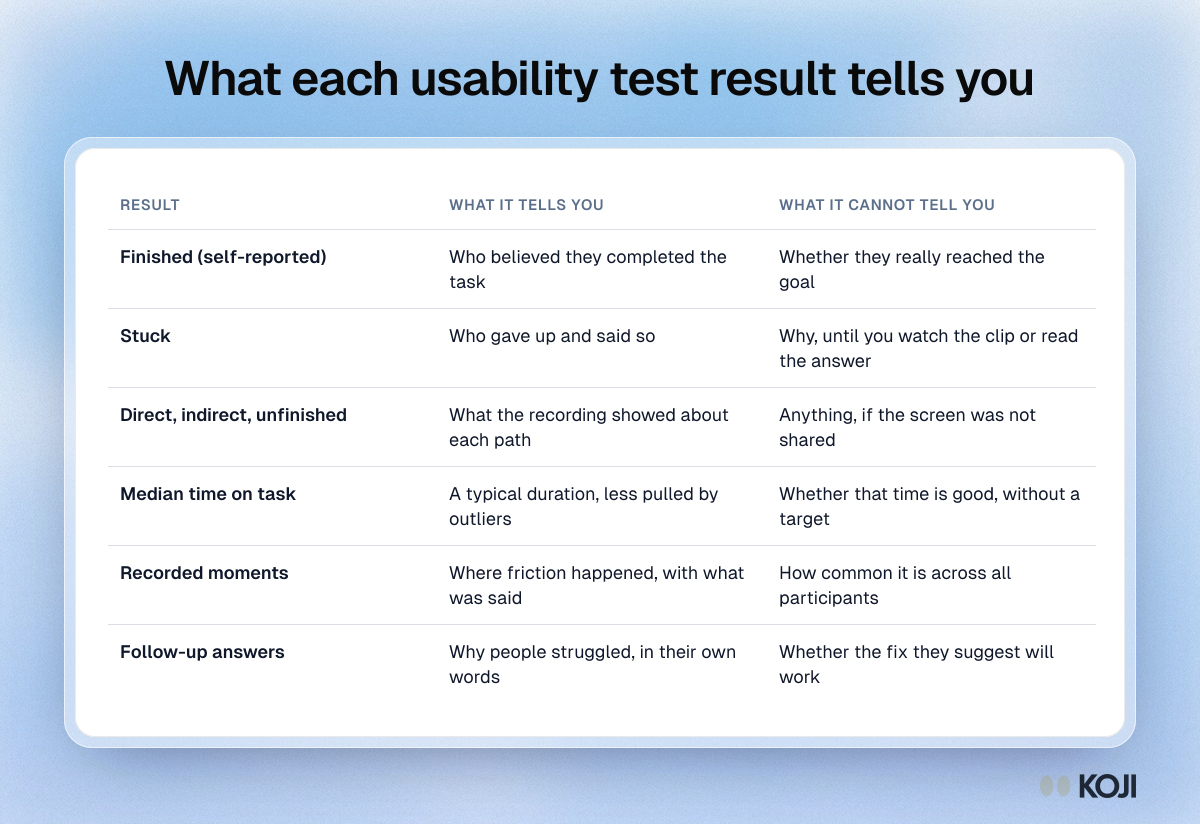
Table of six usability test results, from self-reported finishing to follow-up answers, with what each one tells you and what it cannot tell you.

Reference table

What each usability test result tells you
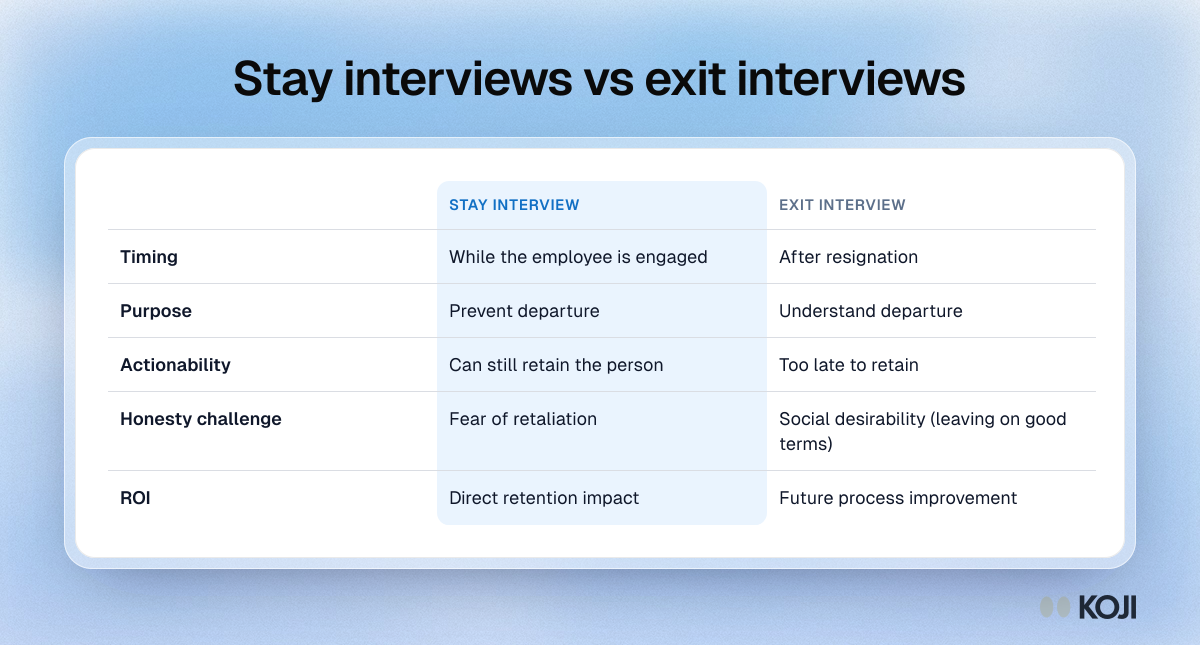
Table comparing stay interviews and exit interviews on timing, purpose, actionability, the honesty challenge and return on investment.

Reference table

Stay interviews vs exit interviews
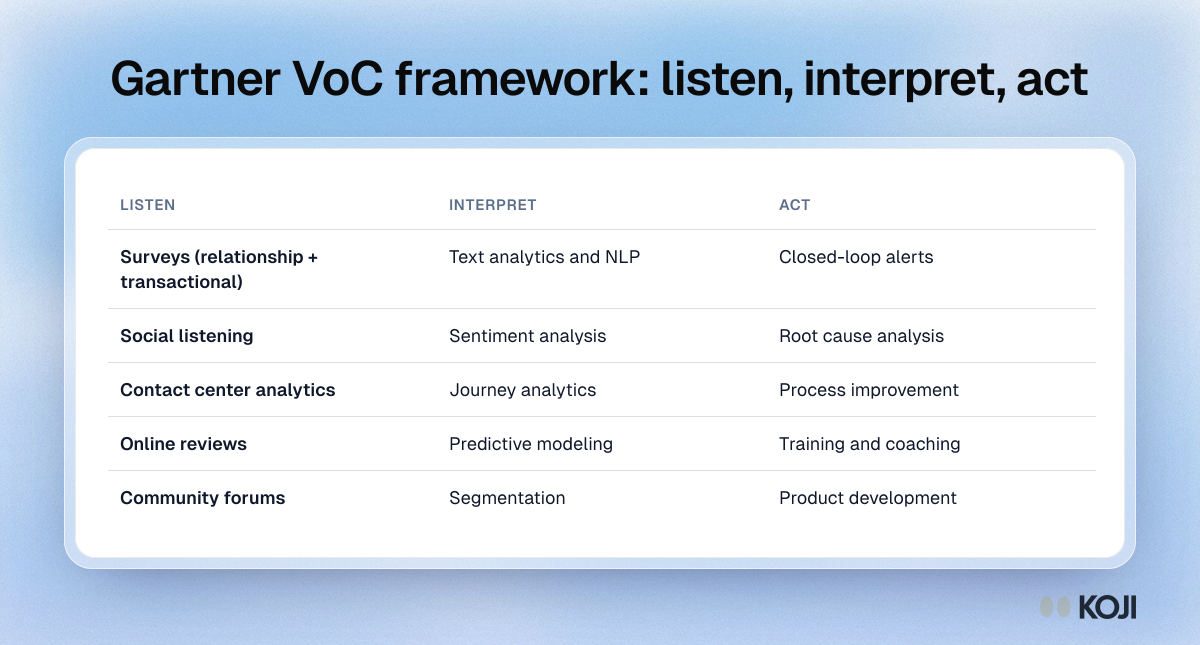
Table of the Gartner VoC framework: capabilities to listen, interpret and act, from surveys and sentiment analysis to closed-loop alerts.

Reference table

Gartner VoC framework: listen, interpret, act
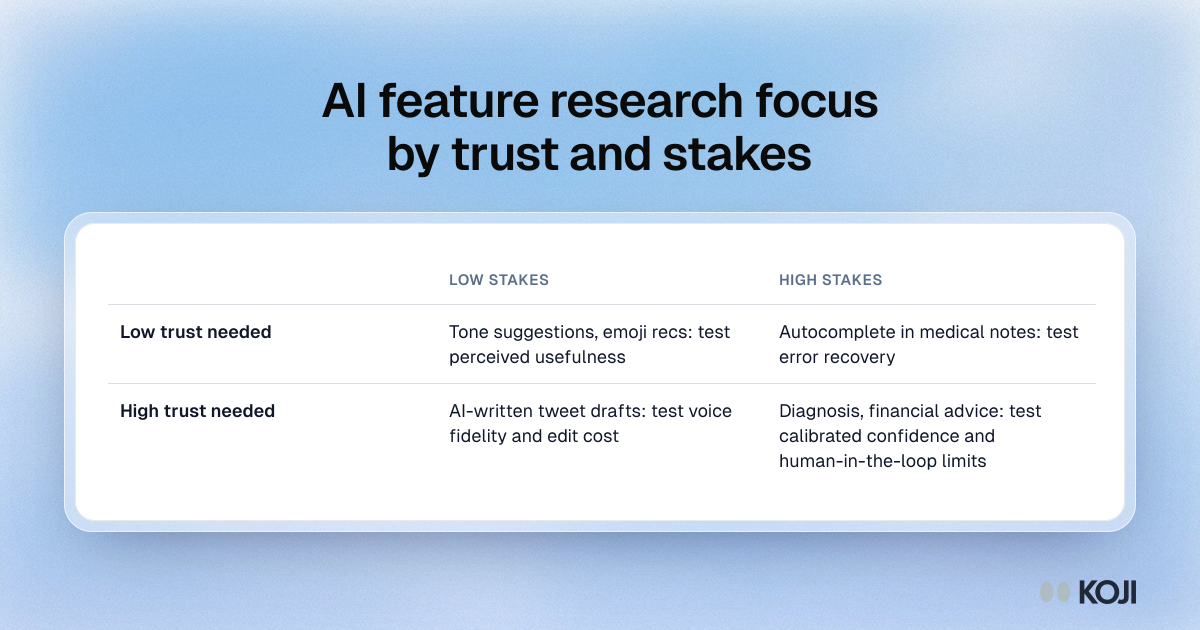
Table placing AI features by the trust they need and their stakes, with what to research in each case, from perceived usefulness to calibrated confidence.

Reference table

AI feature research focus by trust and stakes
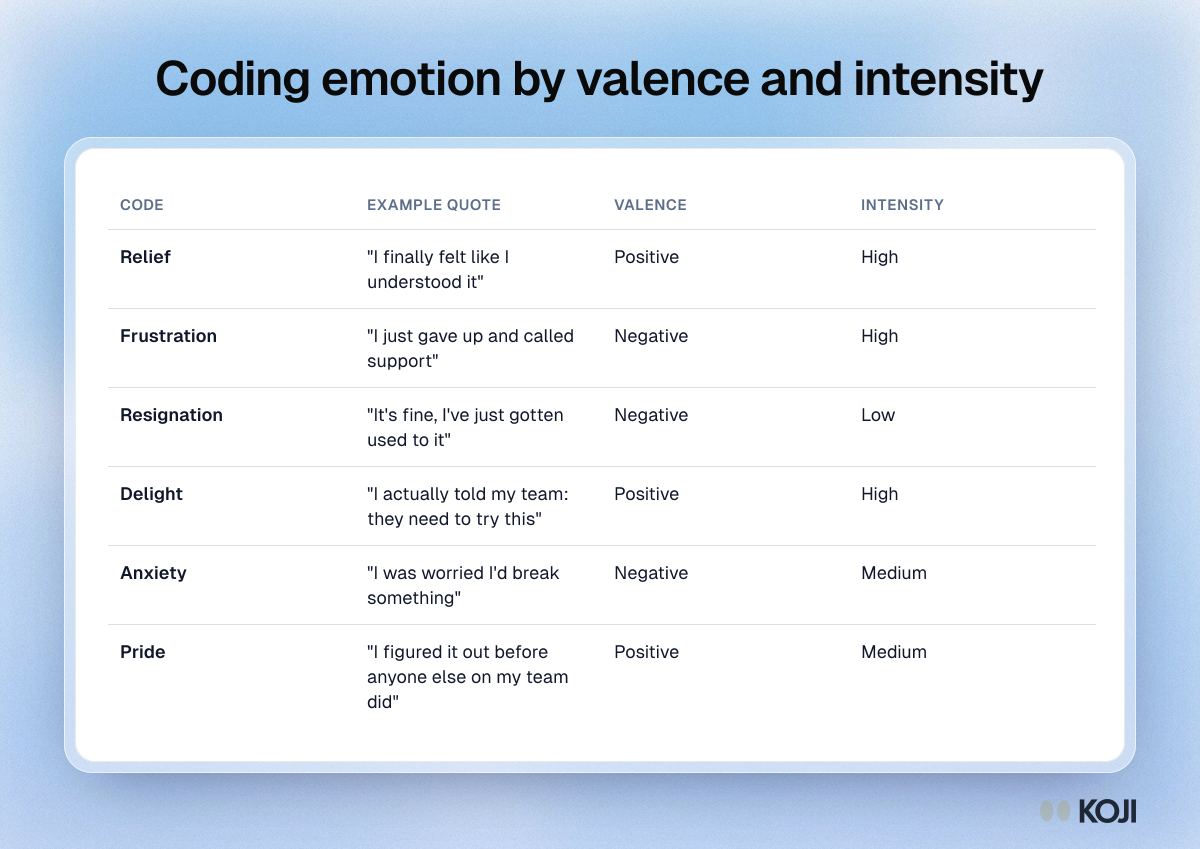
Table of six emotion codes for interviews (relief, frustration, resignation, delight, anxiety, pride) with an example quote, valence and intensity.

Reference table

Coding emotion by valence and intensity
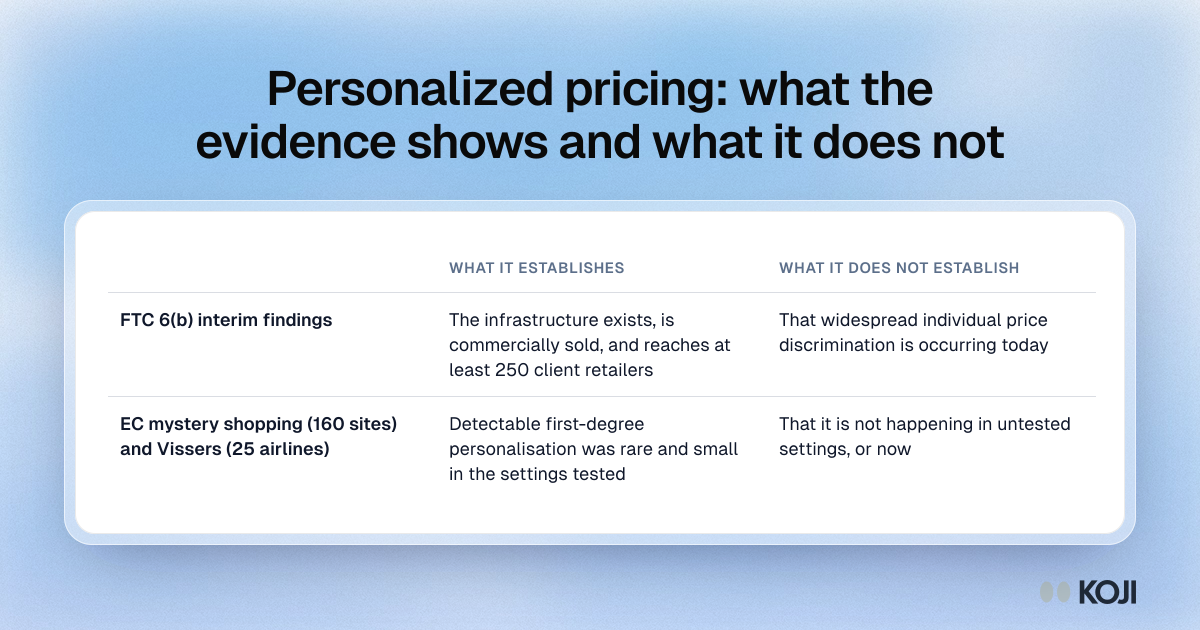
Table comparing what the FTC surveillance pricing findings and two price testing studies establish about personalized pricing, and what they leave open.

Reference table

Personalized pricing: what the evidence shows and what it does not
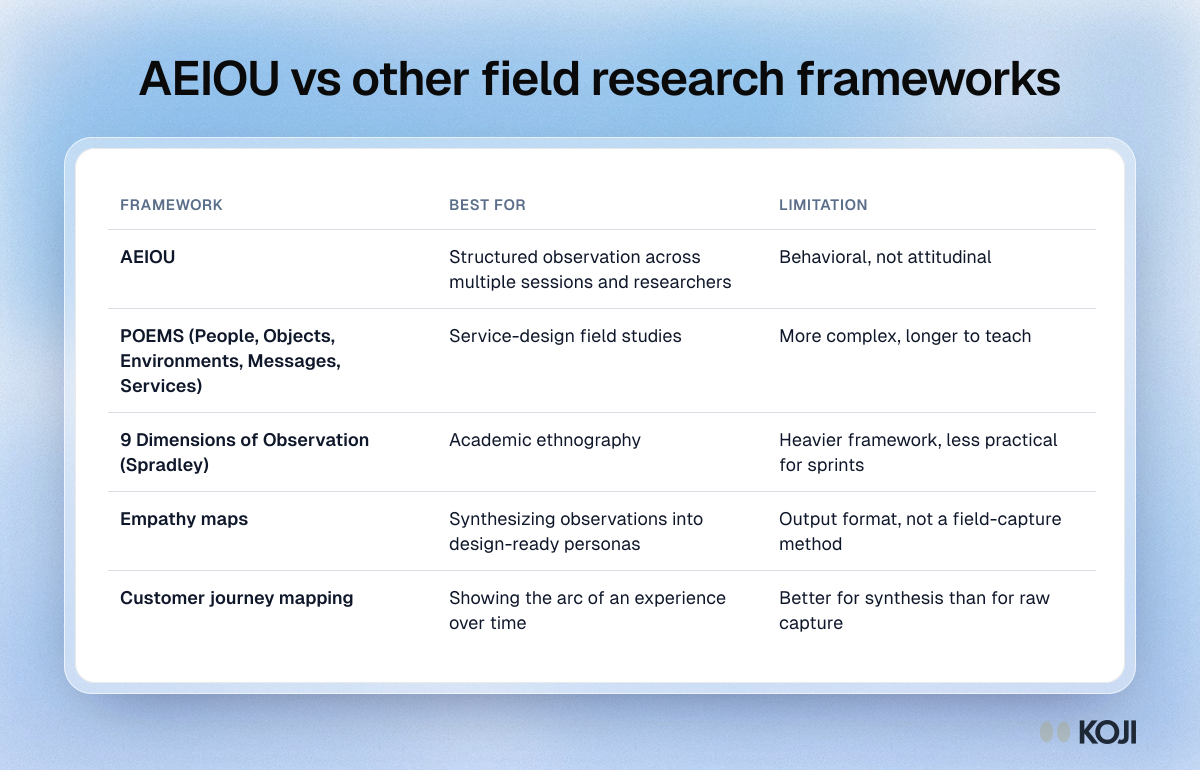
Table comparing AEIOU with POEMS, Spradley's 9 dimensions, empathy maps and journey mapping by what each is best for and its limits.

Reference table

AEIOU vs other field research frameworks
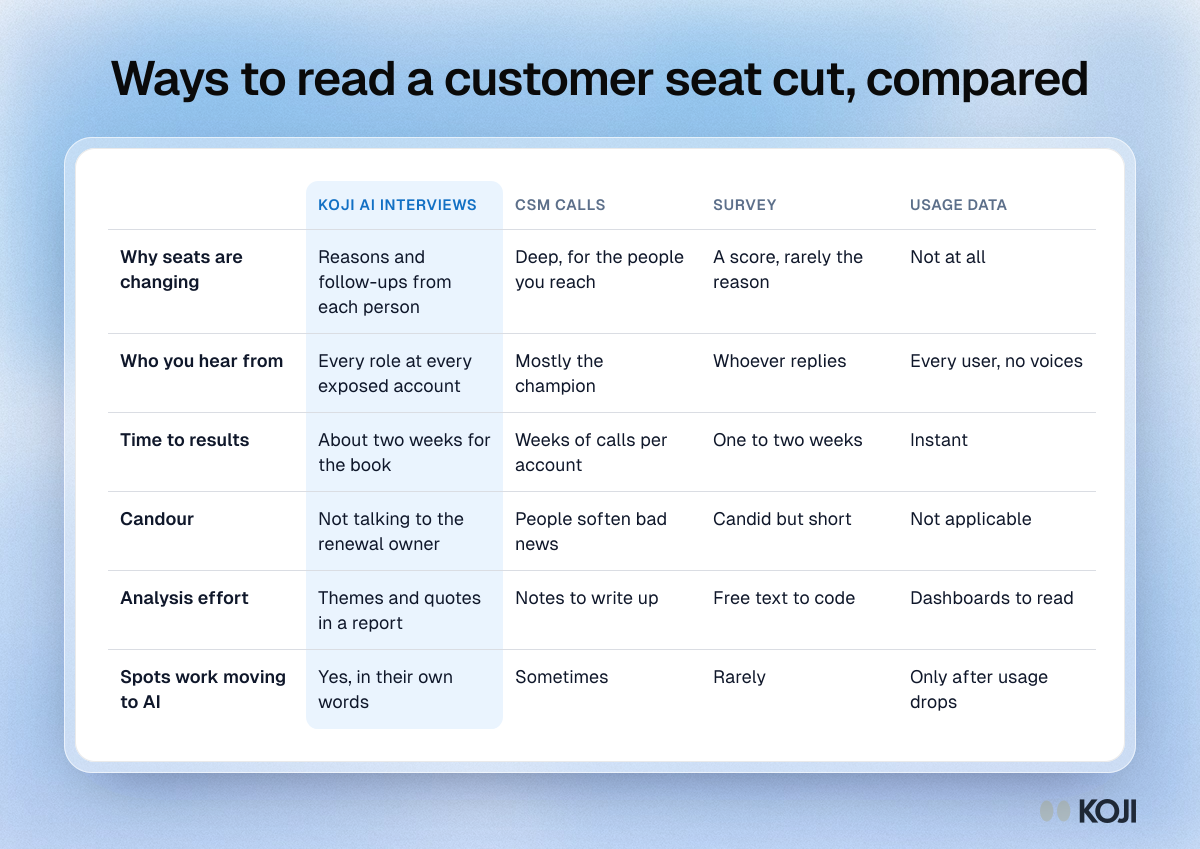
Table comparing Koji AI interviews, CSM calls, surveys and usage data on reasons, reach, speed, candour, analysis and spotting work moving to AI.

Reference table

Ways to read a customer seat cut, compared
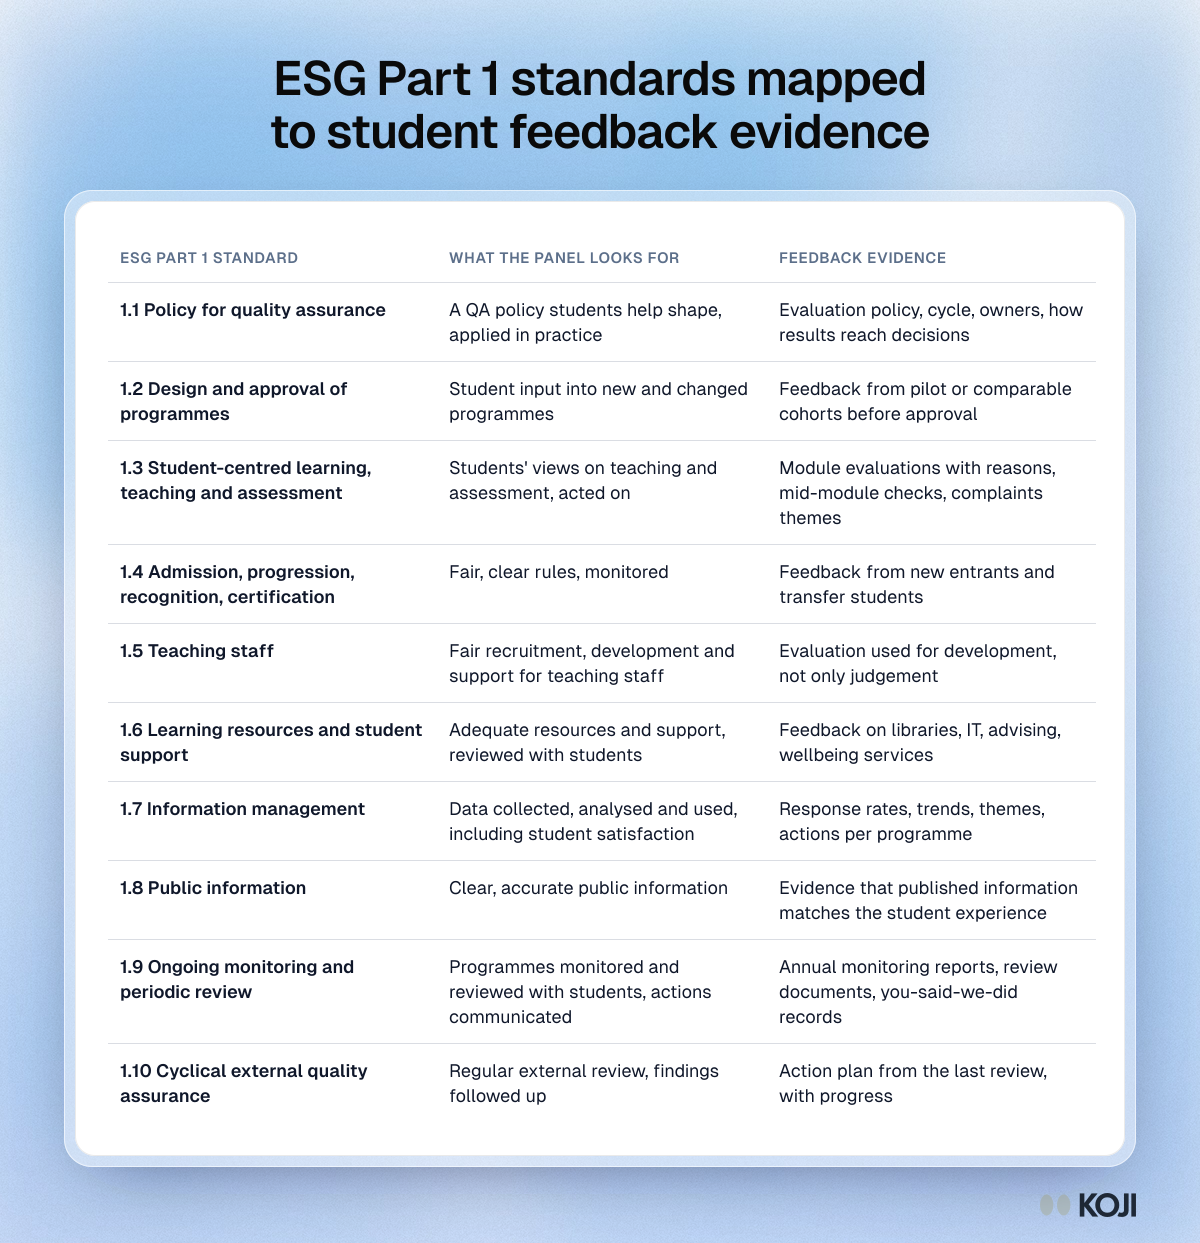
Table mapping the ten ESG Part 1 standards used in QAA International Quality Accreditation to the student feedback evidence a review panel looks for.

Reference table

ESG Part 1 standards mapped to student feedback evidence
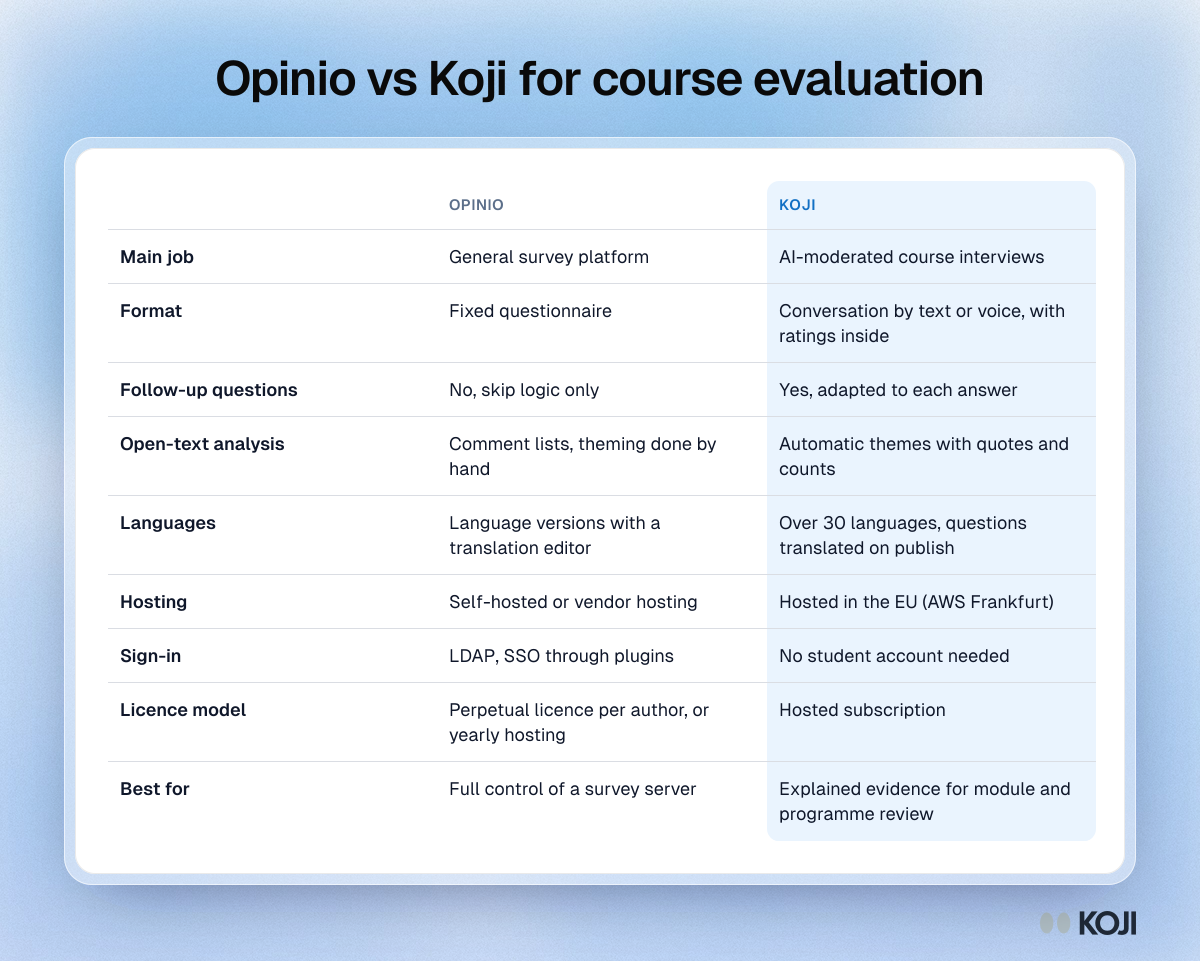
Comparison table of Opinio and Koji: job, format, follow-up questions, analysis, languages, hosting, sign-in, licence model and best fit.

Reference table

Opinio vs Koji for course evaluation
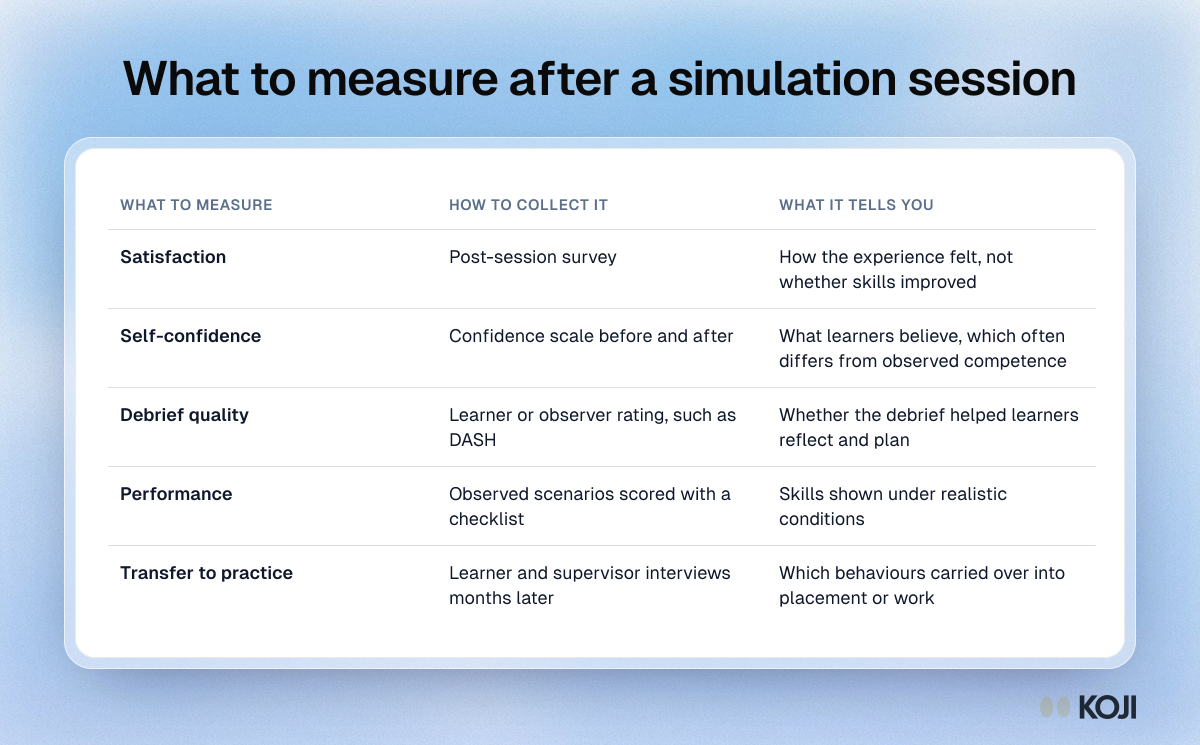
Table of what to measure after a simulation: satisfaction, confidence, debrief quality, observed performance and transfer to practice.

Reference table

What to measure after a simulation session
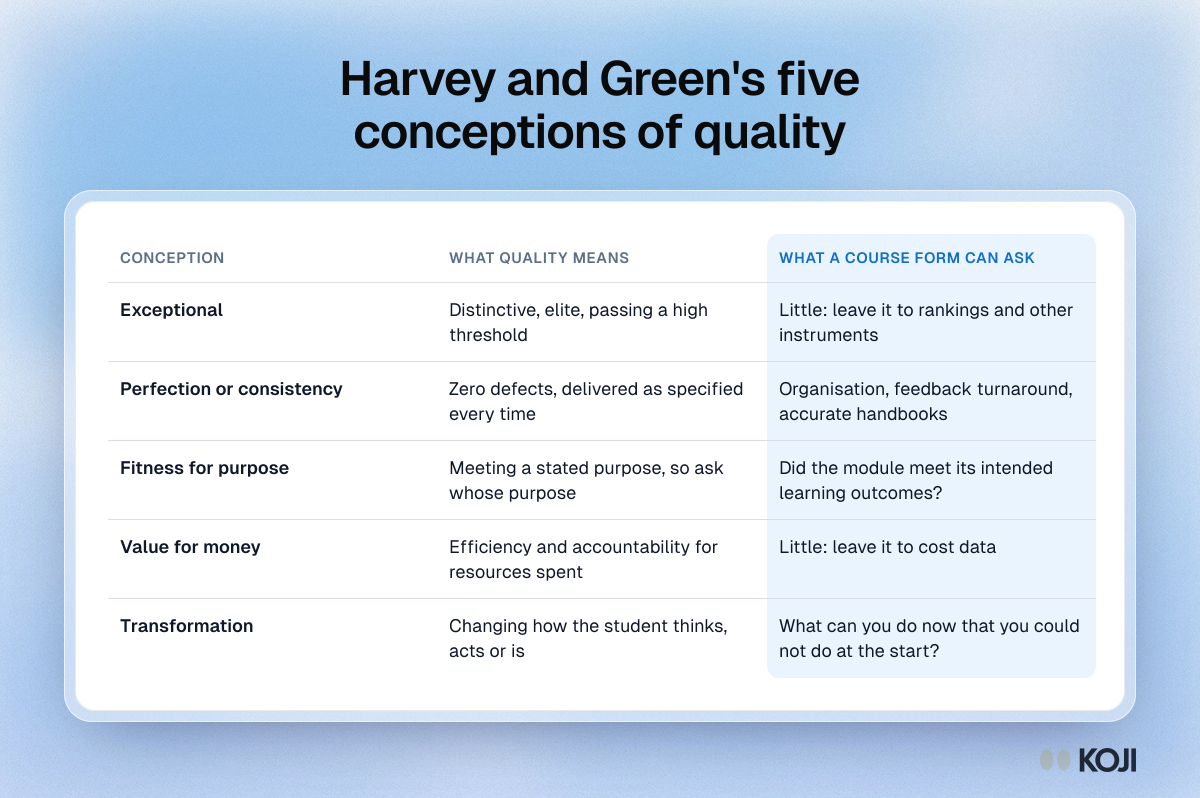
Table of Harvey and Green's five conceptions of quality in higher education, what each means and what a course evaluation can ask about it.
Reference table

Harvey and Green's five conceptions of quality

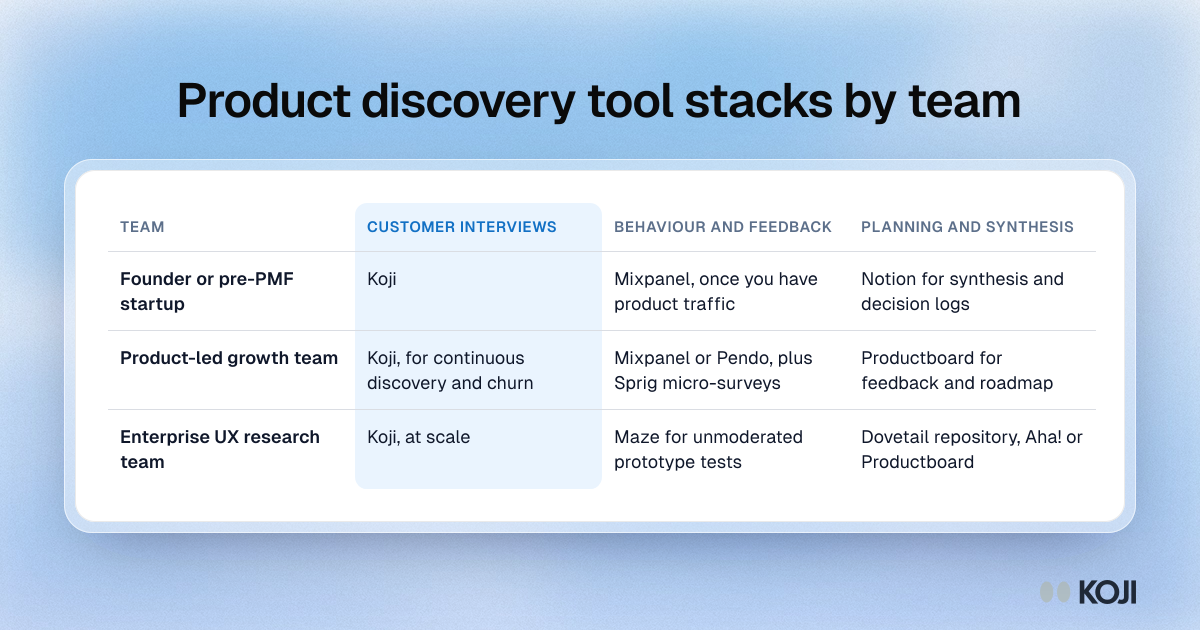
Table of three product discovery stacks, for founders, product-led growth teams and enterprise UX research teams, split by interviews, behaviour and planning.

Reference table

Product discovery tool stacks by team
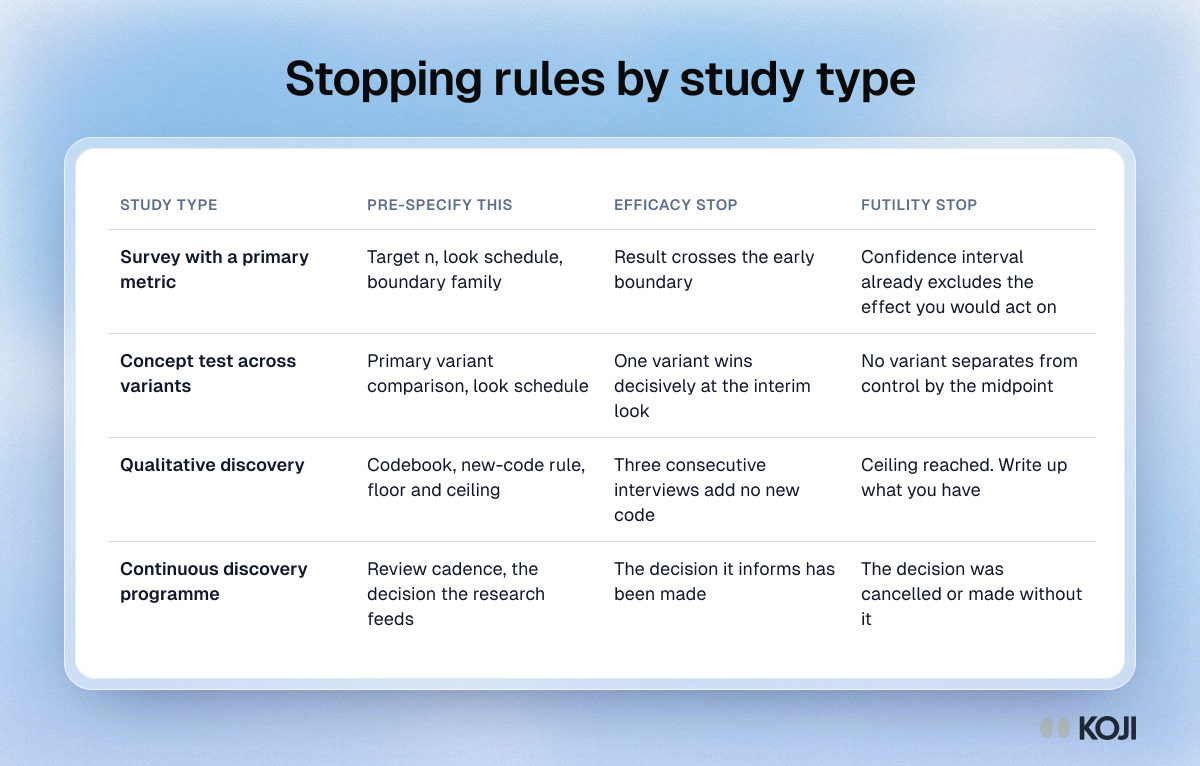
Table of what to pre-specify for four study types, from surveys to continuous discovery, and when each should stop early for success or for futility.

Reference table

Stopping rules by study type
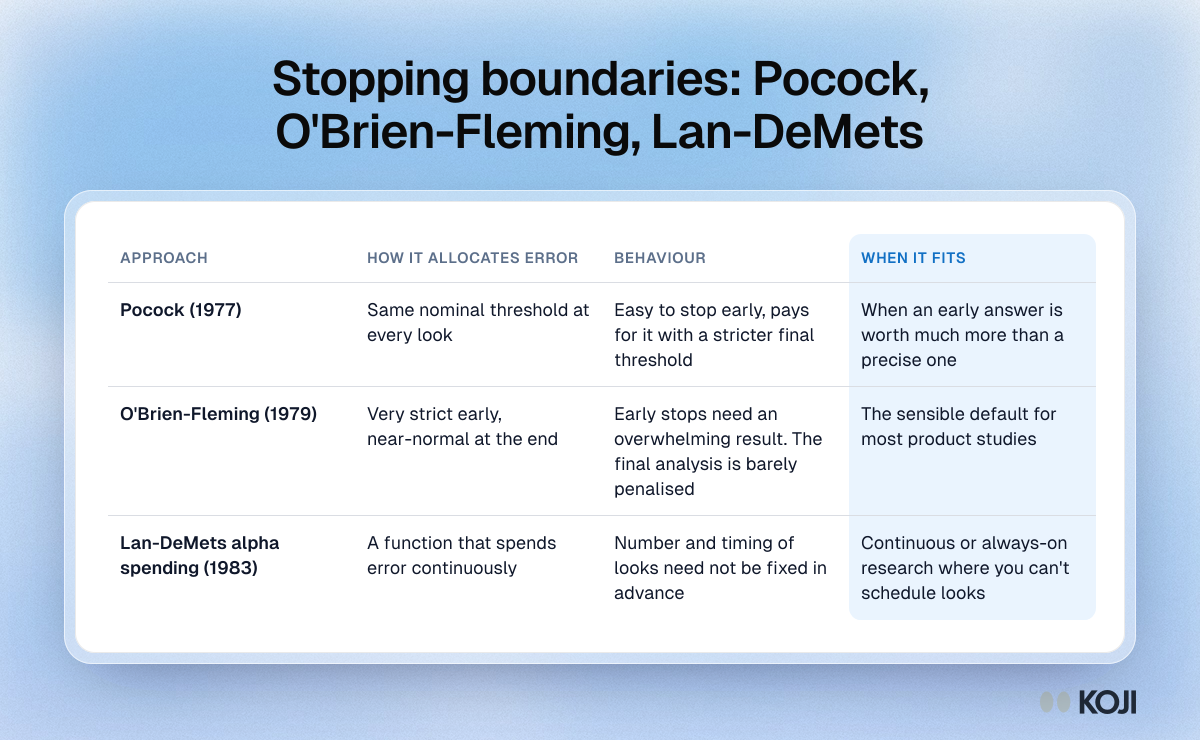
Table comparing three interim analysis boundaries, Pocock, O'Brien-Fleming and Lan-DeMets alpha spending, by how each spends error and when it fits.

Reference table

Stopping boundaries: Pocock, O'Brien-Fleming, Lan-DeMets
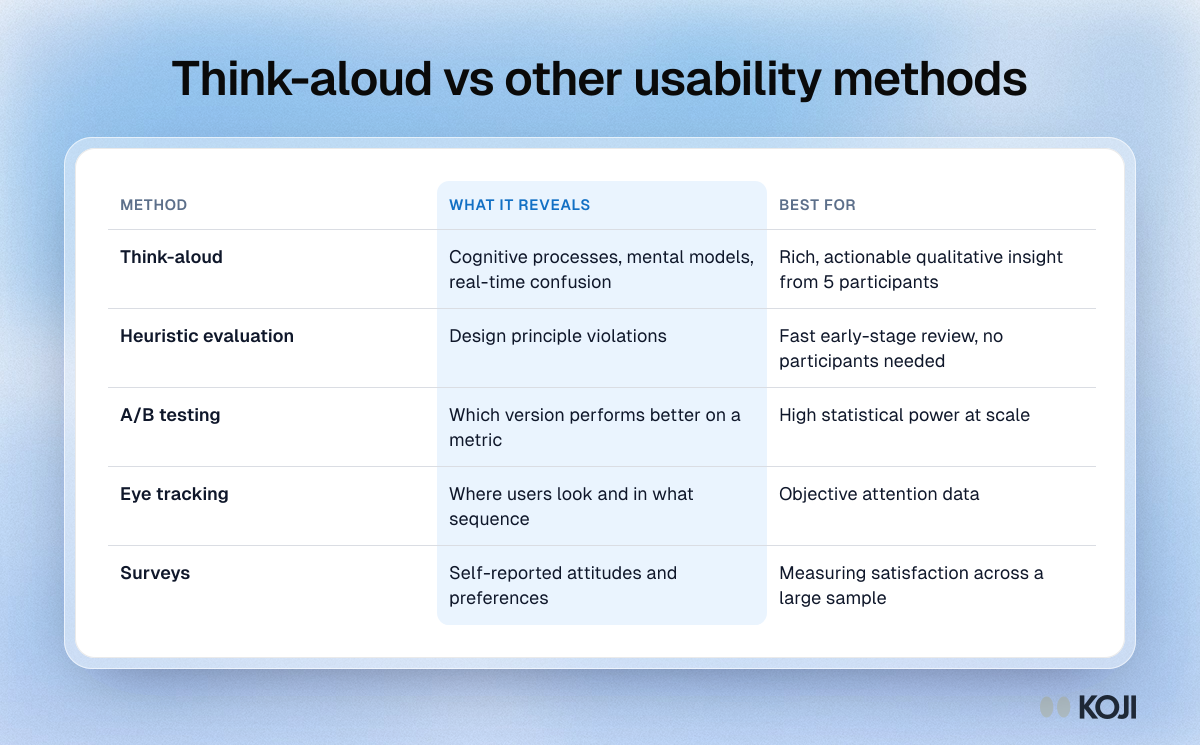
Table comparing think-aloud with heuristic evaluation, A/B testing, eye tracking and surveys by what each method reveals and what it suits best.

Reference table

Think-aloud vs other usability methods
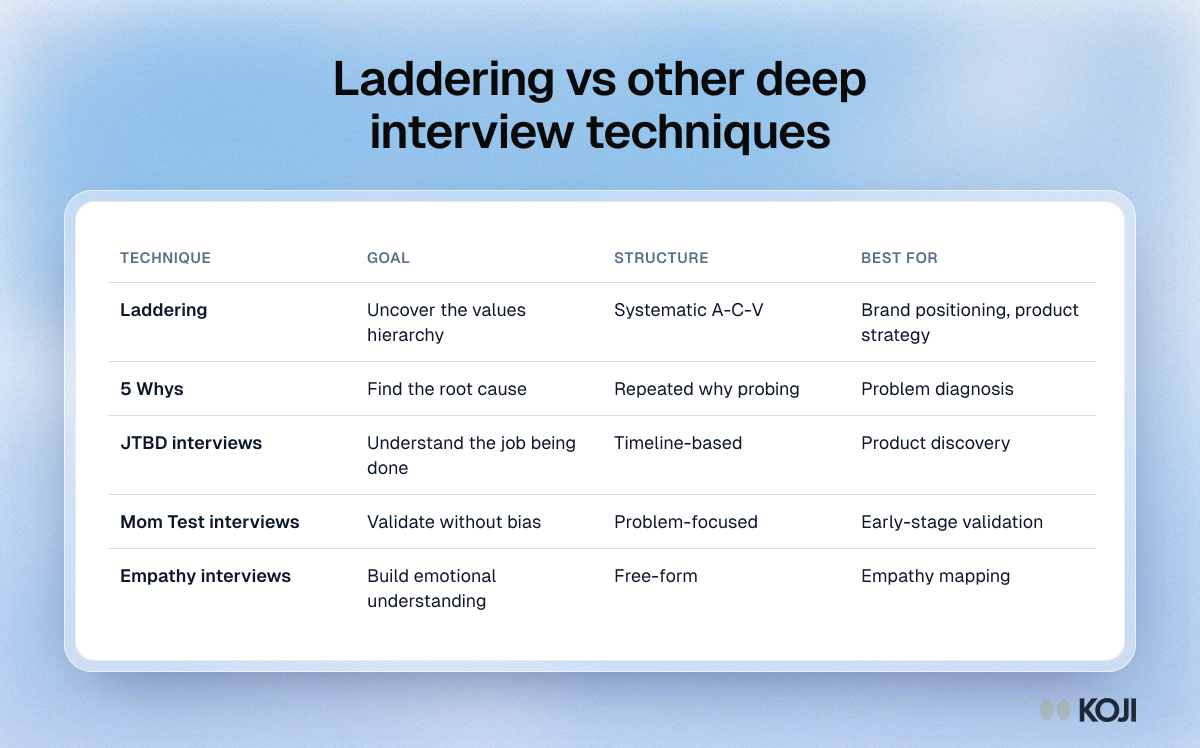
Table comparing laddering with 5 Whys, JTBD, Mom Test and empathy interviews by goal, structure and what each technique is best for.

Reference table

Laddering vs other deep interview techniques
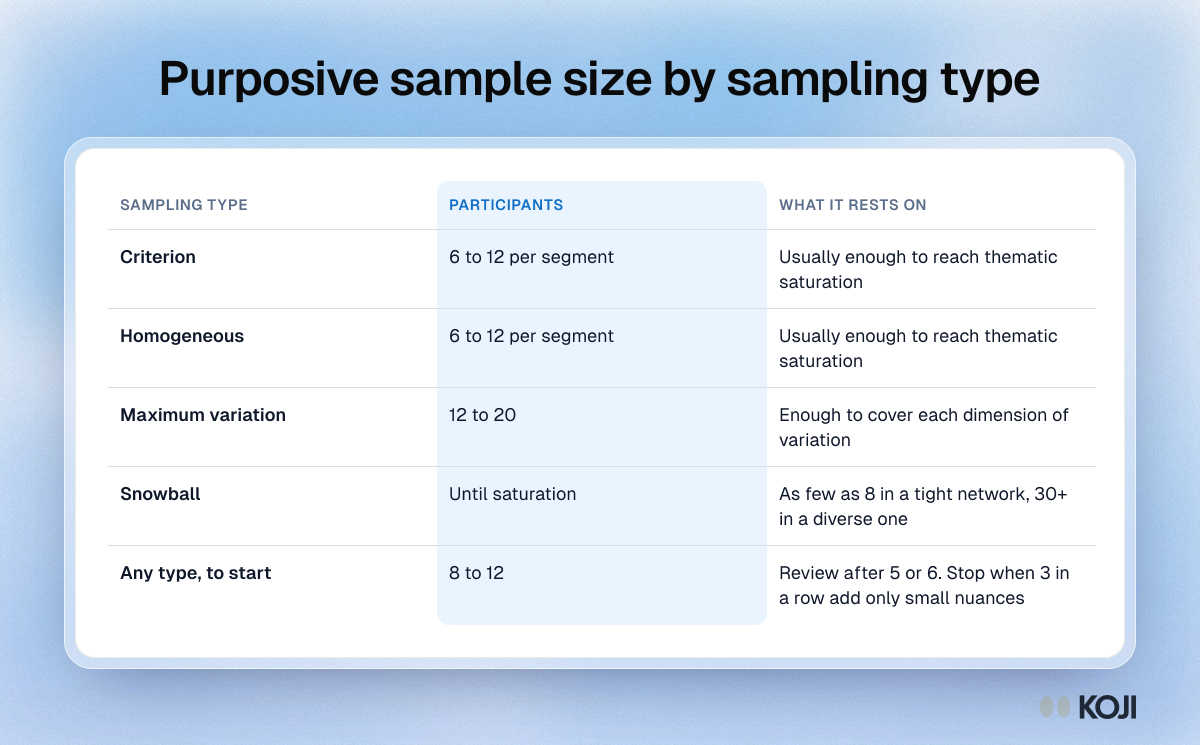
Table of how many participants each type of purposive sampling needs, from 6 to 12 per segment for criterion sampling to 12 to 20 for maximum variation.

Reference table

Purposive sample size by sampling type
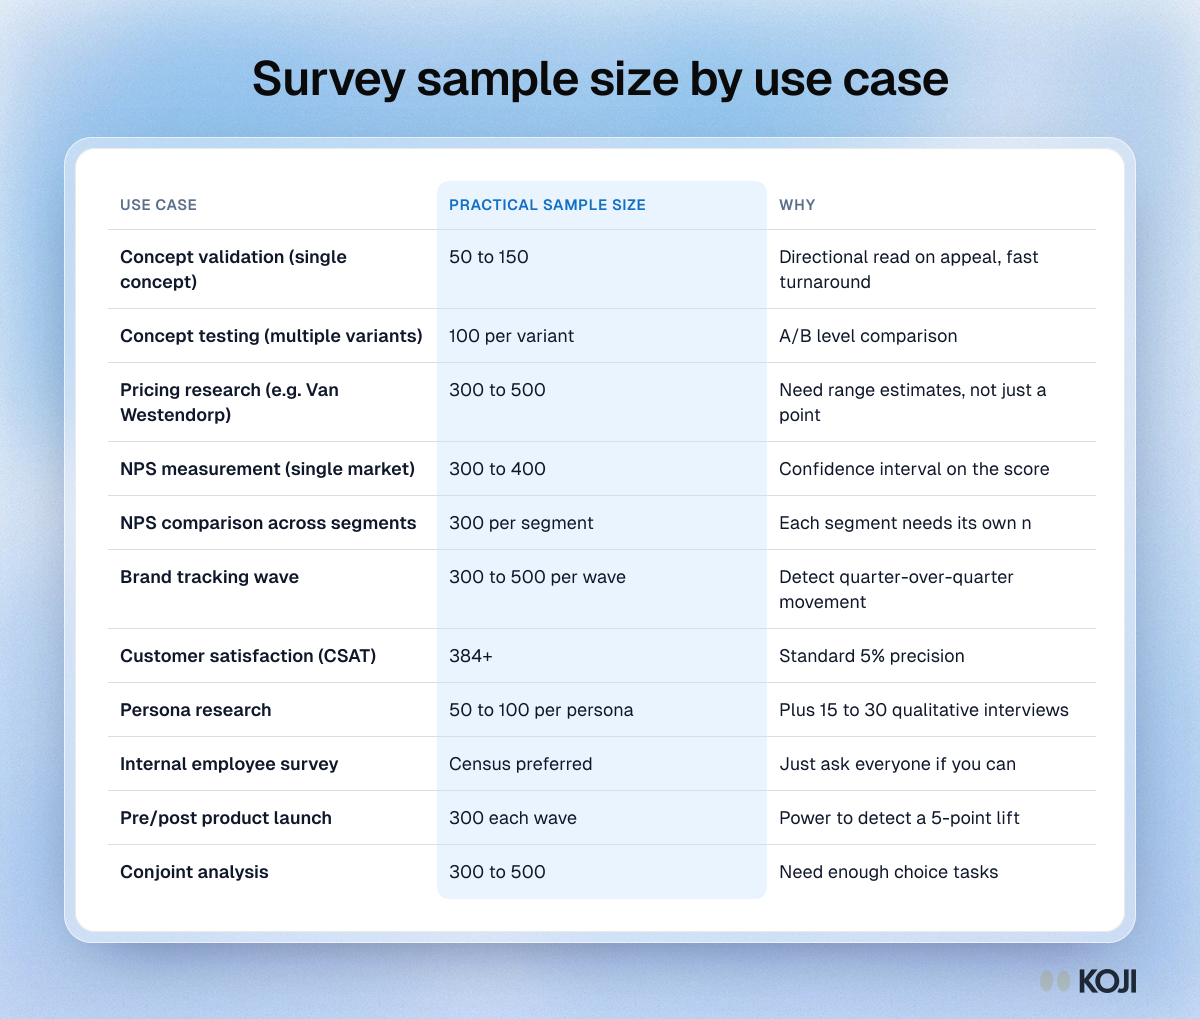
Table of practical survey sample sizes for 11 use cases, from 50 to 150 for one concept to 300 to 500 for pricing and conjoint studies.

Reference table

Survey sample size by use case
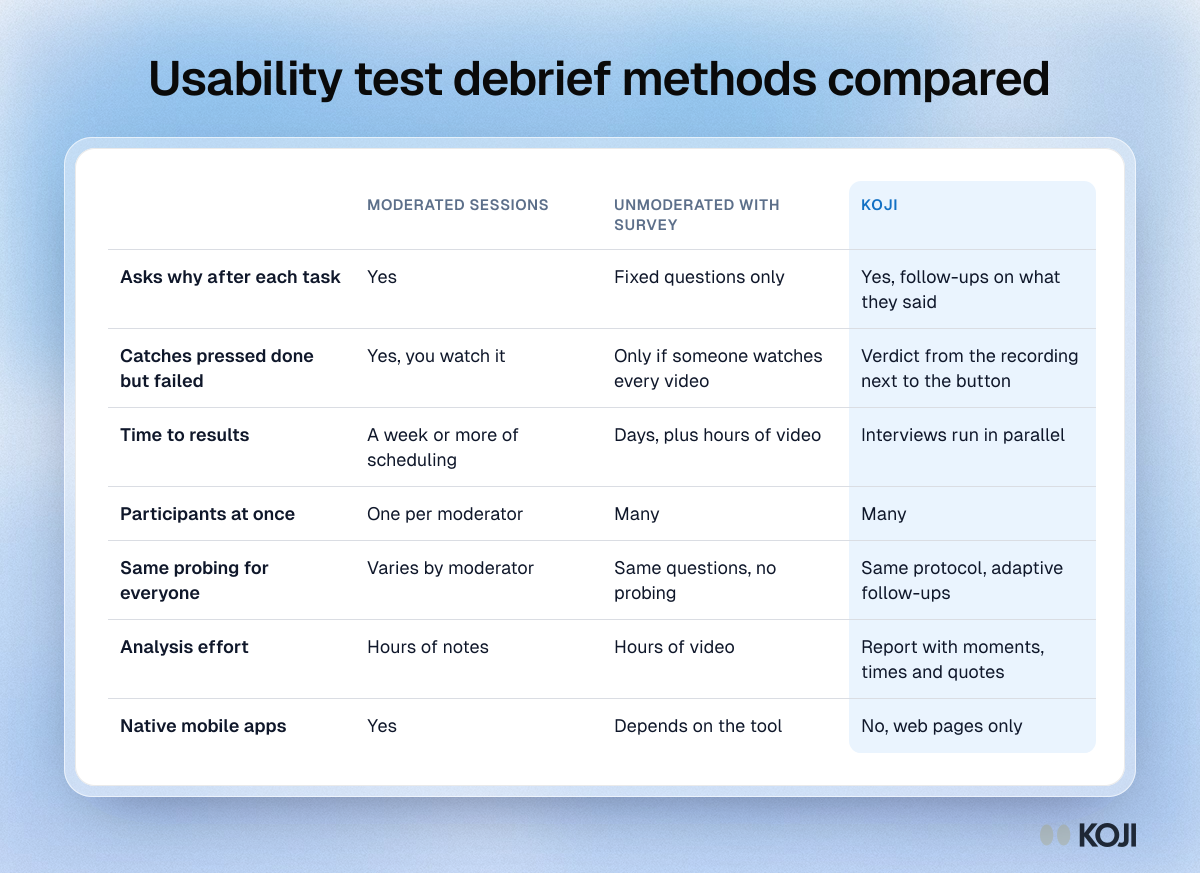
Comparison table of three ways to run a usability test debrief, Koji highlighted, on follow-ups, catching false successes, speed and analysis effort.

Reference table

Usability test debrief methods compared
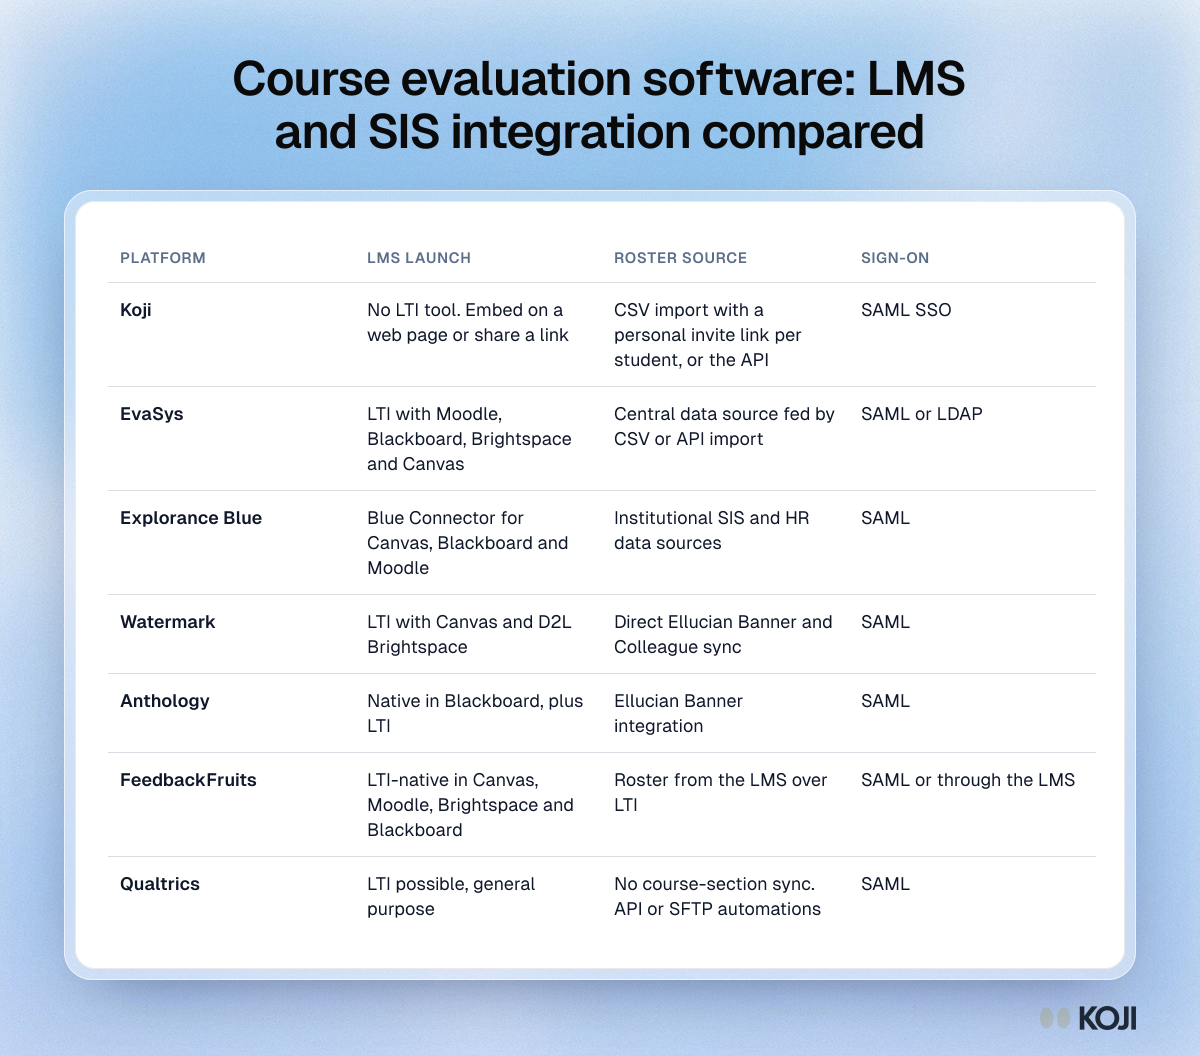
Table comparing how seven course evaluation tools reach students in the LMS, where their roster comes from and how users sign in.

Reference table

Course evaluation software: LMS and SIS integration compared
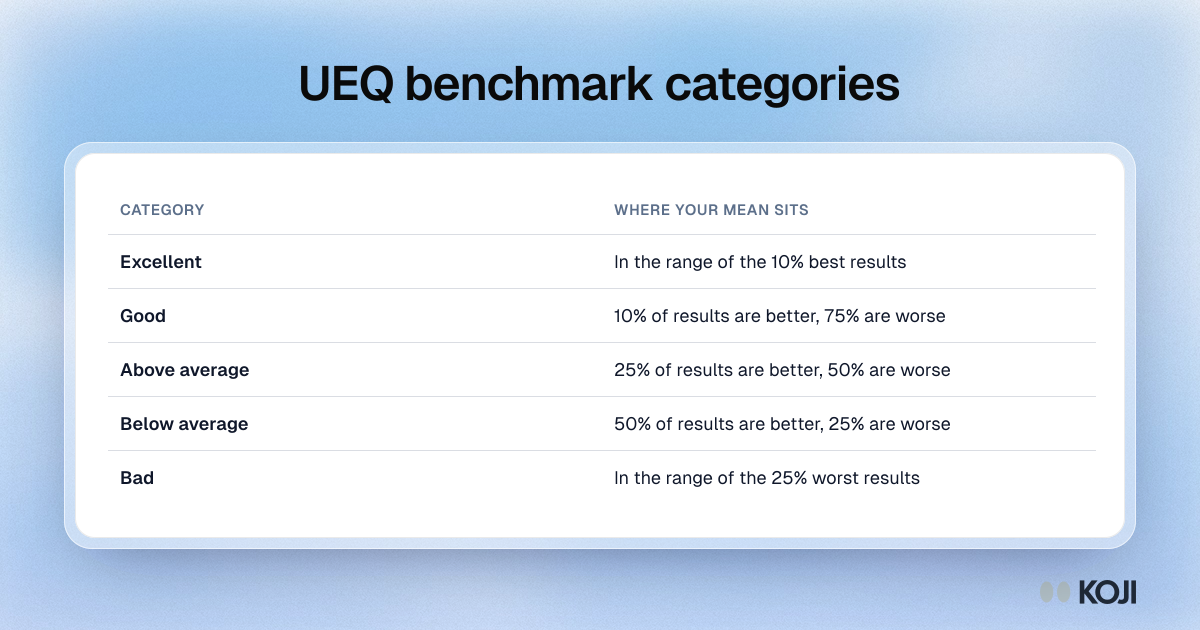
Table of the five UEQ benchmark categories, from excellent for the top 10% of results to bad for the bottom 25%.

Reference table

UEQ benchmark categories
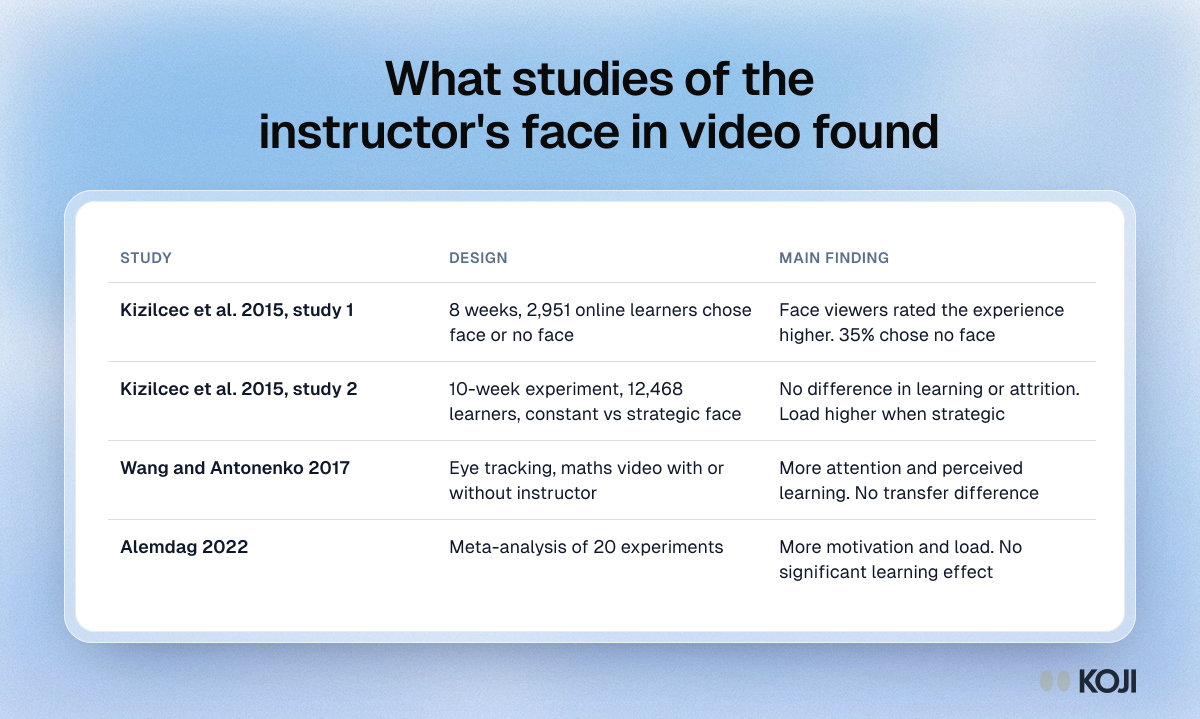
Table of four studies on the instructor's face in video lectures, with design and main finding: Kizilcec 2015, Wang and Antonenko 2017, Alemdag 2022.

Reference table

What studies of the instructor's face in video found
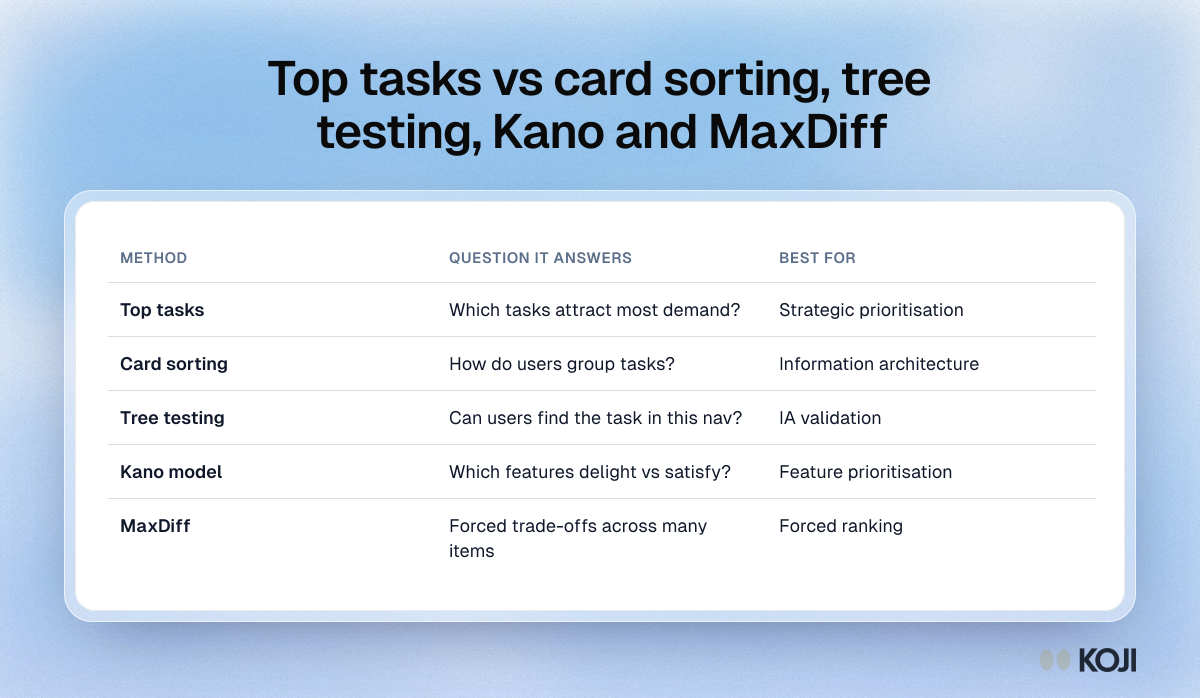
Table comparing top tasks, card sorting, tree testing, the Kano model and MaxDiff by the question each answers and what each is best for.

Reference table

Top tasks vs card sorting, tree testing, Kano and MaxDiff
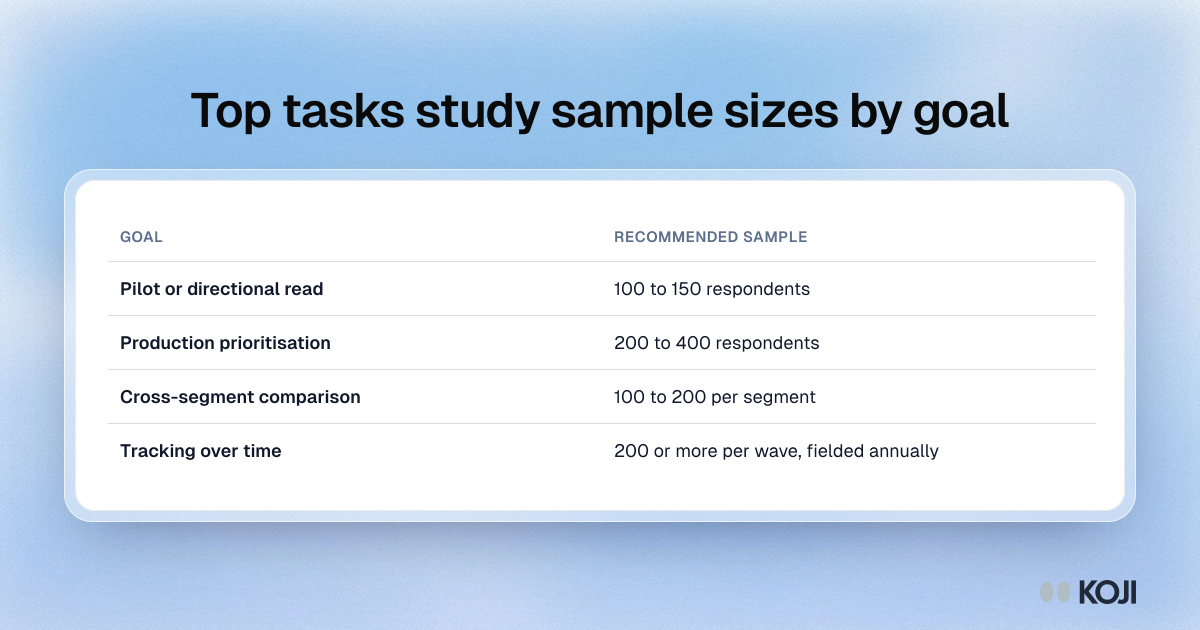
Table of recommended top tasks sample sizes: 100 to 150 for a pilot, 200 to 400 for prioritisation, 100 to 200 per segment, and 200 or more per yearly wave.

Reference table

Top tasks study sample sizes by goal
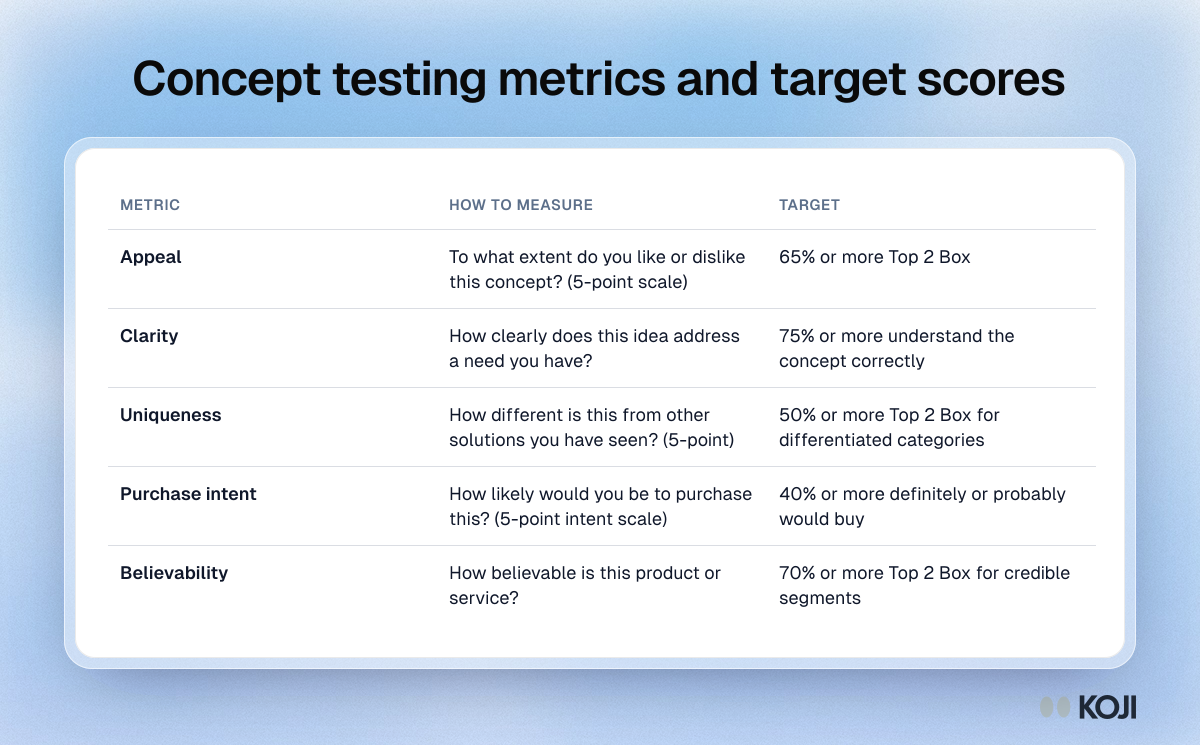
Table of five concept testing metrics, appeal, clarity, uniqueness, purchase intent and believability, with the question to ask and a target score for each.

Reference table

Concept testing metrics and target scores
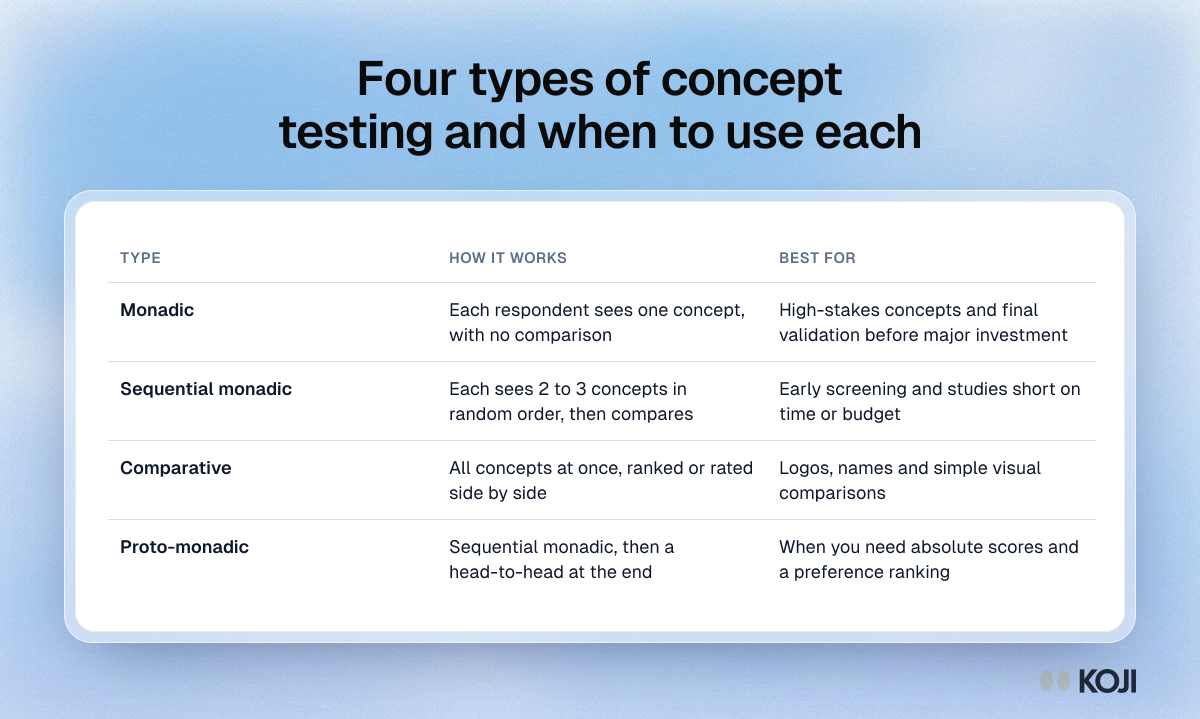
Table of four concept testing types, monadic, sequential monadic, comparative and proto-monadic, with how each works and what it suits best.

Reference table

Four types of concept testing and when to use each
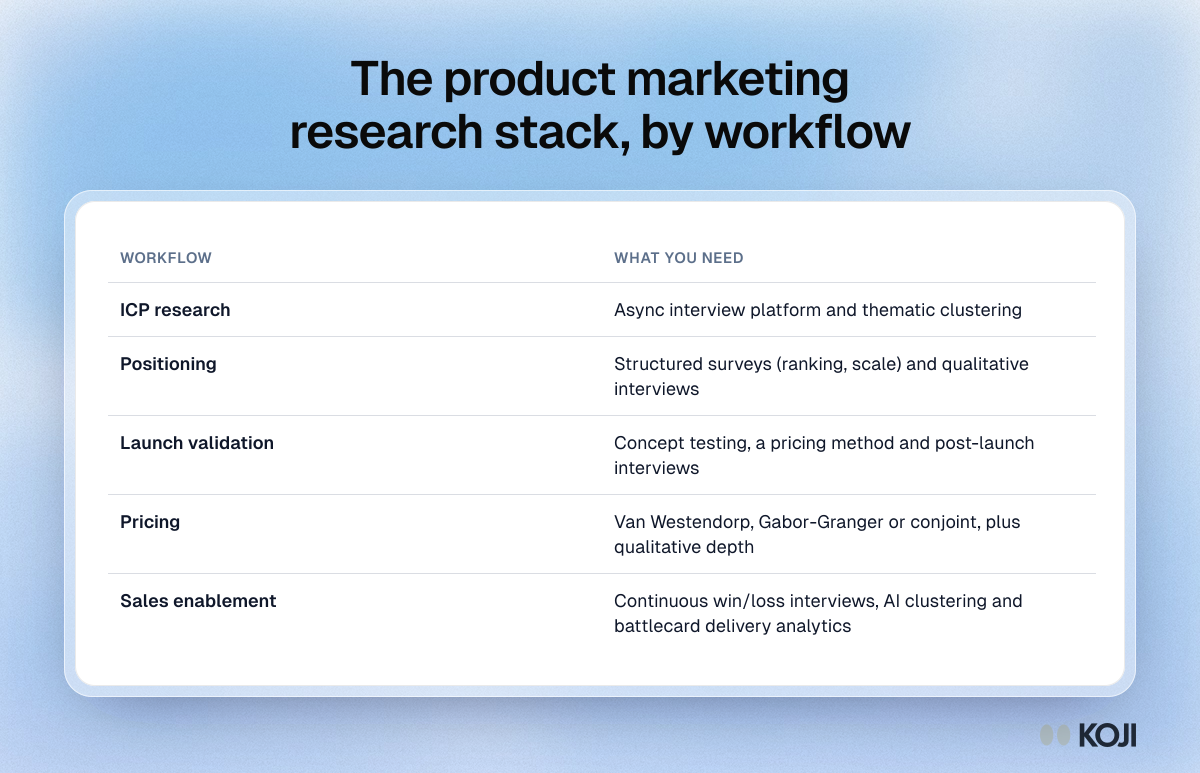
Table of the research a product marketer needs for each workflow: ICP, positioning, launch validation, pricing and sales enablement.

Reference table

The product marketing research stack, by workflow
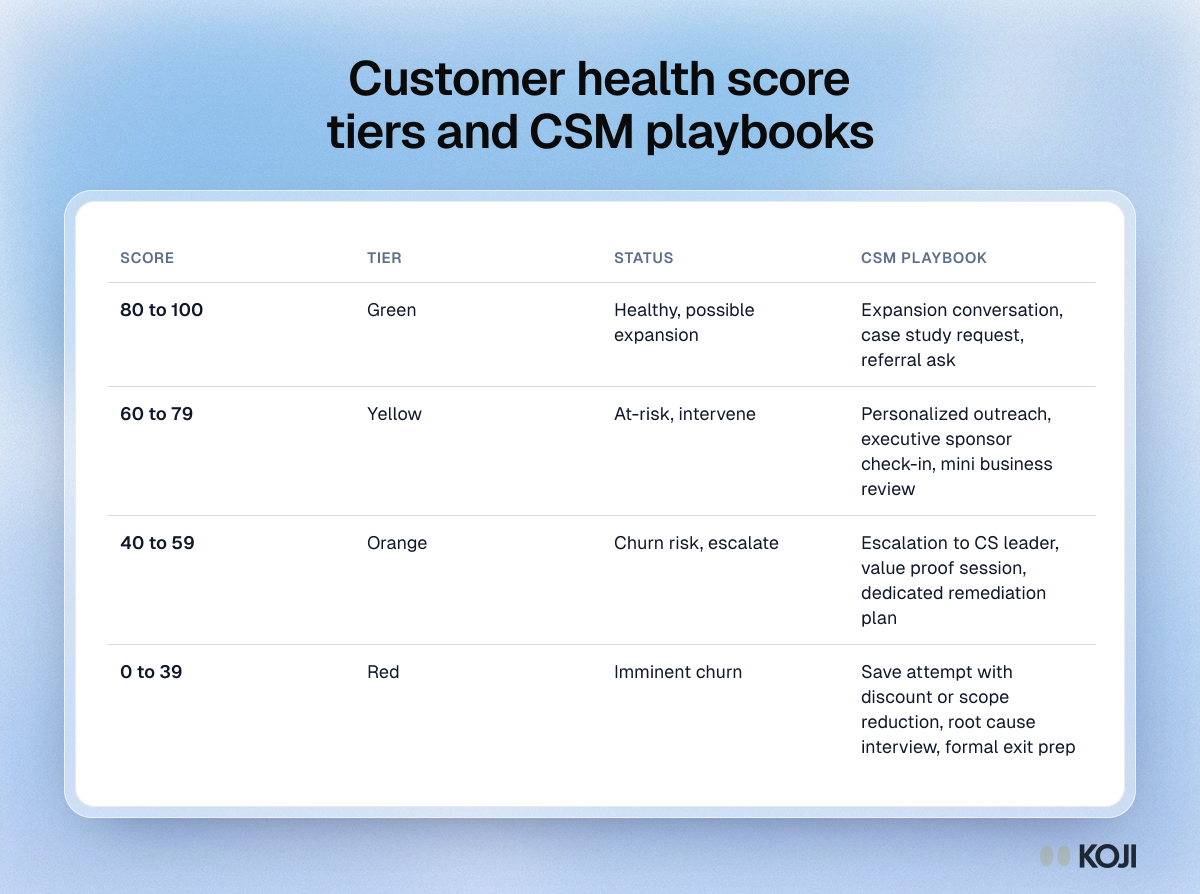
Table of customer health score tiers: green 80 to 100, yellow 60 to 79, orange 40 to 59 and red 0 to 39, each with its status and the CSM playbook to run.

Reference table

Customer health score tiers and CSM playbooks
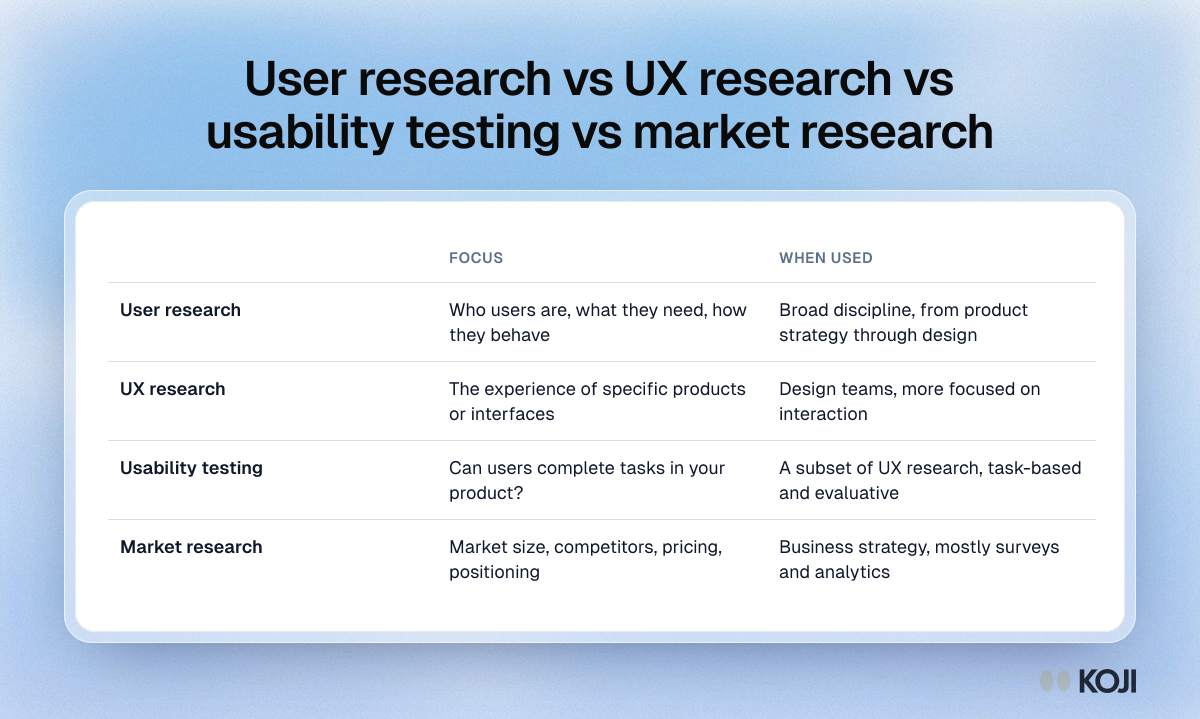
Table comparing user research, UX research, usability testing and market research by what each focuses on and when teams use it.

Reference table

User research vs UX research vs usability testing vs market research
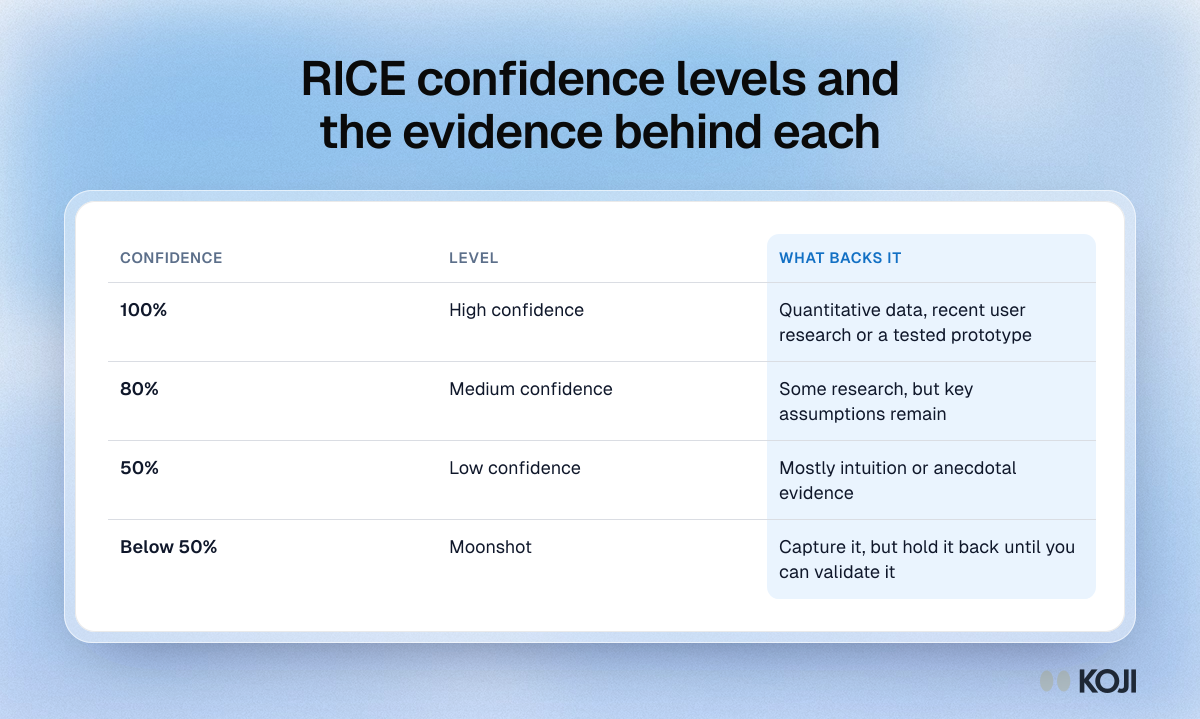
Table of RICE confidence levels: 100% high, 80% medium, 50% low and below 50% a moonshot, with the kind of evidence each level needs.

Reference table

RICE confidence levels and the evidence behind each
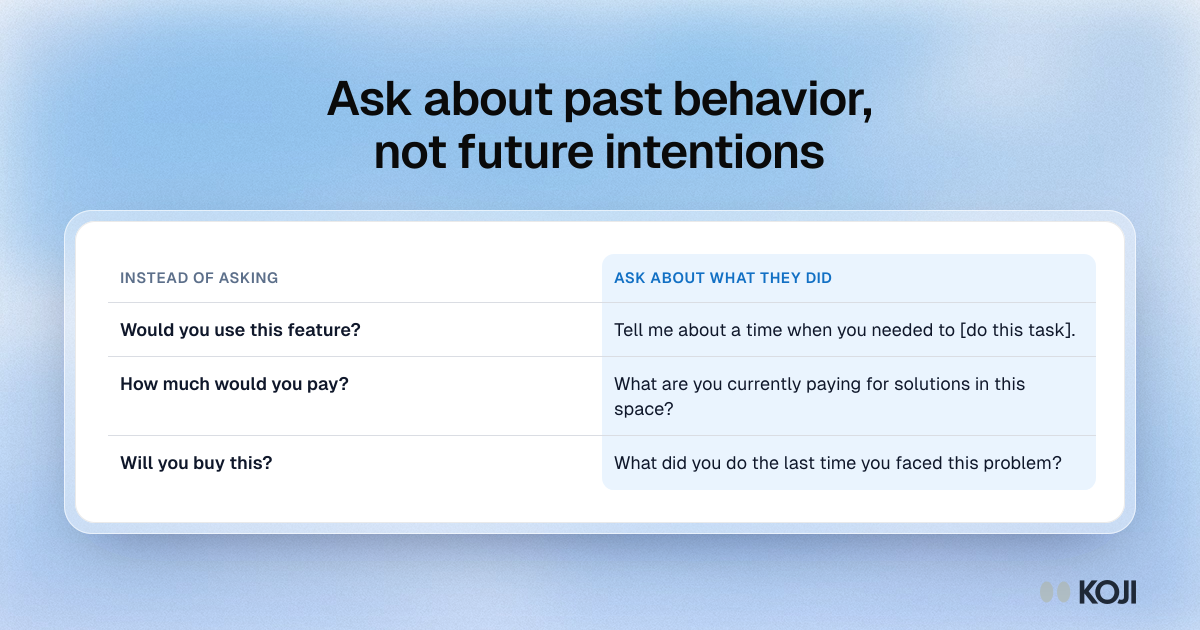
Table rewriting three hypothetical interview questions, about using a feature, paying and buying, as questions about what the customer actually did.

Reference table

Ask about past behavior, not future intentions
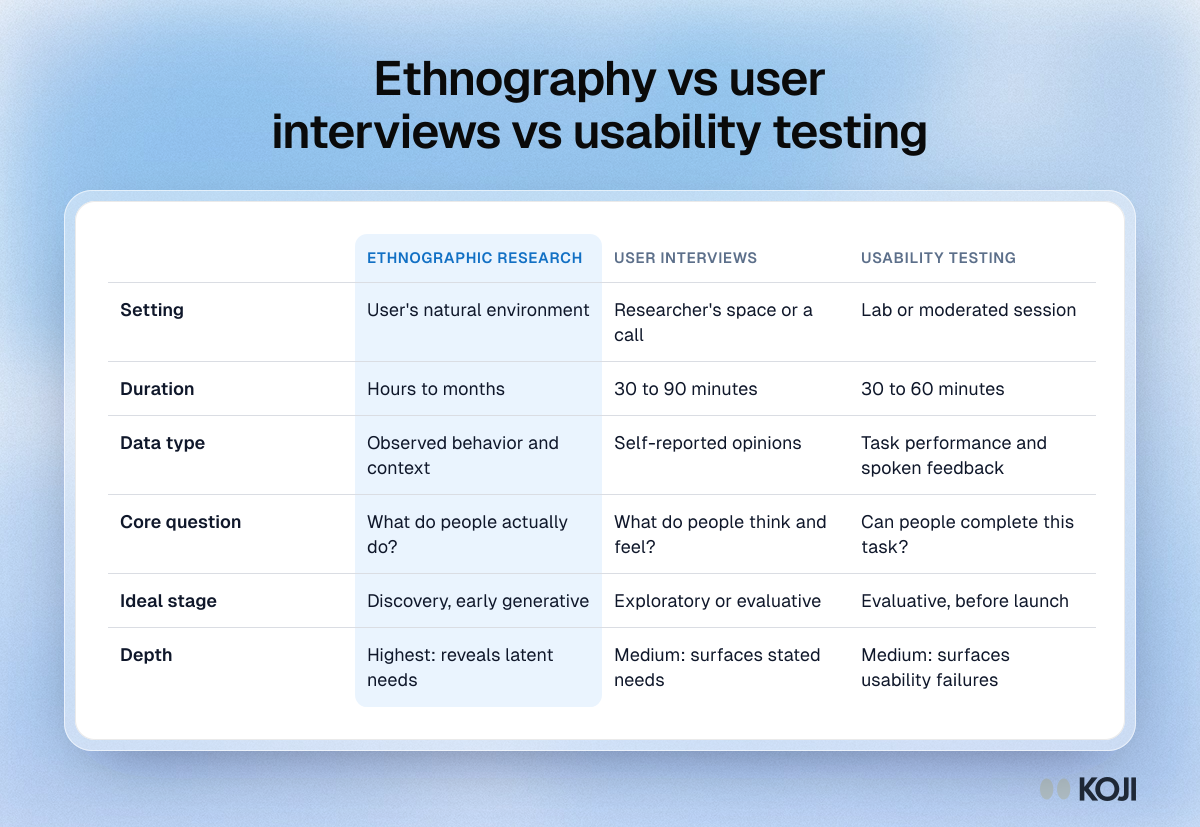
Table comparing ethnographic research, user interviews and usability testing on setting, duration, data type, core question, ideal stage and depth.

Reference table

Ethnography vs user interviews vs usability testing
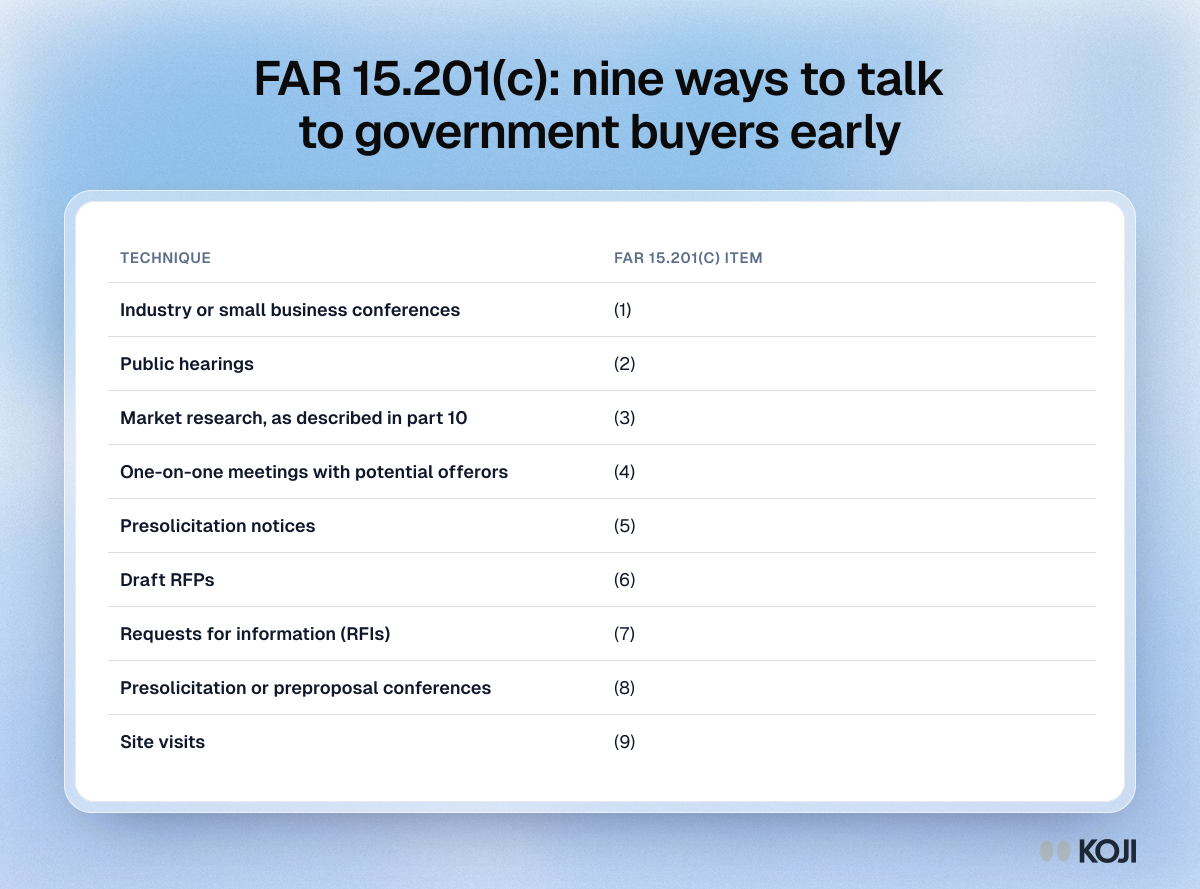
Table of the nine early exchange techniques in FAR 15.201(c), from industry conferences and one-on-one meetings to draft RFPs, RFIs and site visits.

Reference table

FAR 15.201(c): nine ways to talk to government buyers early
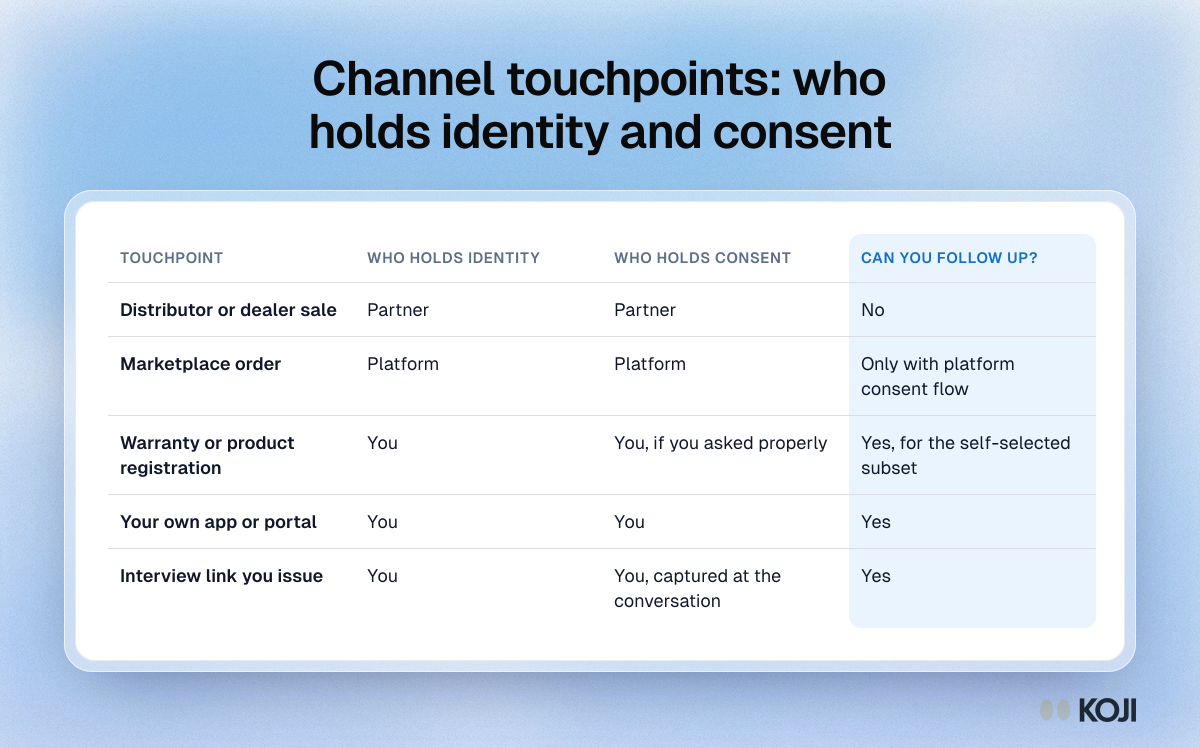
Table of five channel touchpoints, from a distributor sale to an interview link you issue, showing who holds identity and consent and if you can follow up.

Reference table

Channel touchpoints: who holds identity and consent
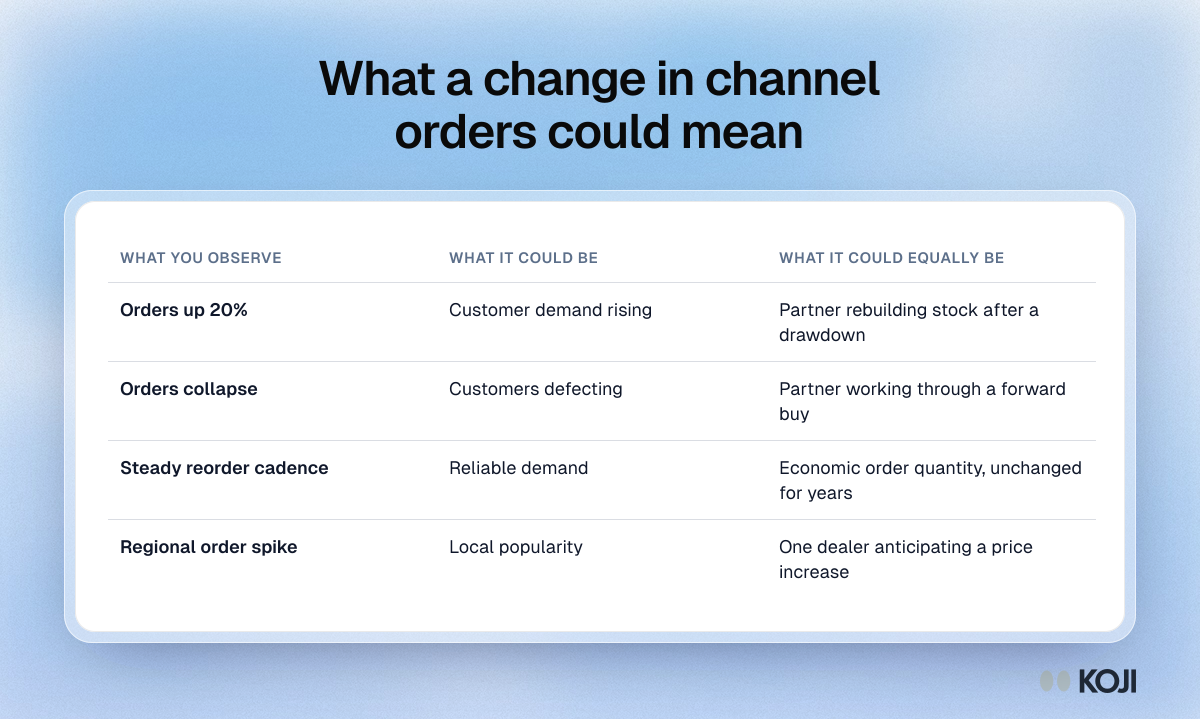
Table of four channel order signals, such as orders up 20% or a regional spike, each with a demand reading and an equally likely stocking reading.

Reference table

What a change in channel orders could mean
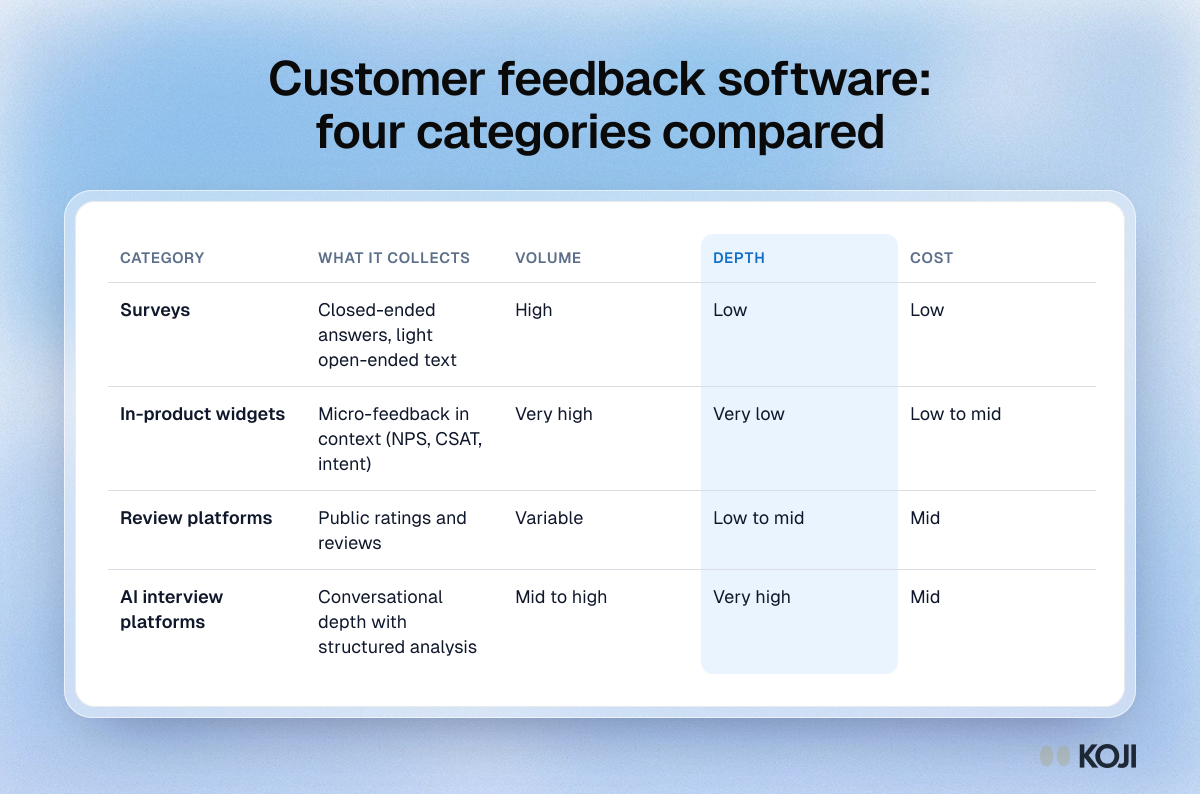
Table comparing surveys, in-product widgets, review platforms and AI interview platforms by what they collect, volume, depth and cost.

Reference table

Customer feedback software: four categories compared
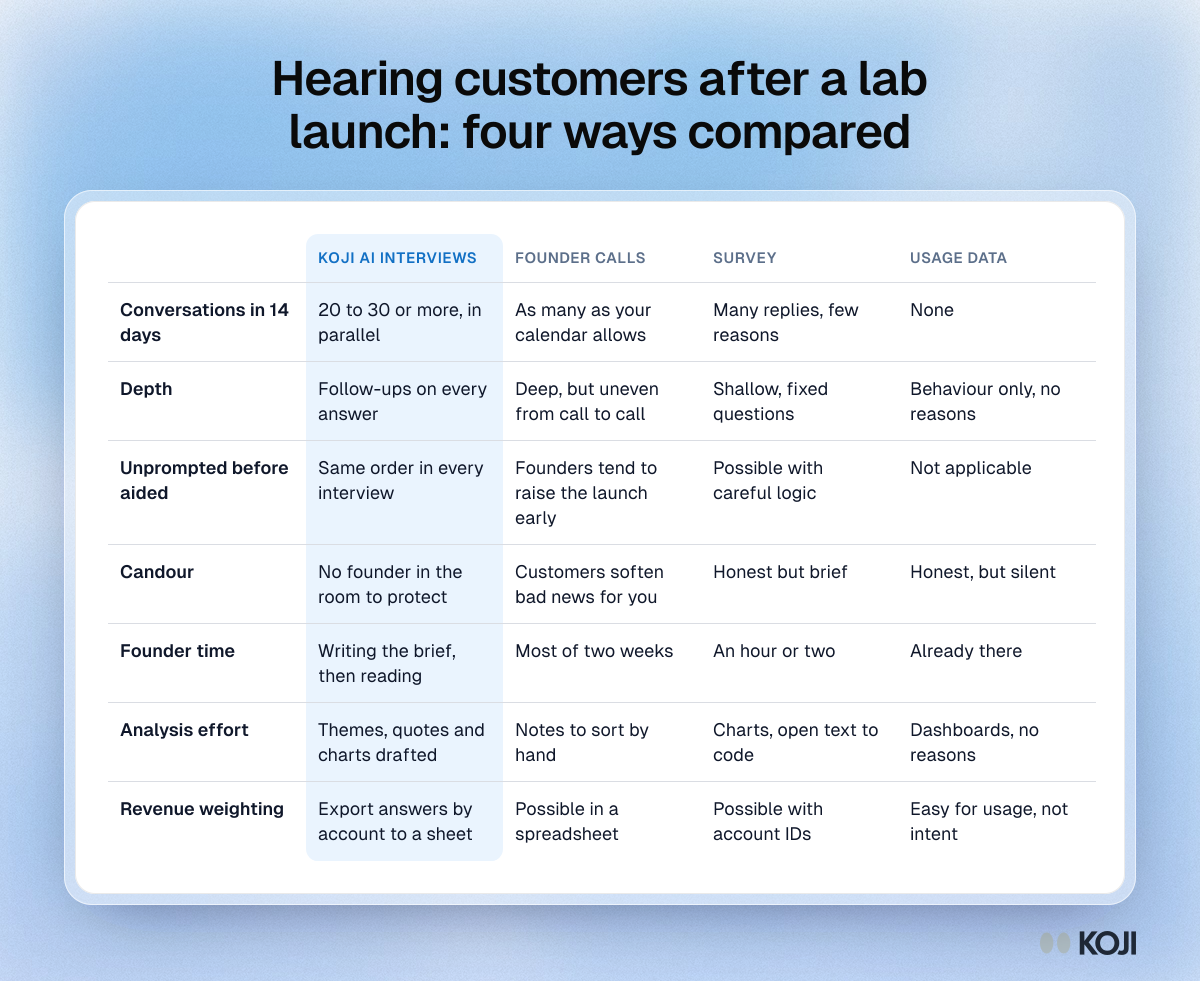
Table comparing Koji AI interviews, founder calls, surveys and usage data for hearing customers in the 14 days after a lab launch

Reference table

Hearing customers after a lab launch: four ways compared
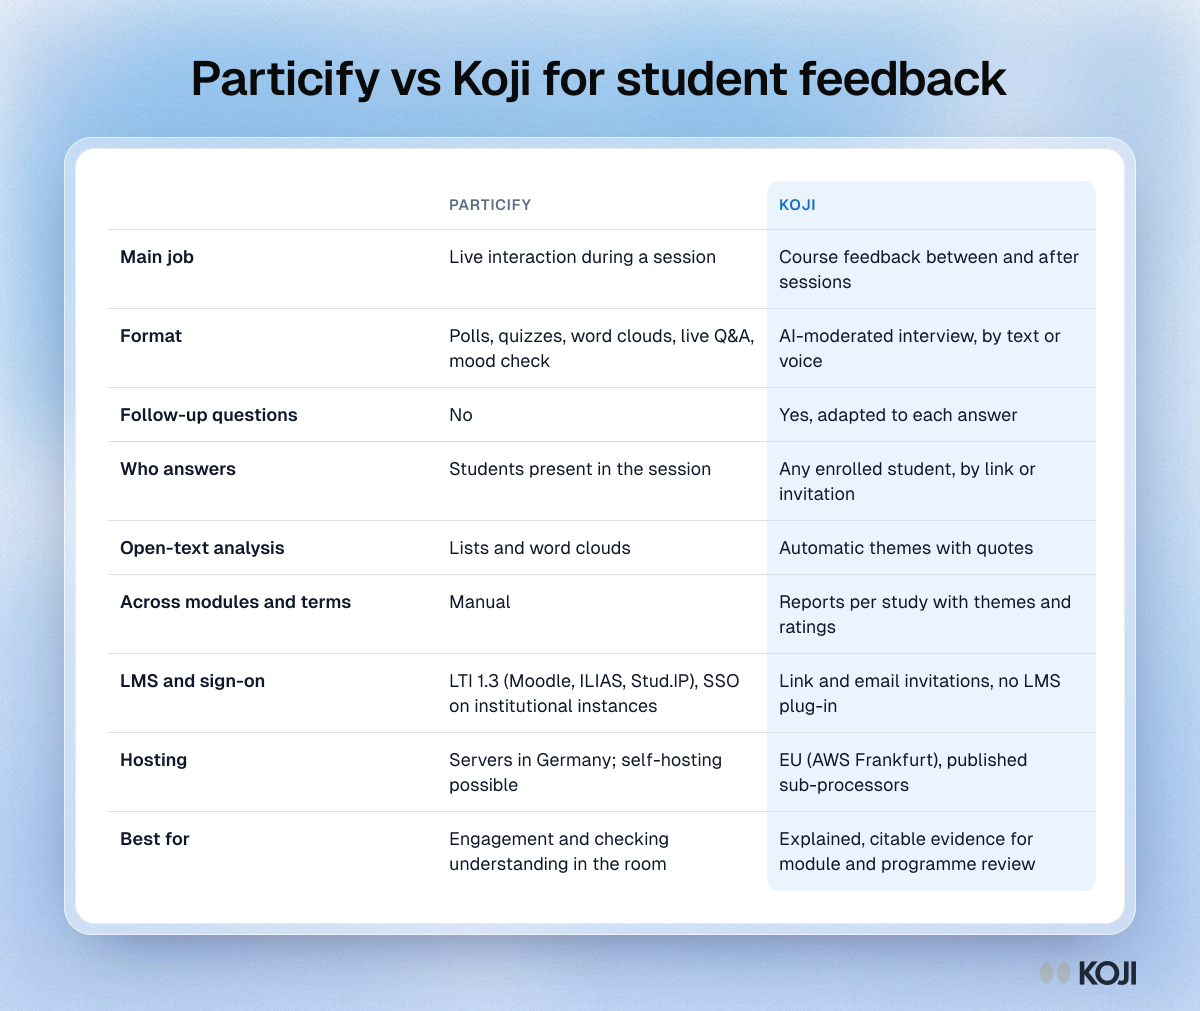
Comparison table of Particify and Koji: main job, format, follow-up questions, who answers, analysis, LMS integration, hosting and best fit.

Reference table

Particify vs Koji for student feedback
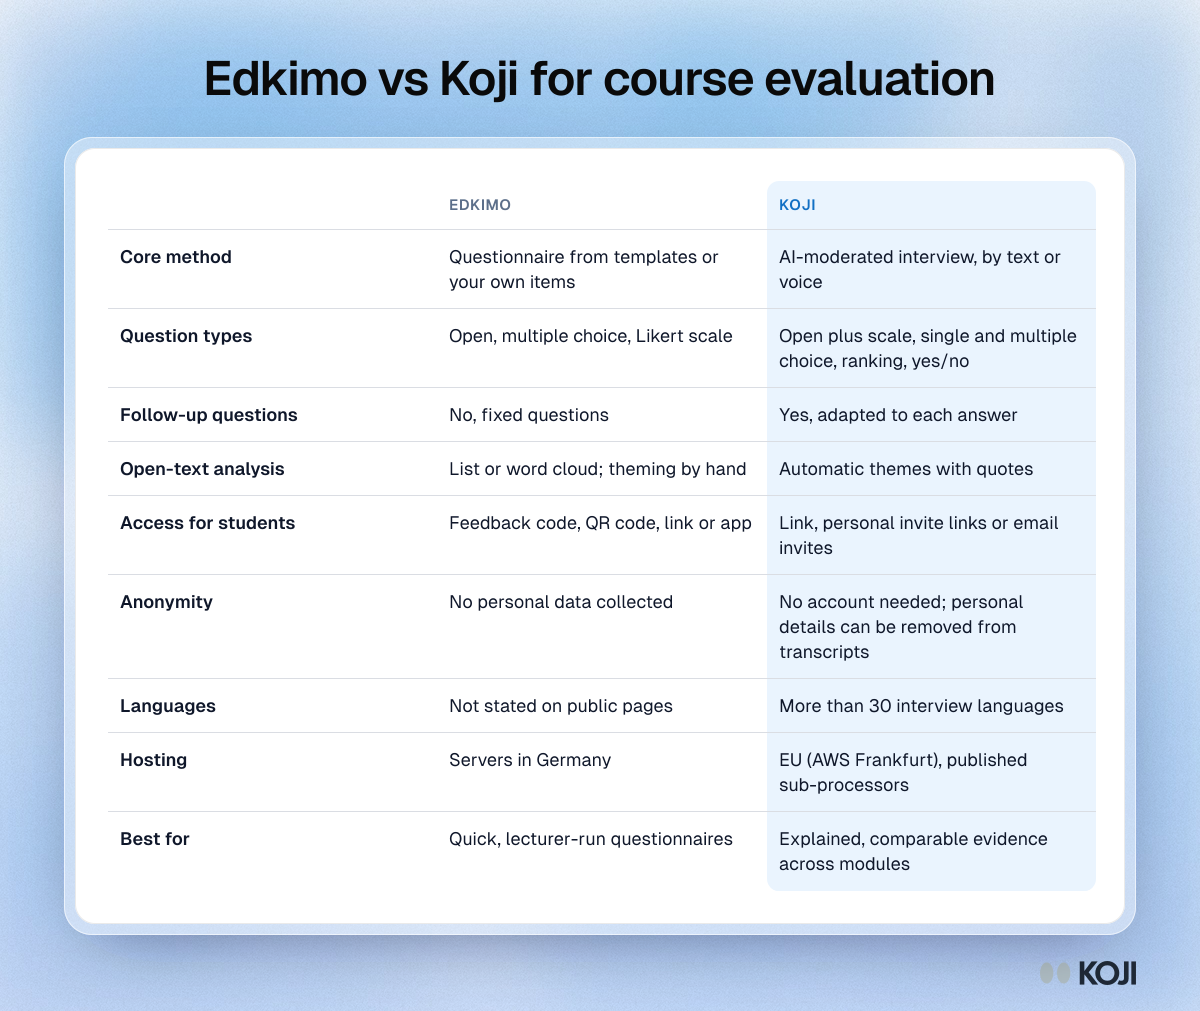
Comparison table of Edkimo and Koji for course evaluation, covering method, follow-up questions, open-text analysis, access, hosting and best fit.

Reference table

Edkimo vs Koji for course evaluation
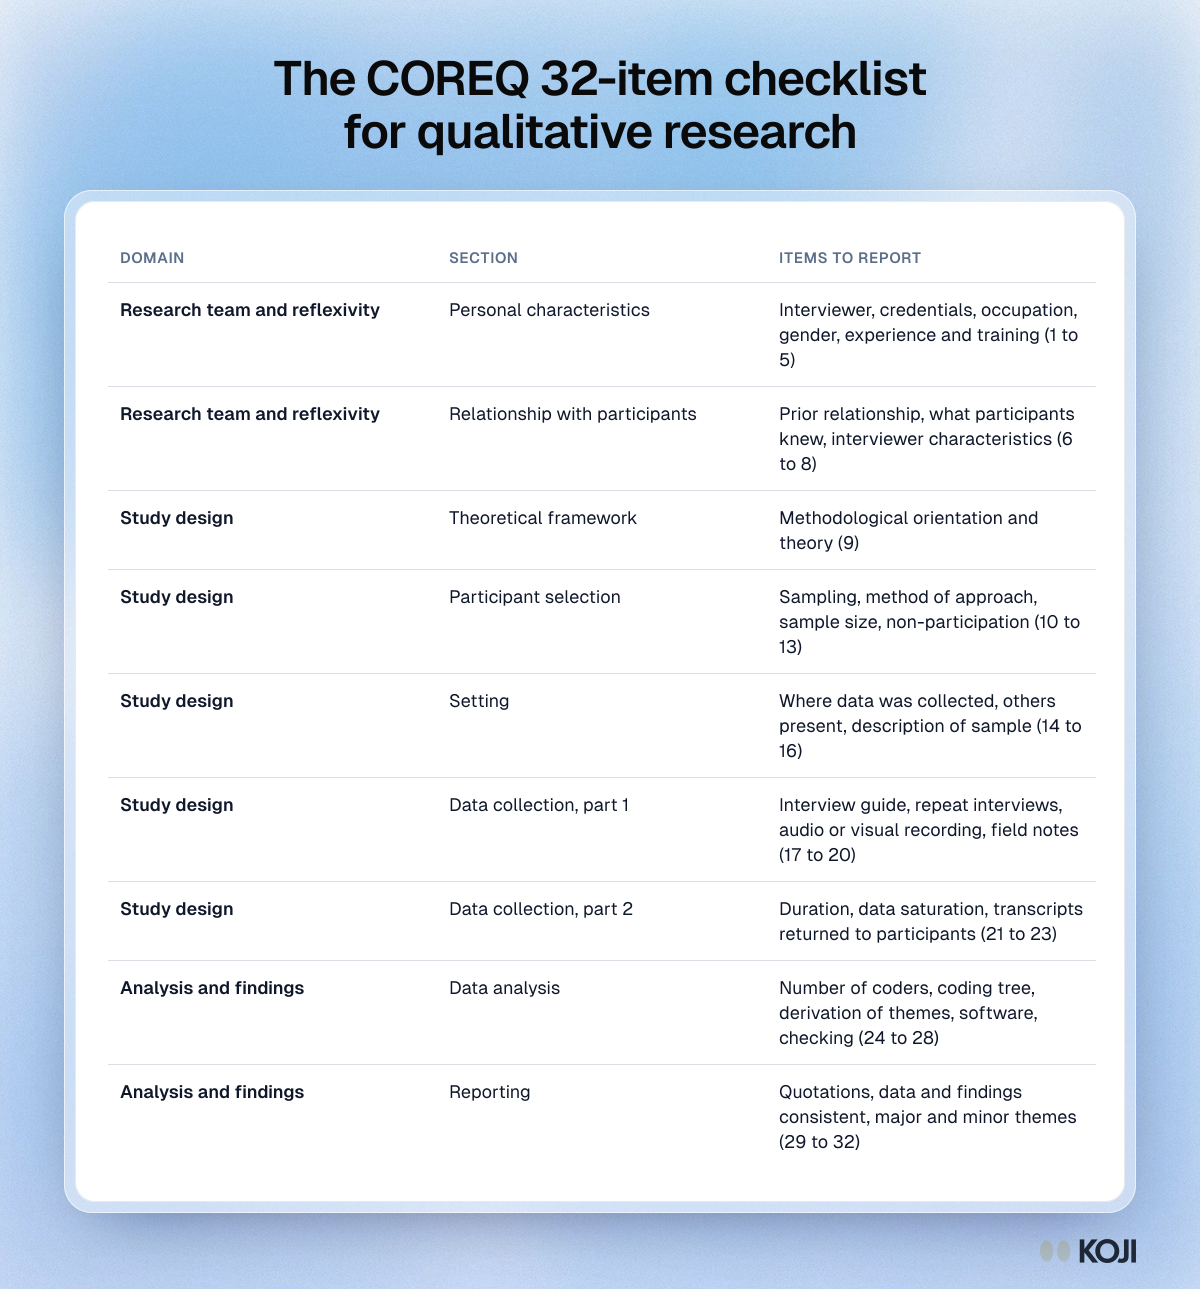
Table of the 32 COREQ items grouped into three domains: research team and reflexivity, study design, and analysis and findings.

Reference table

The COREQ 32-item checklist for qualitative research
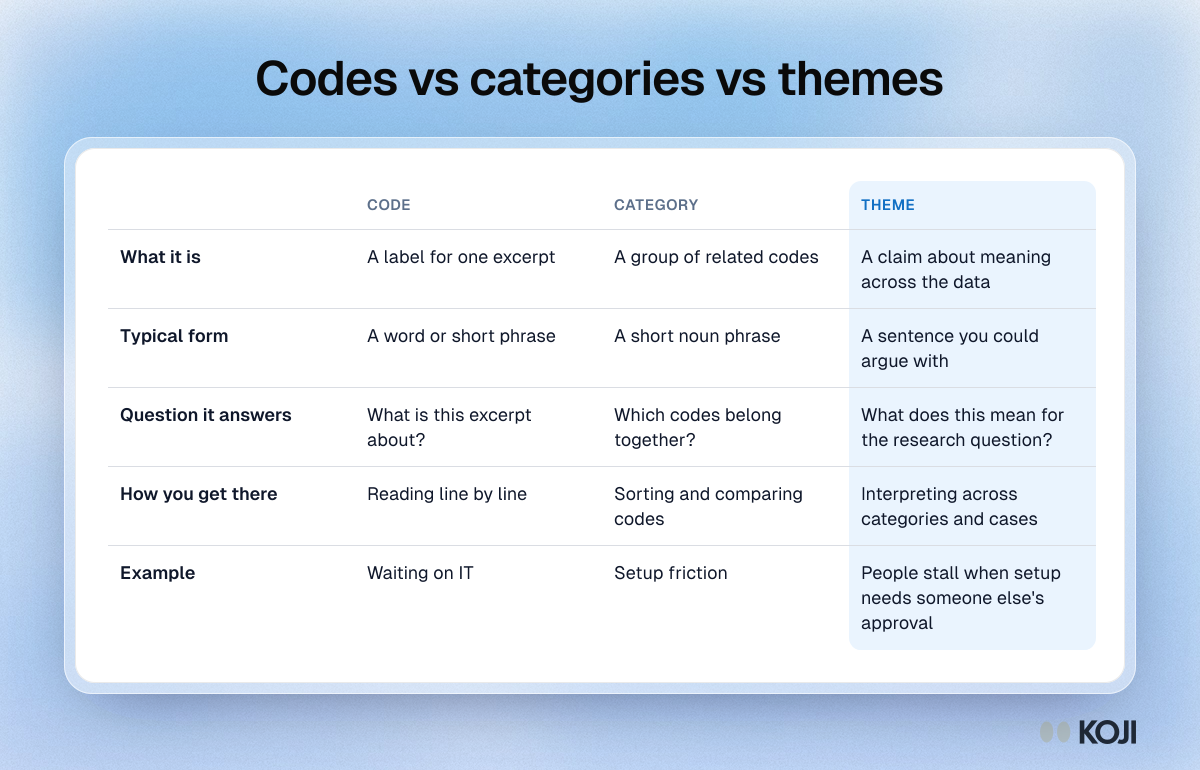
Table comparing codes, categories and themes by what each is, its typical form, the question it answers, how you get there and an example.

Reference table

Codes vs categories vs themes
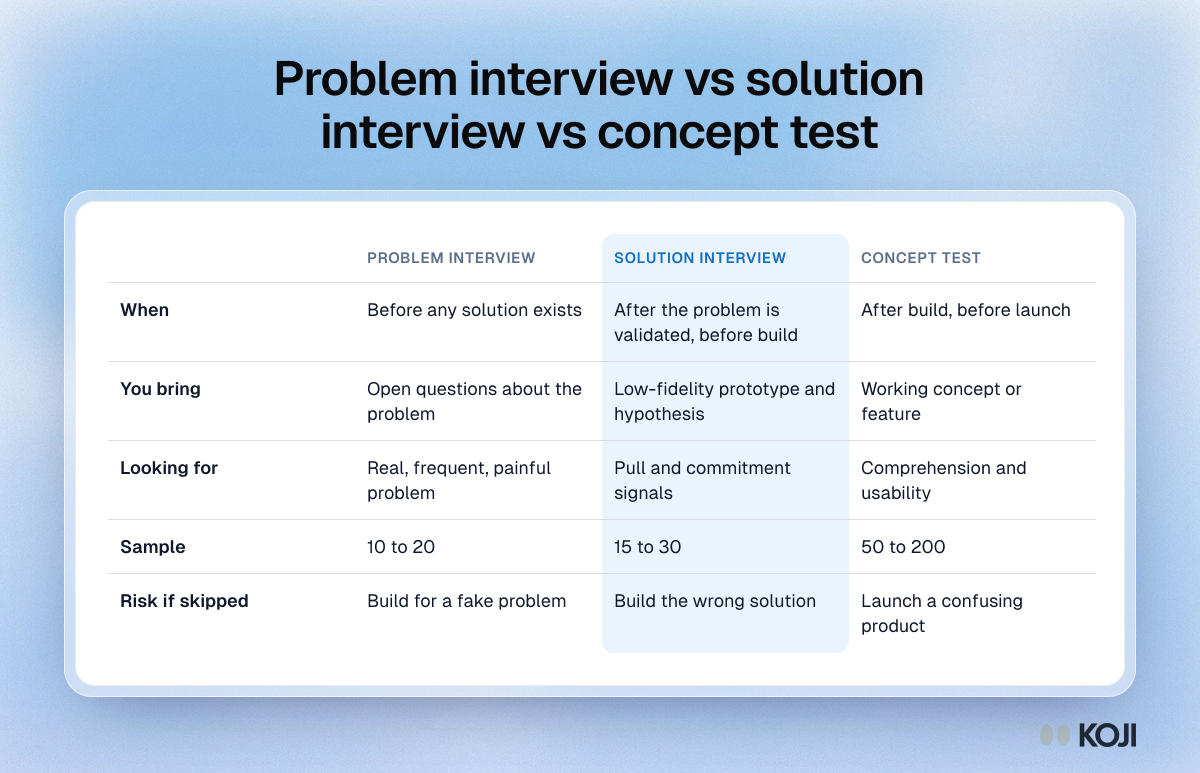
Table comparing problem interviews, solution interviews and concept tests by timing, what you bring, what you look for, sample size and risk if skipped.

Reference table

Problem interview vs solution interview vs concept test
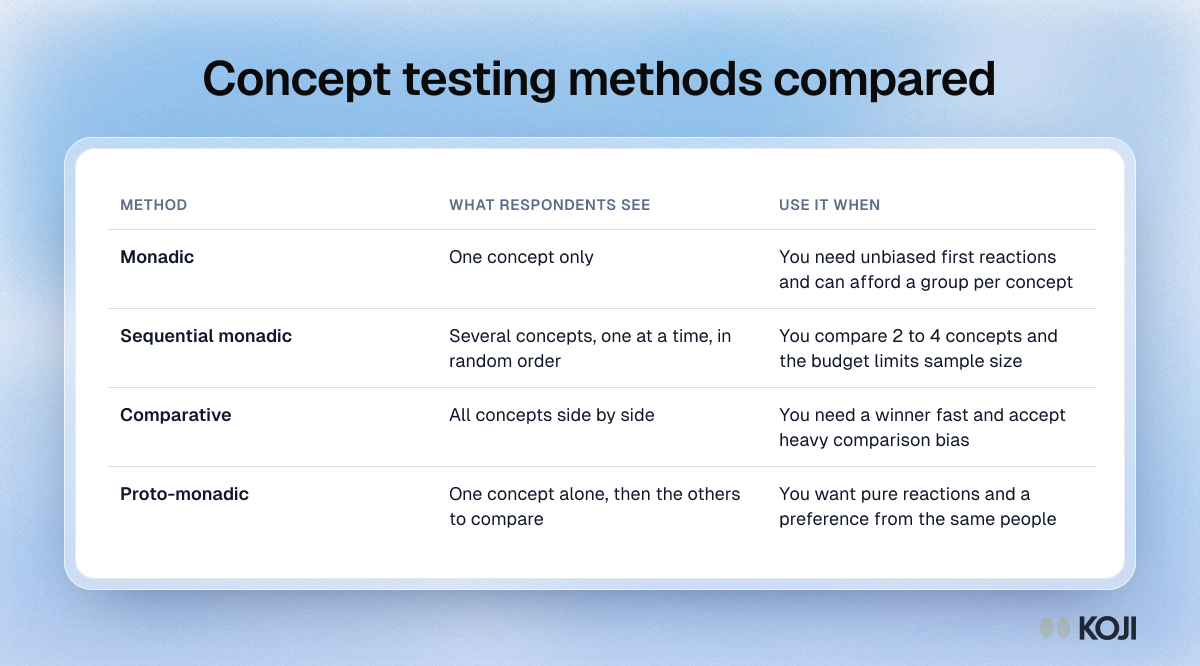
Table comparing four concept testing methods, monadic, sequential monadic, comparative and proto-monadic, by what respondents see and when to use each.

Reference table

Concept testing methods compared
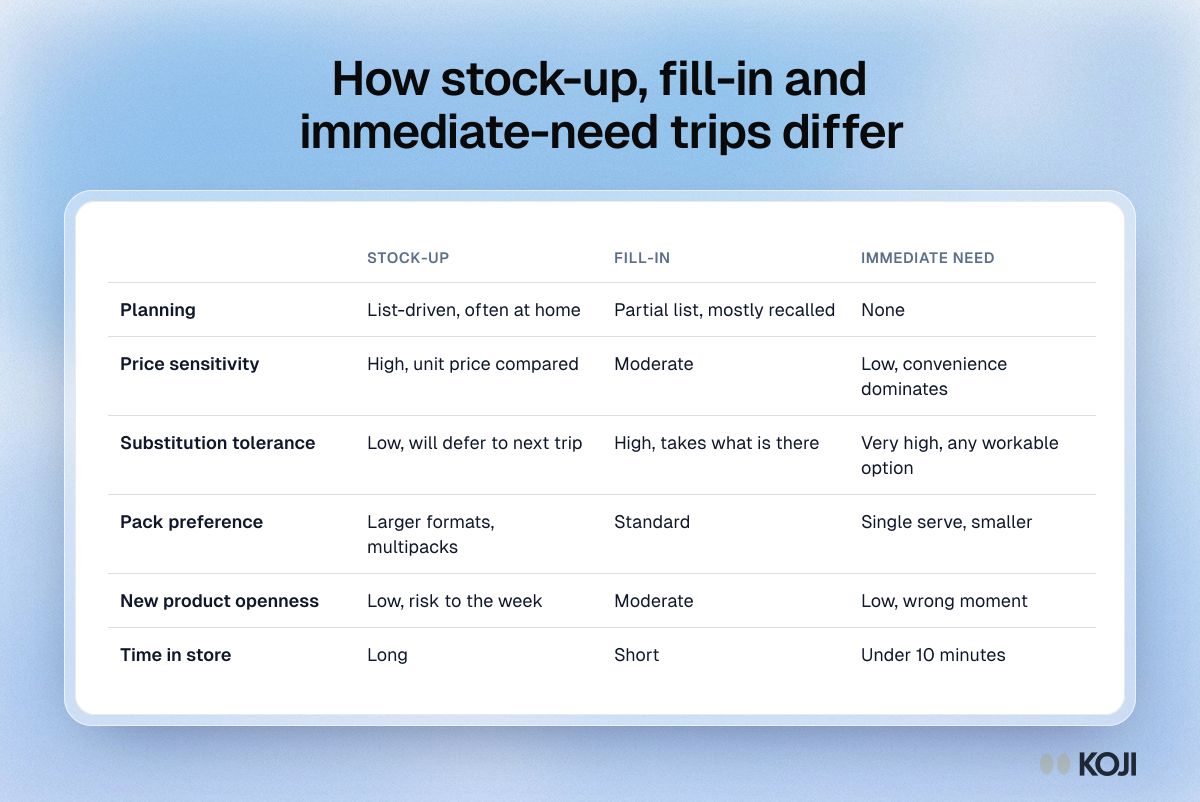
Table comparing stock-up, fill-in and immediate-need shopping trips on planning, price sensitivity, substitution, pack size, new products and time in store.

Reference table

How stock-up, fill-in and immediate-need trips differ
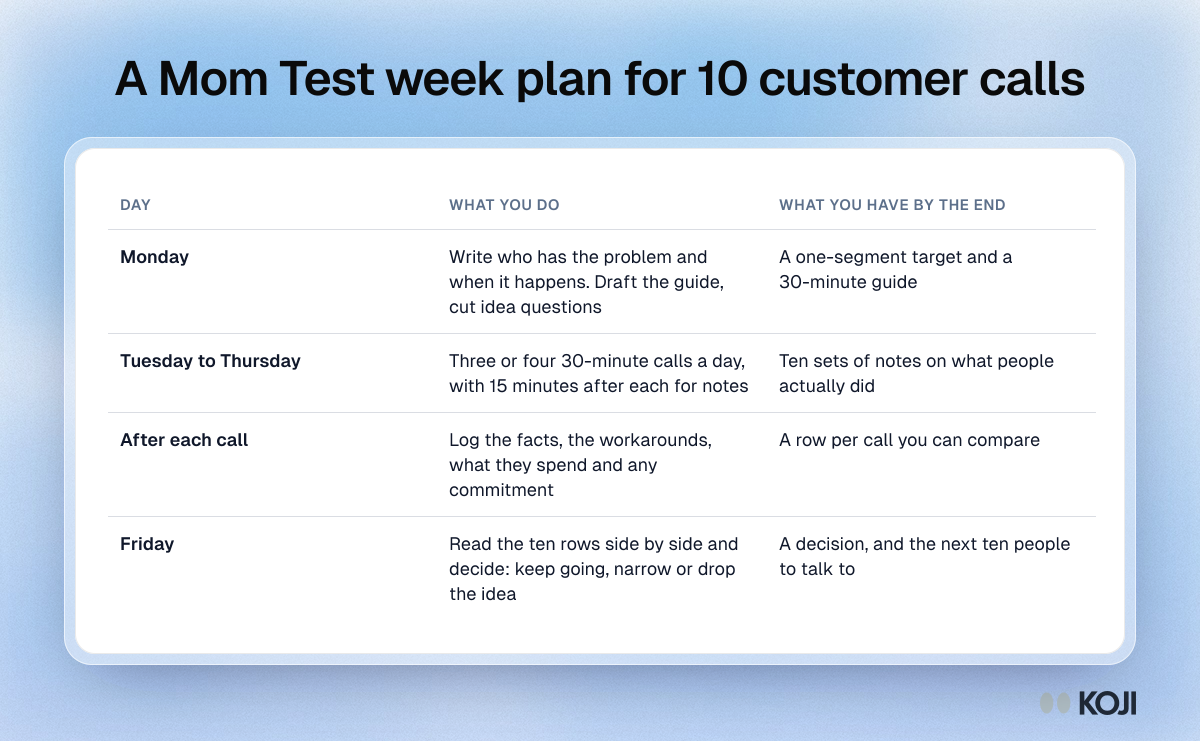
Table of a week plan for ten Mom Test customer calls: prepare on Monday, call Tuesday to Thursday, log each call and decide on Friday.

Reference table

A Mom Test week plan for 10 customer calls
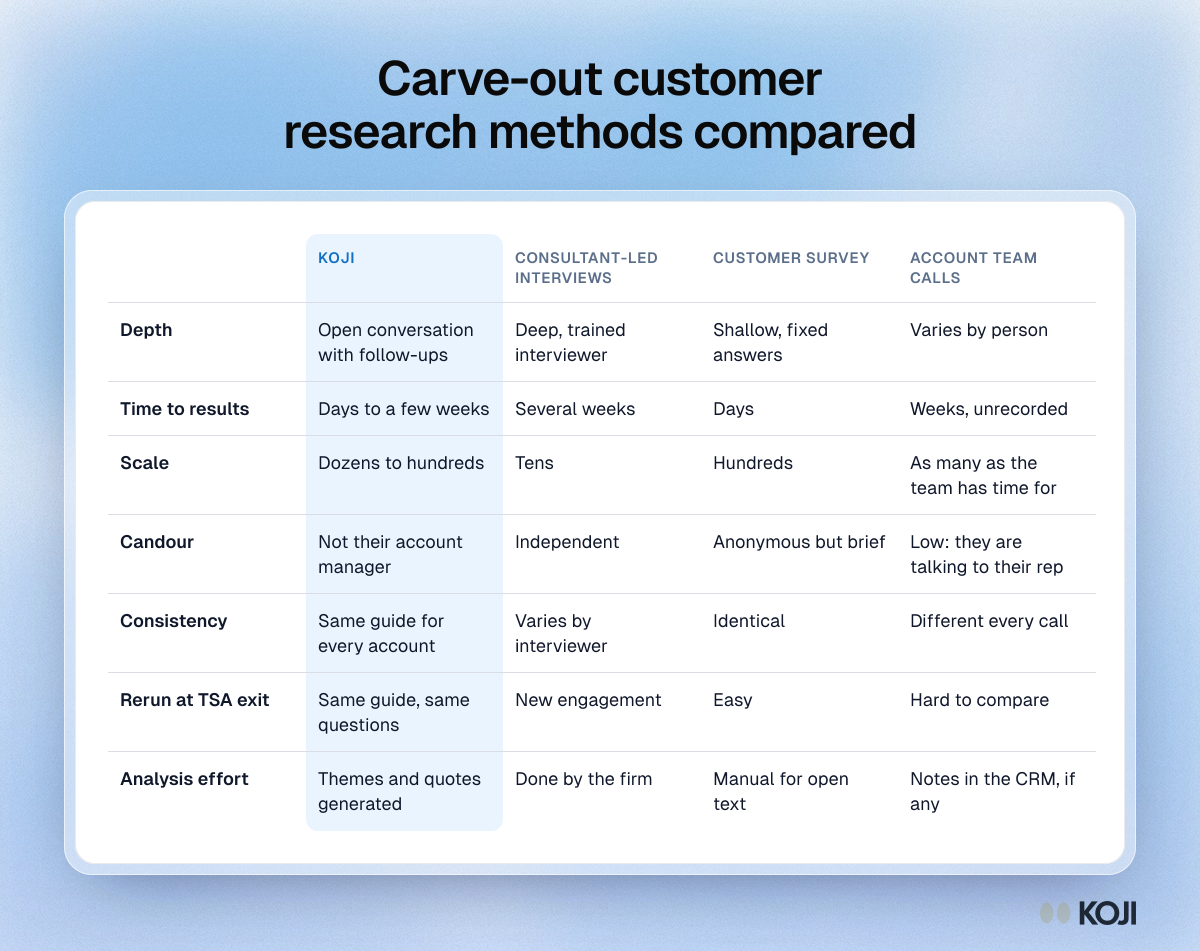
Table comparing Koji with consultant-led interviews, a customer survey and account team calls for carve-out customer research

Reference table

Carve-out customer research methods compared
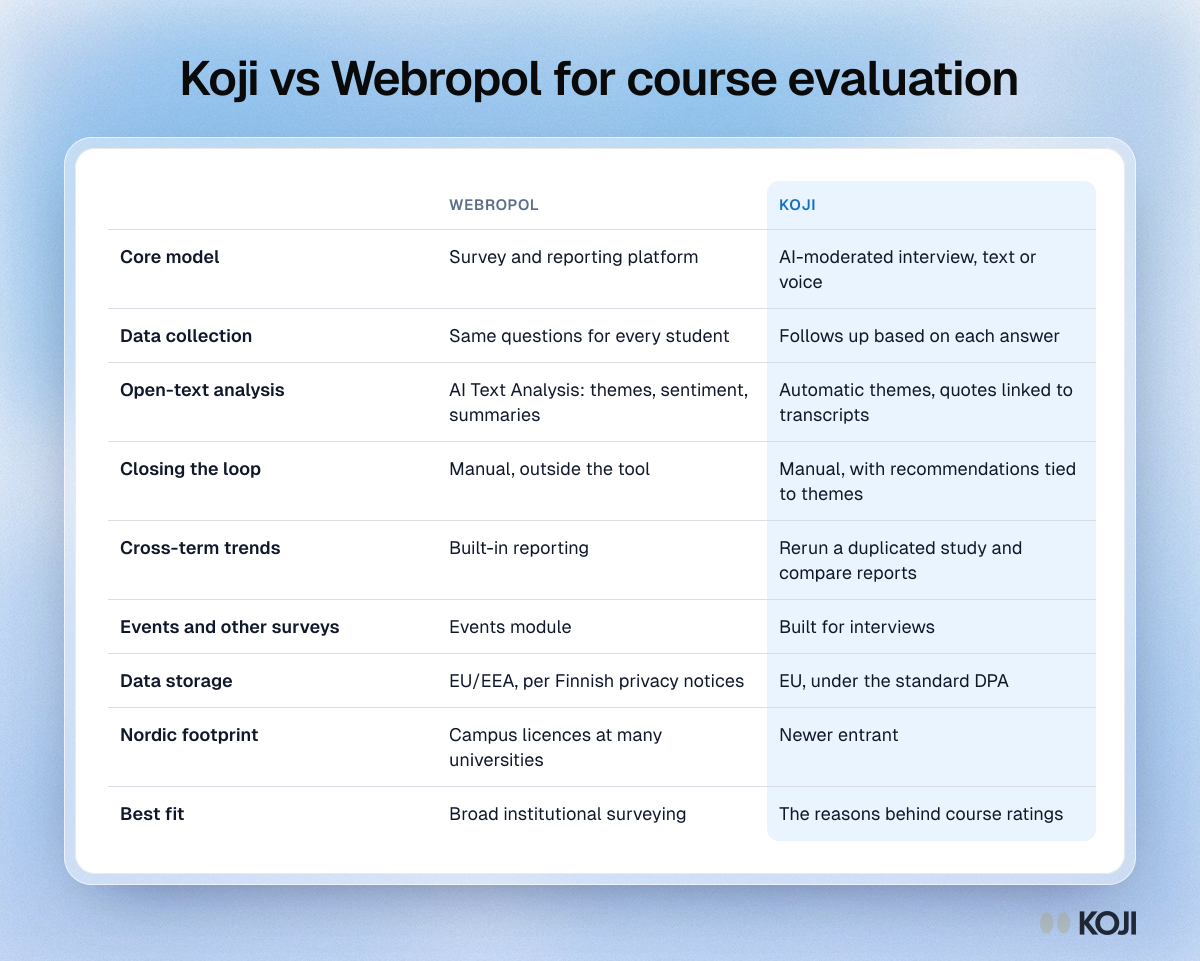
Comparison table of Koji and Webropol for course evaluation across data collection, open-text analysis, closing the loop and data residency.

Reference table

Koji vs Webropol for course evaluation
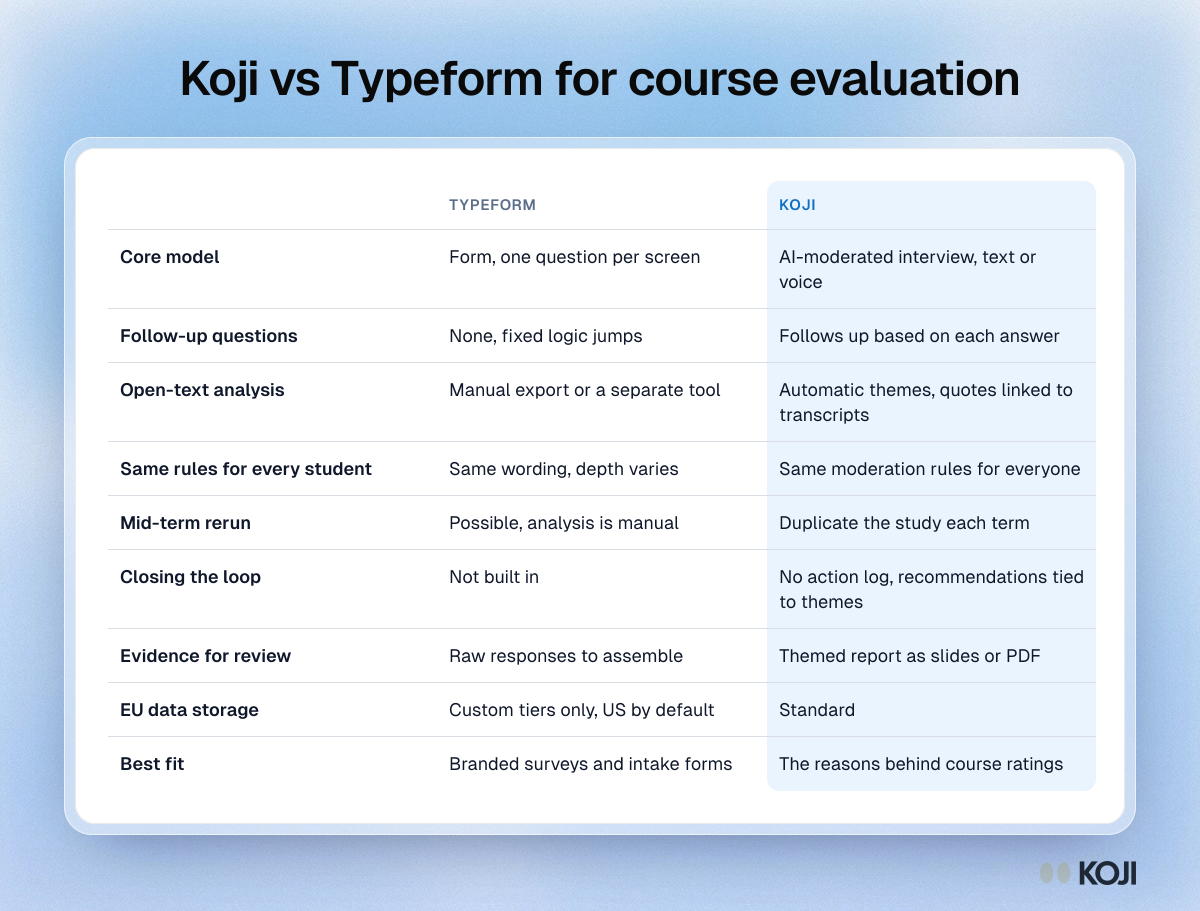
Comparison table of Koji and Typeform for course evaluation across follow-up probing, analysis, closing the loop and EU data storage.

Reference table

Koji vs Typeform for course evaluation
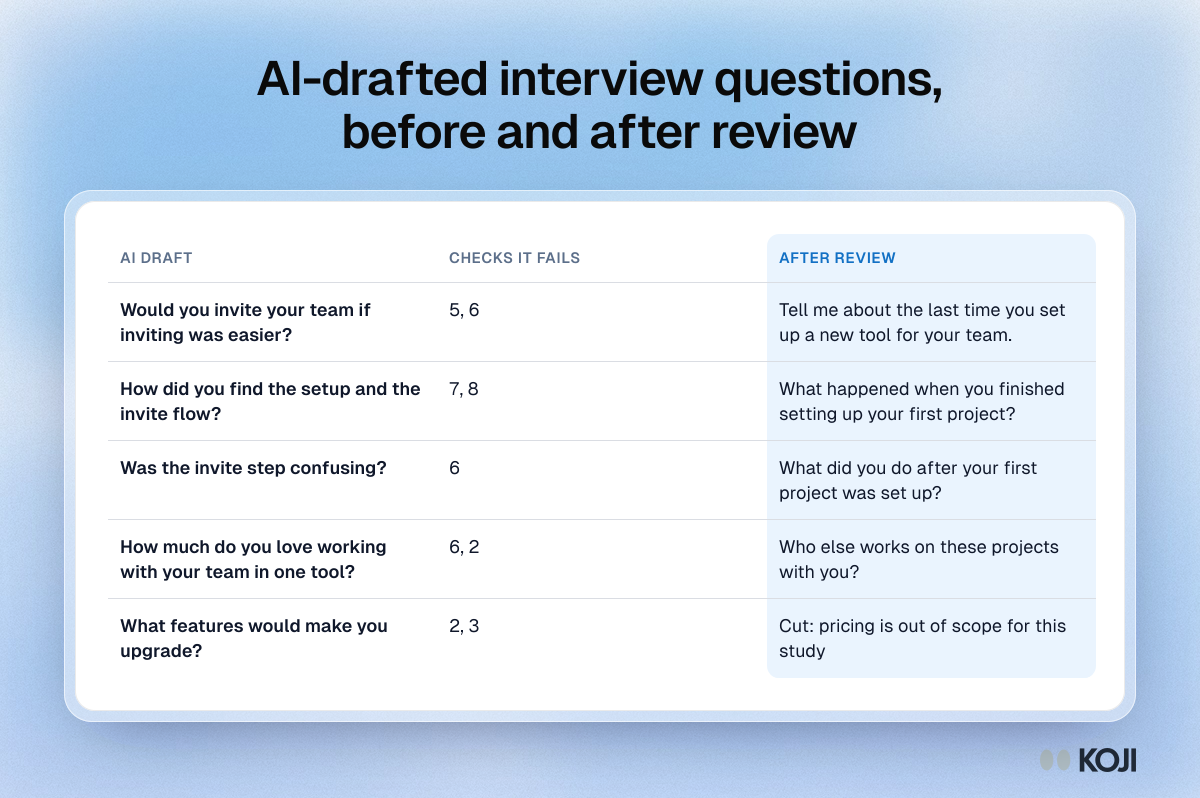
Table of five AI-drafted interview questions about trial users, the review checks each one fails and the rewritten question after review.

Reference table

AI-drafted interview questions, before and after review