Free to save and share

Frameworks and cheat sheets for customer research

Every framework, checklist and comparison from our guides, as an image you can download, drop into a deck or share with your team.
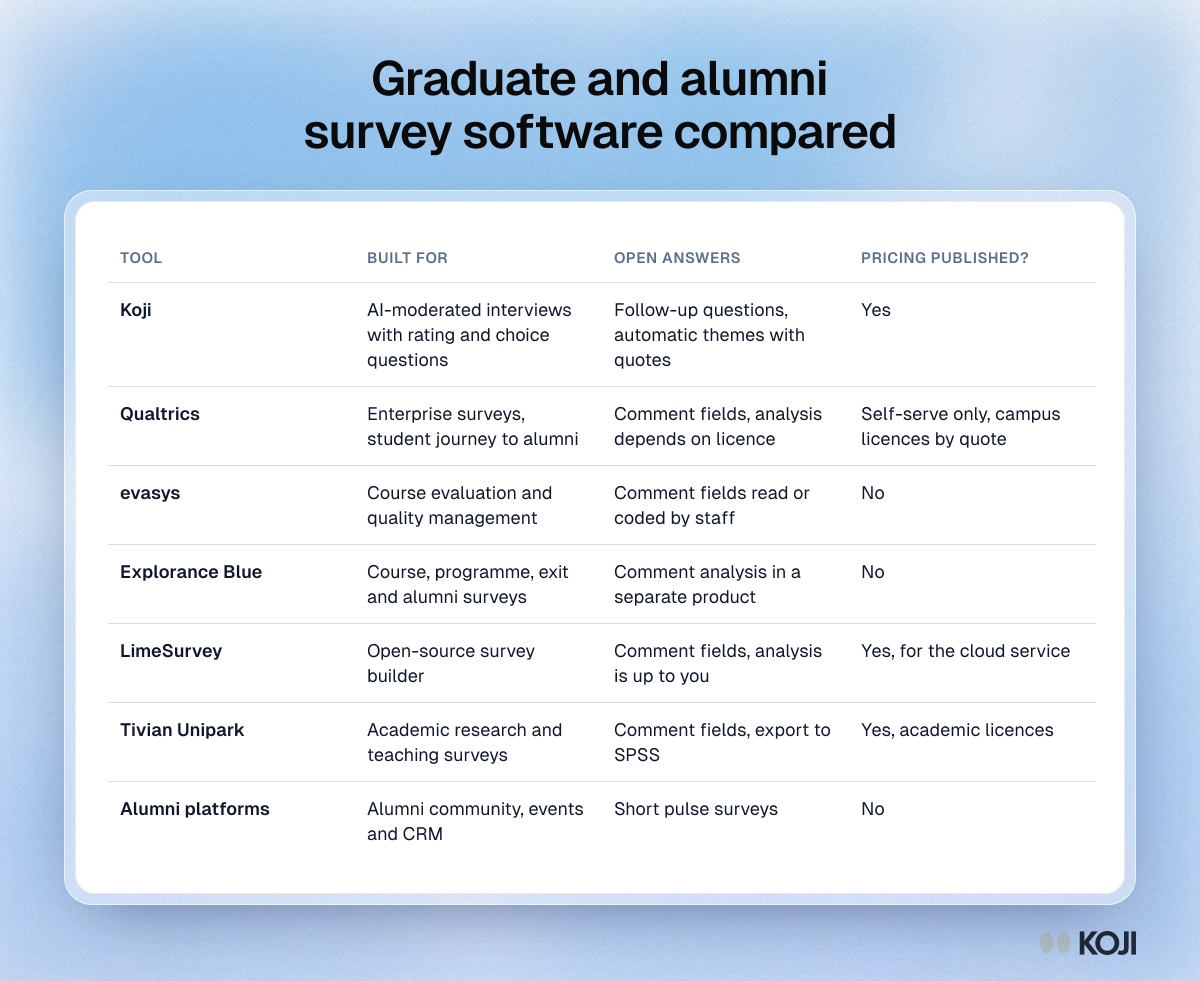
Table comparing seven graduate and alumni survey tools by what they are built for, how they handle open answers and whether pricing is published.

Reference table

Graduate and alumni survey software compared
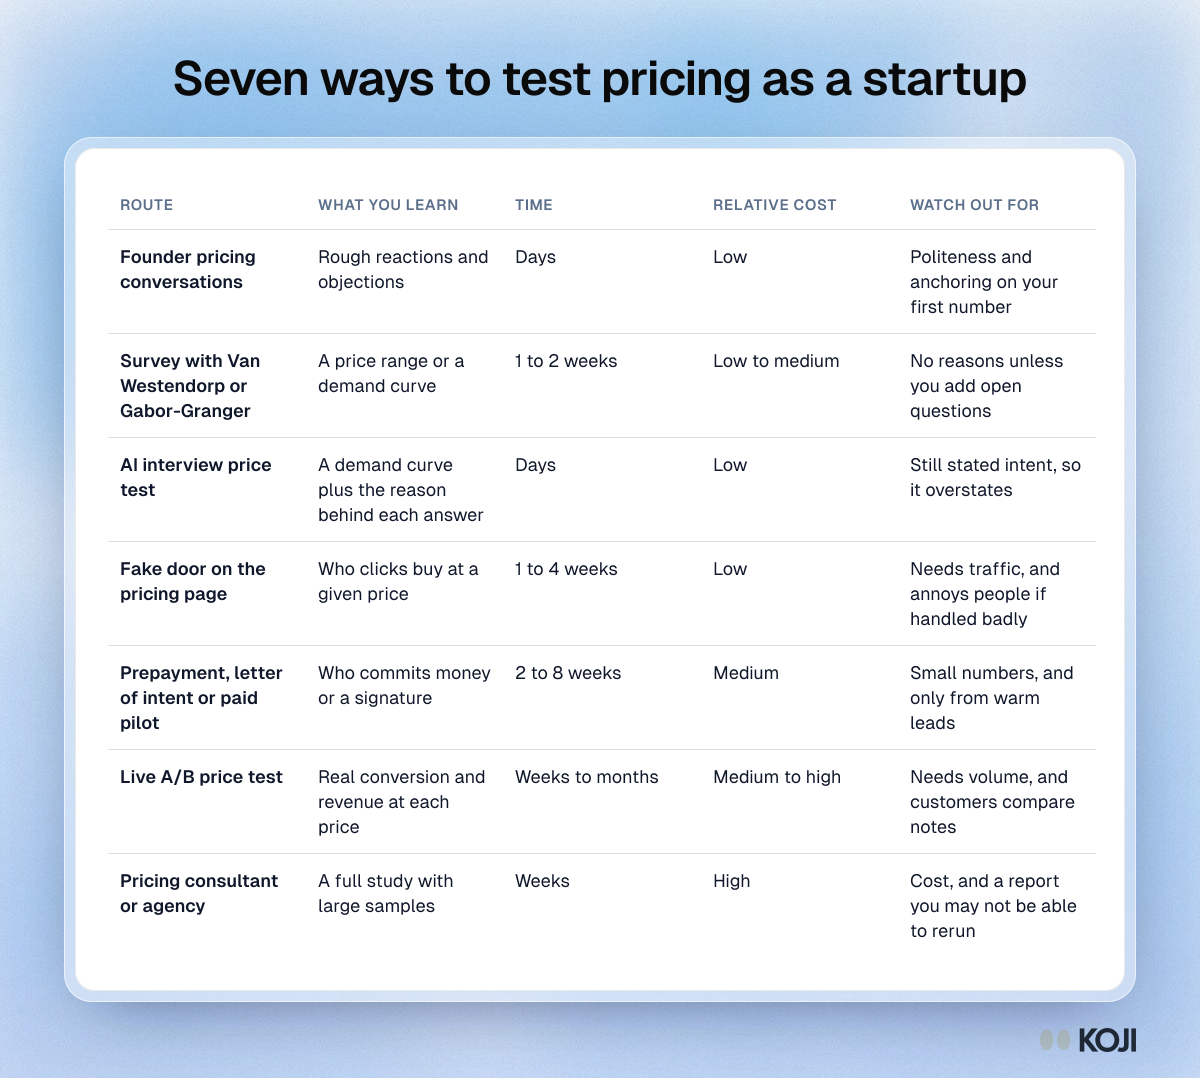
Table comparing seven ways a startup can test pricing, from founder conversations to live A/B price tests, by what you learn, time, cost and risk.

Reference table

Seven ways to test pricing as a startup
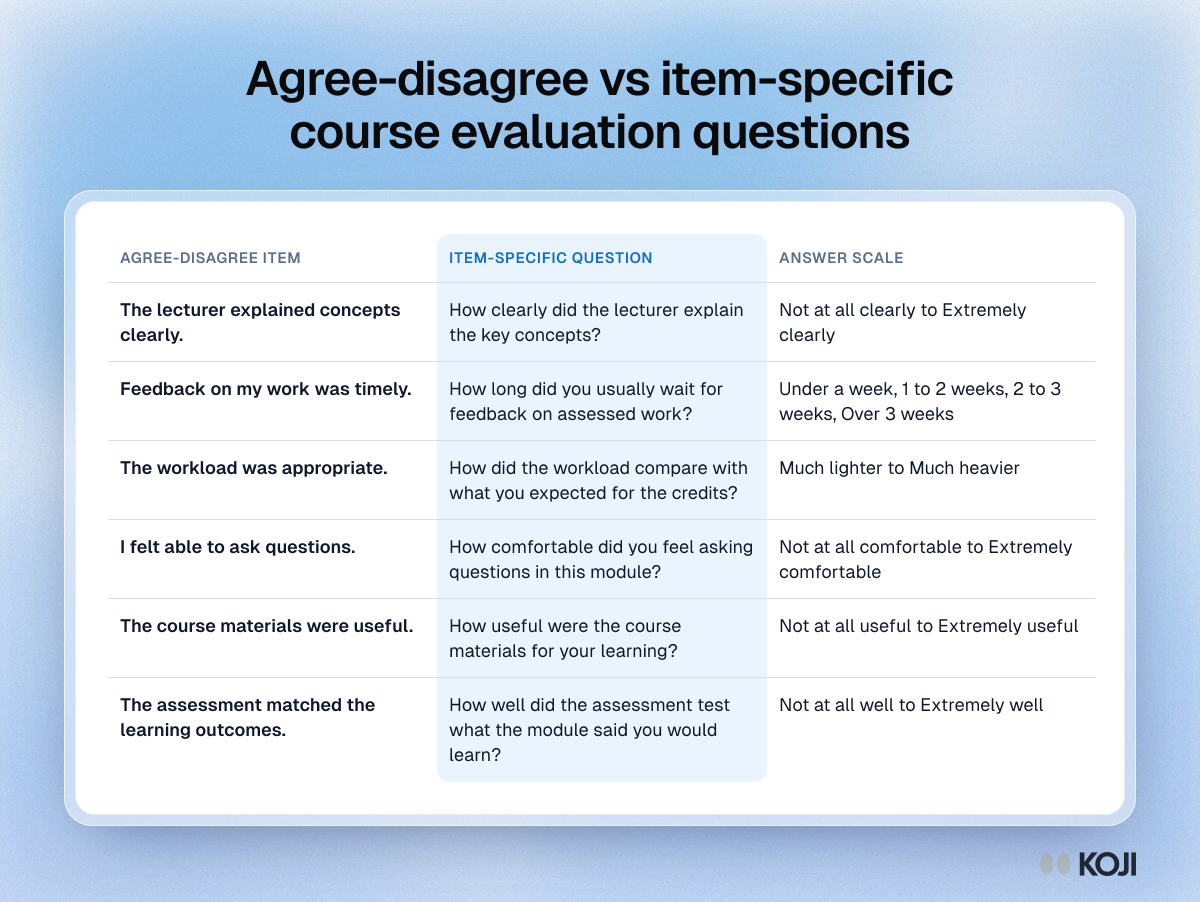
Table pairing six common agree-disagree course evaluation statements with item-specific rewrites and answer scales, from lecture clarity to assessment fit.

Reference table

Agree-disagree vs item-specific course evaluation questions
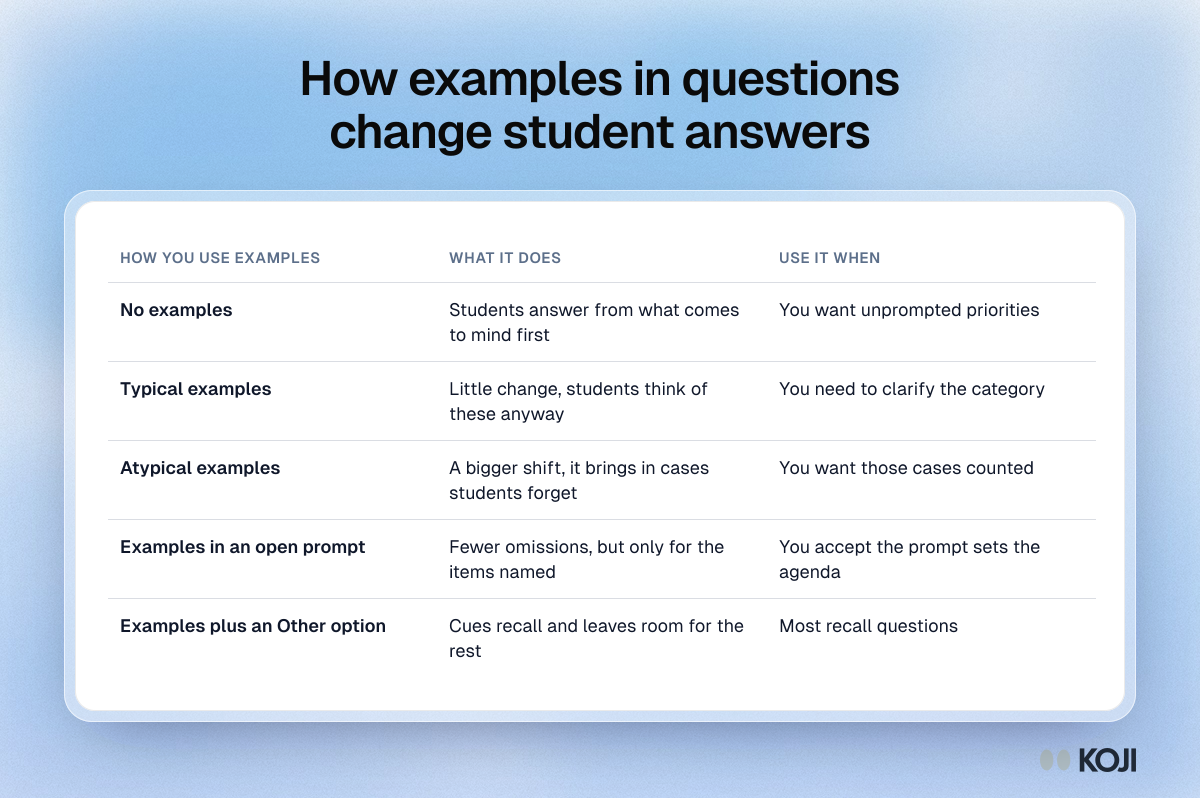
Table showing what each way of using examples in a course evaluation question does to student answers, from no examples to atypical examples.

Reference table

How examples in questions change student answers
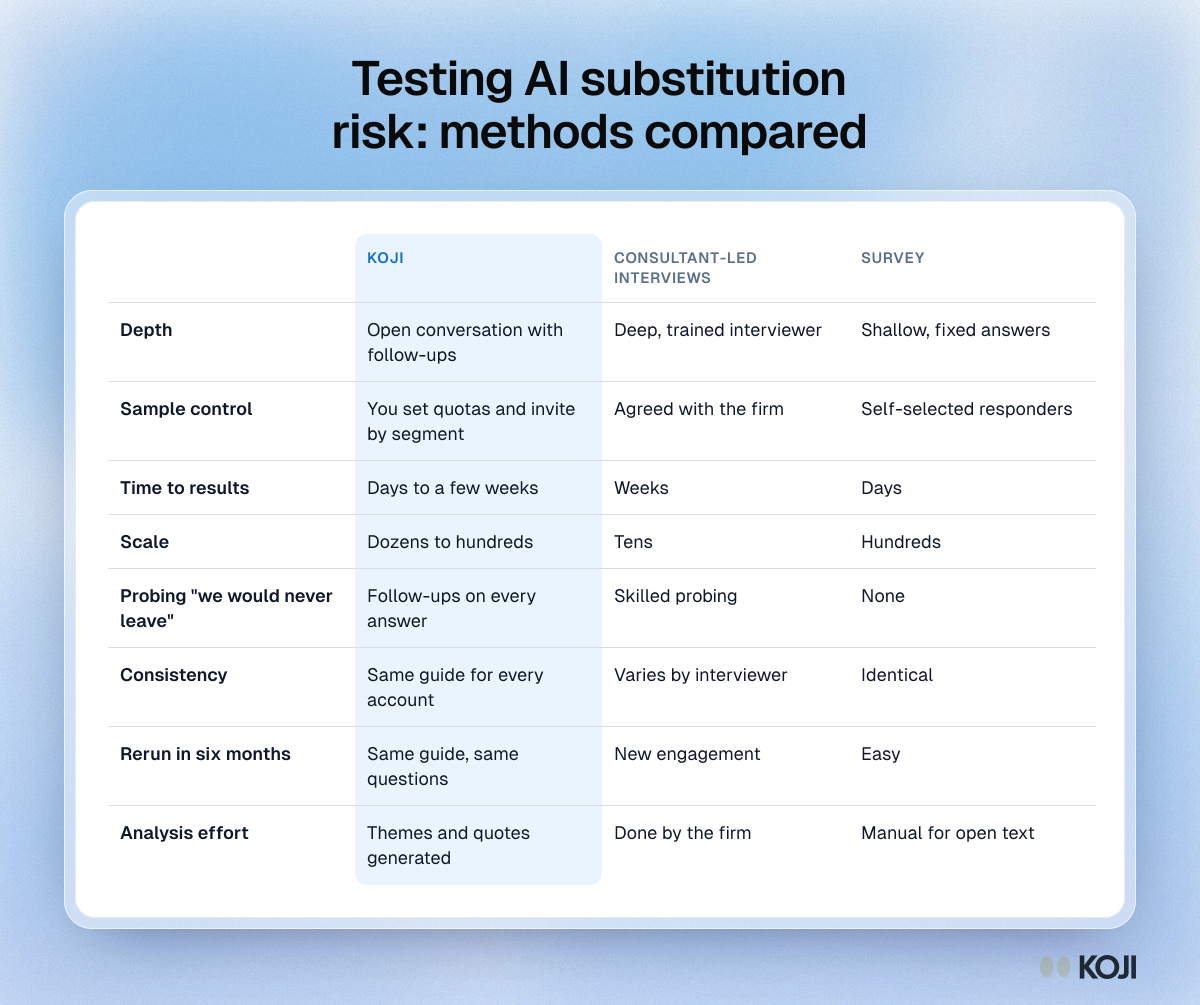
Table comparing Koji, consultant-led interviews and surveys for testing AI substitution risk, on depth, sample control, speed, scale and rerun.

Reference table

Testing AI substitution risk: methods compared
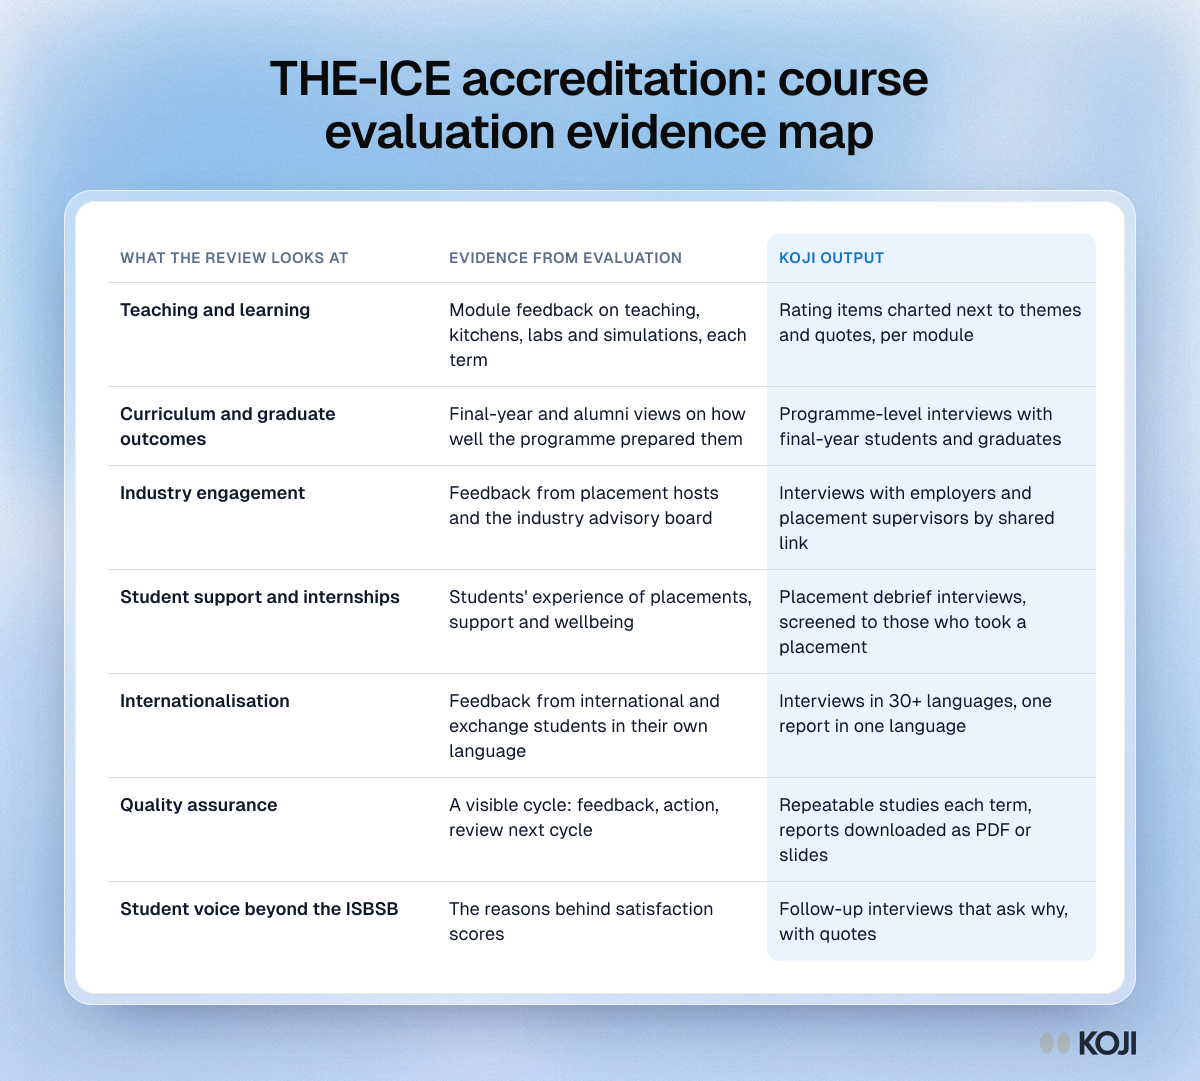
Table mapping each area a THE-ICE accreditation review looks at to course evaluation evidence and the matching Koji output

Reference table

THE-ICE accreditation: course evaluation evidence map
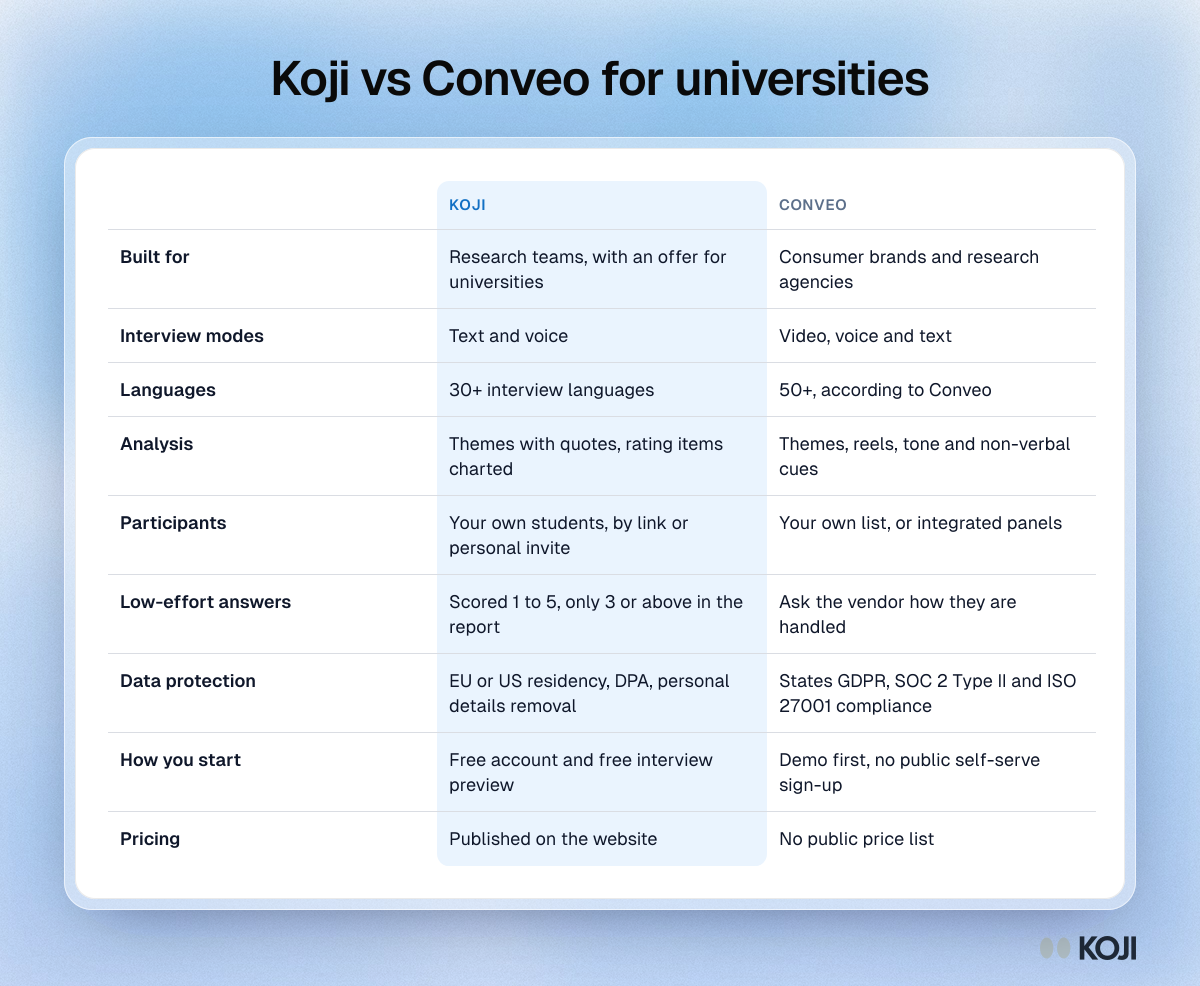
Table comparing Koji and Conveo for university feedback: interview modes, languages, analysis, participants, quality checks, data protection and pricing

Reference table

Koji vs Conveo for universities
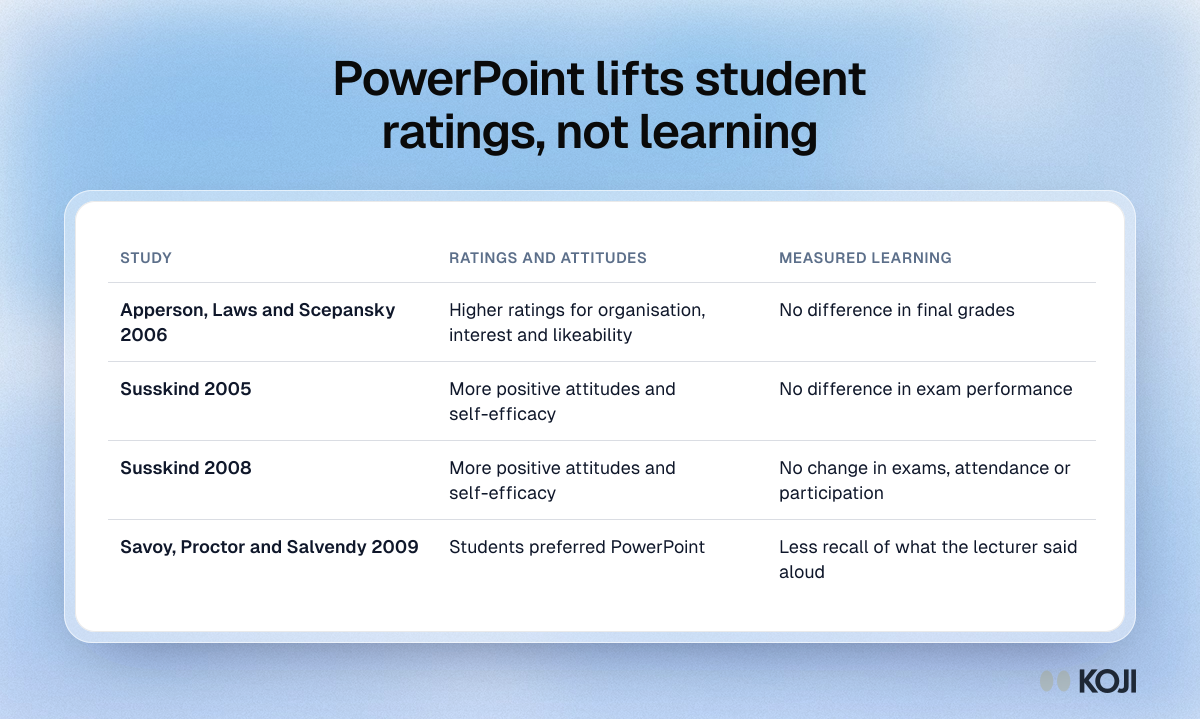
Table of four PowerPoint studies in university teaching: student ratings and attitudes rose with slides, while measured learning did not.

Reference table

PowerPoint lifts student ratings, not learning
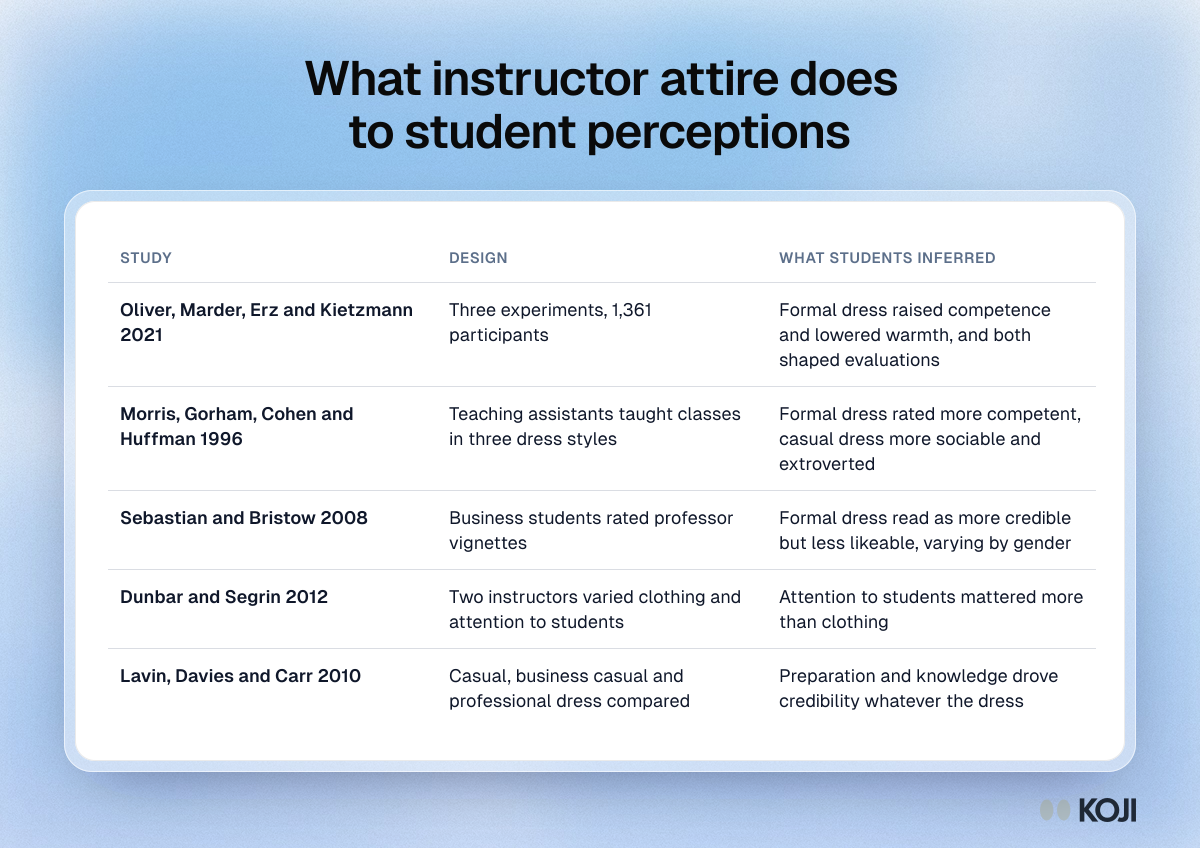
Table comparing five studies on instructor attire and student perceptions, showing each study's design and what students inferred from formal and casual dress.

Reference table

What instructor attire does to student perceptions
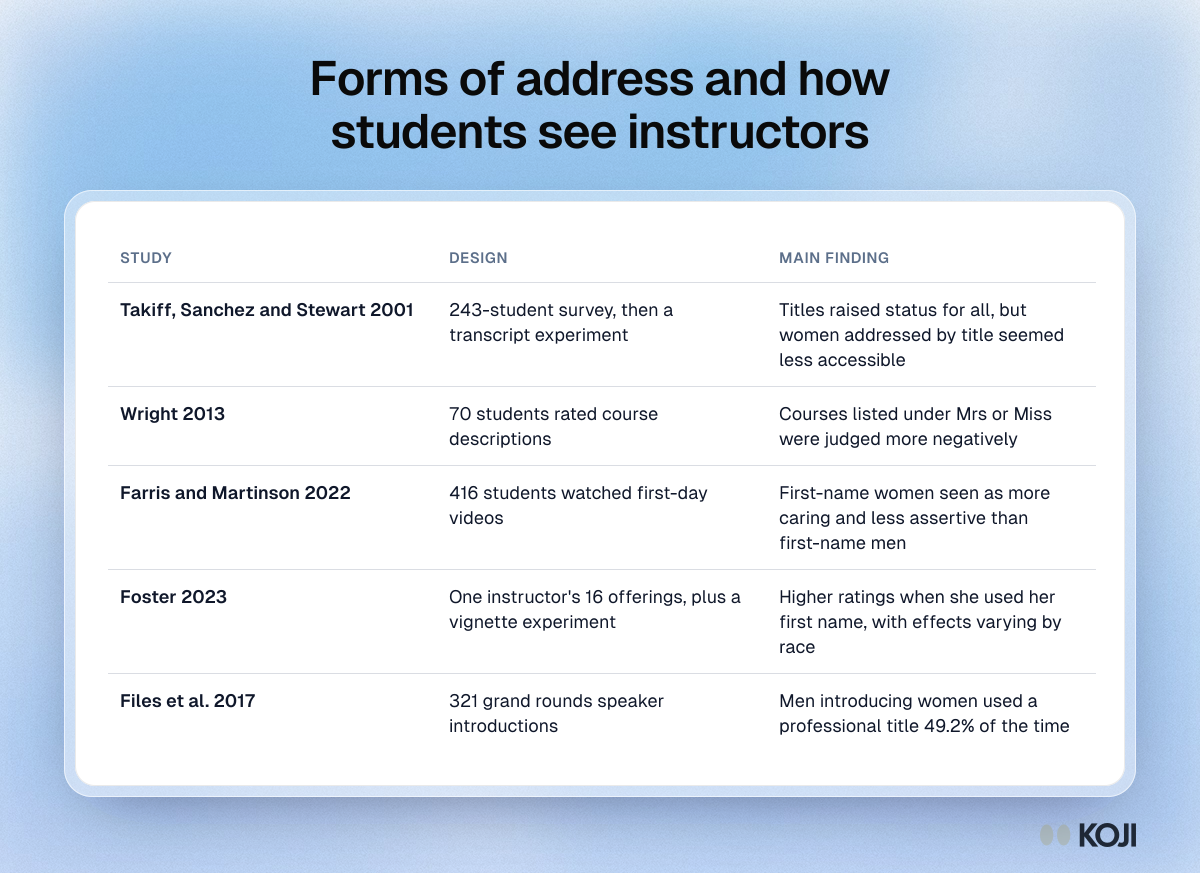
Table comparing five studies on forms of address and how students and colleagues perceive instructors, with each study's design and main finding.

Reference table

Forms of address and how students see instructors
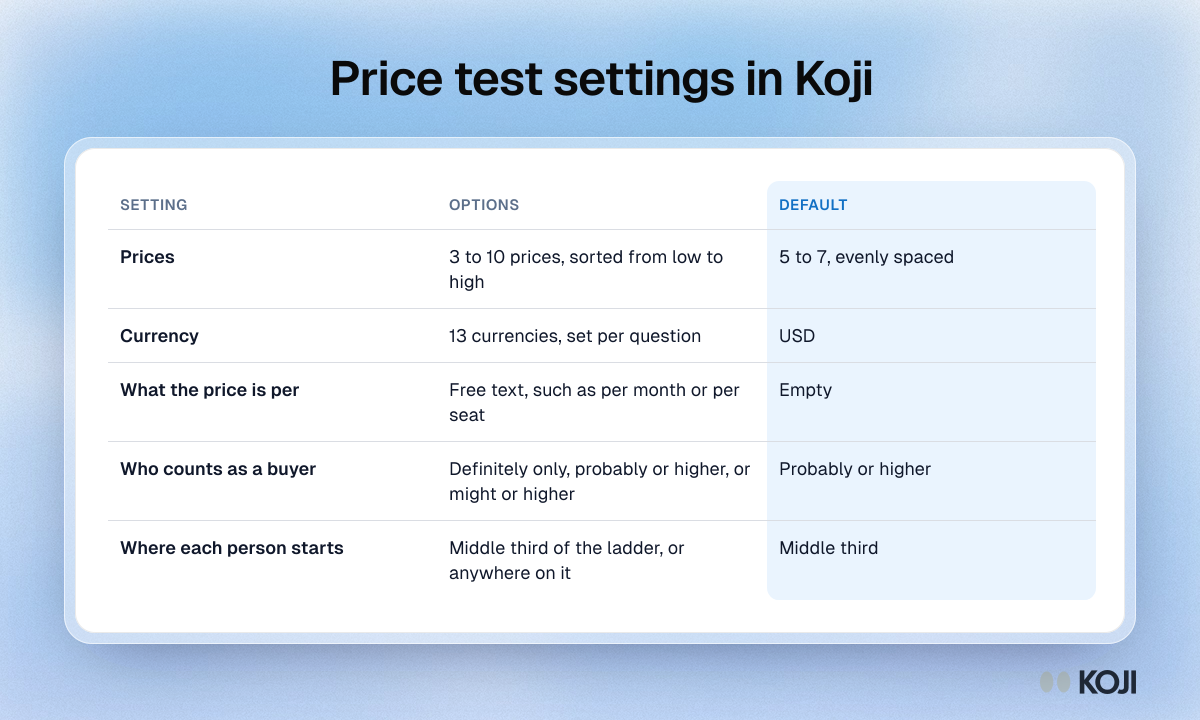
Table of the five Koji price test settings: prices, currency, unit, who counts as a buyer and starting point, with the options and default for each.

Reference table

Price test settings in Koji

Comparison table of Tally and Koji for course evaluation: how students answer, follow-up questions, open comments, reports and data handling.

Reference table

Tally vs Koji for course evaluation

Comparison table of Mentimeter and Koji for course evaluation: follow-up questions, open-answer analysis, actions, anonymity and data location.

Reference table

Mentimeter vs Koji for course evaluation

Table of customer interview sample sizes by research type, from 5 to 8 for usability testing to 30 to 50 or more for market research.

Reference table

Customer interview sample size by research type
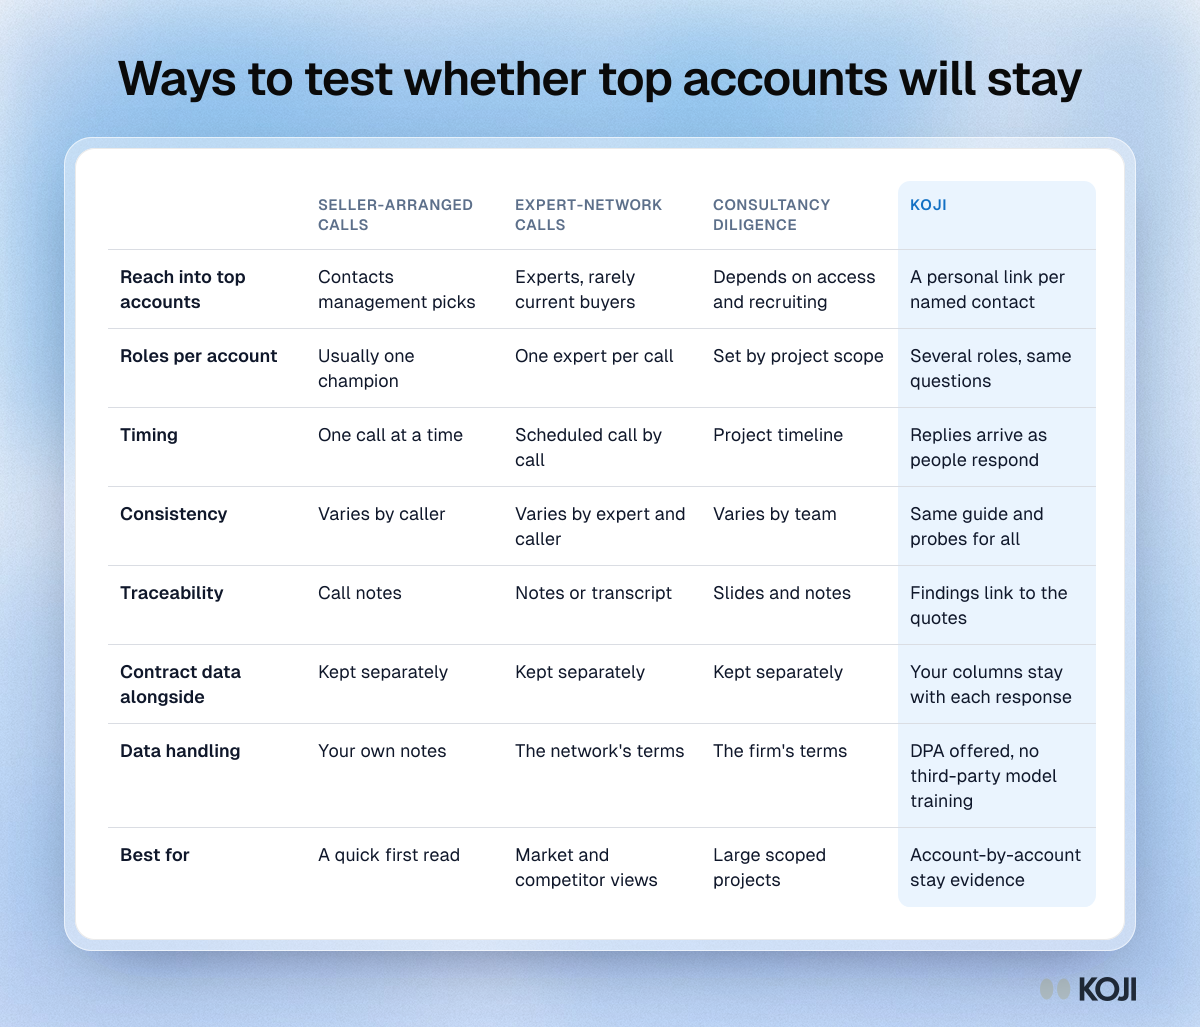
Table comparing seller-arranged calls, expert-network calls, consultancy diligence and Koji for top-account interviews on reach, roles, timing and traceability.

Reference table

Ways to test whether top accounts will stay
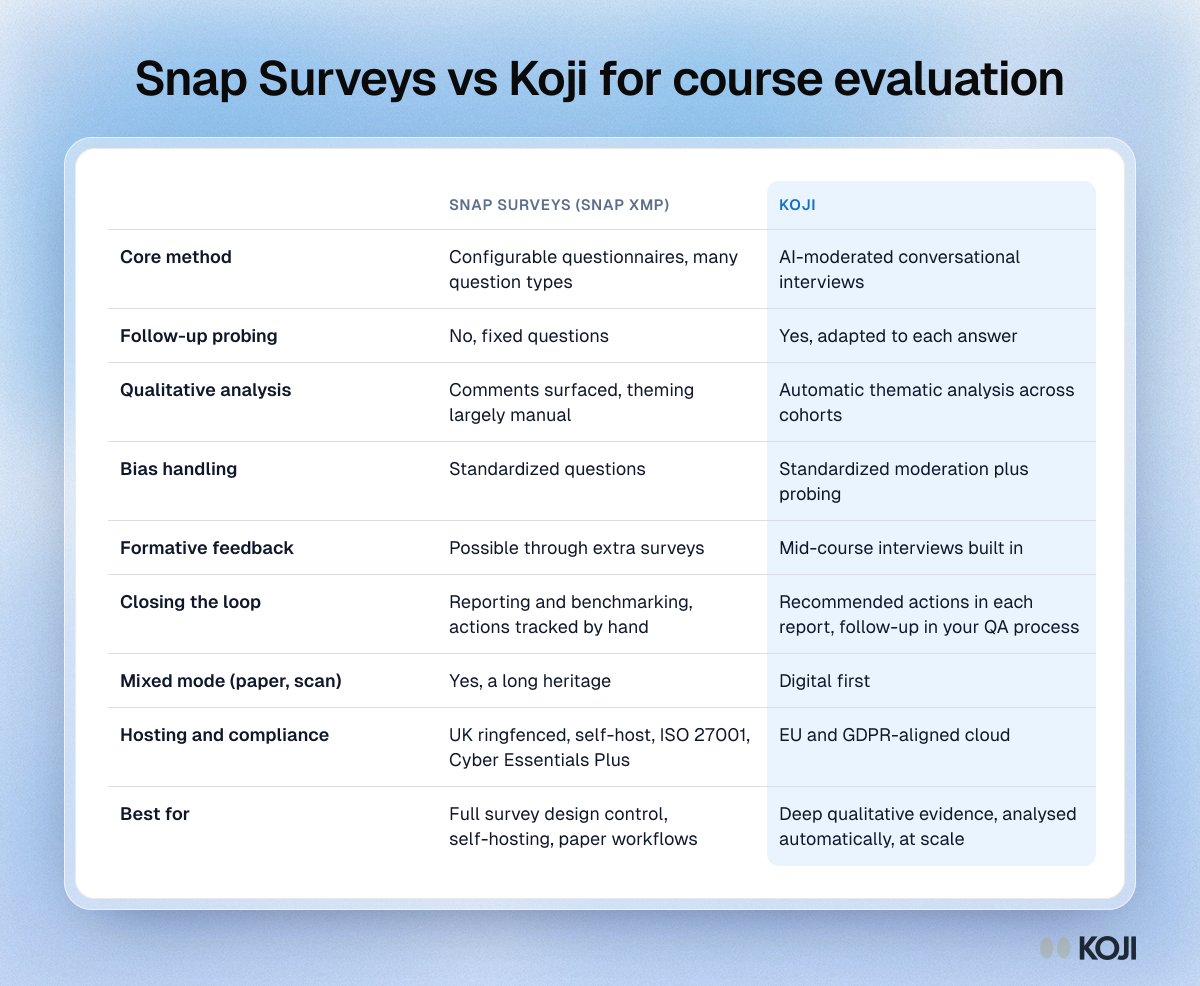
Comparison table of Snap Surveys and Koji for course evaluation: method, follow-up probing, analysis, formative feedback, hosting and best fit.

Reference table

Snap Surveys vs Koji for course evaluation
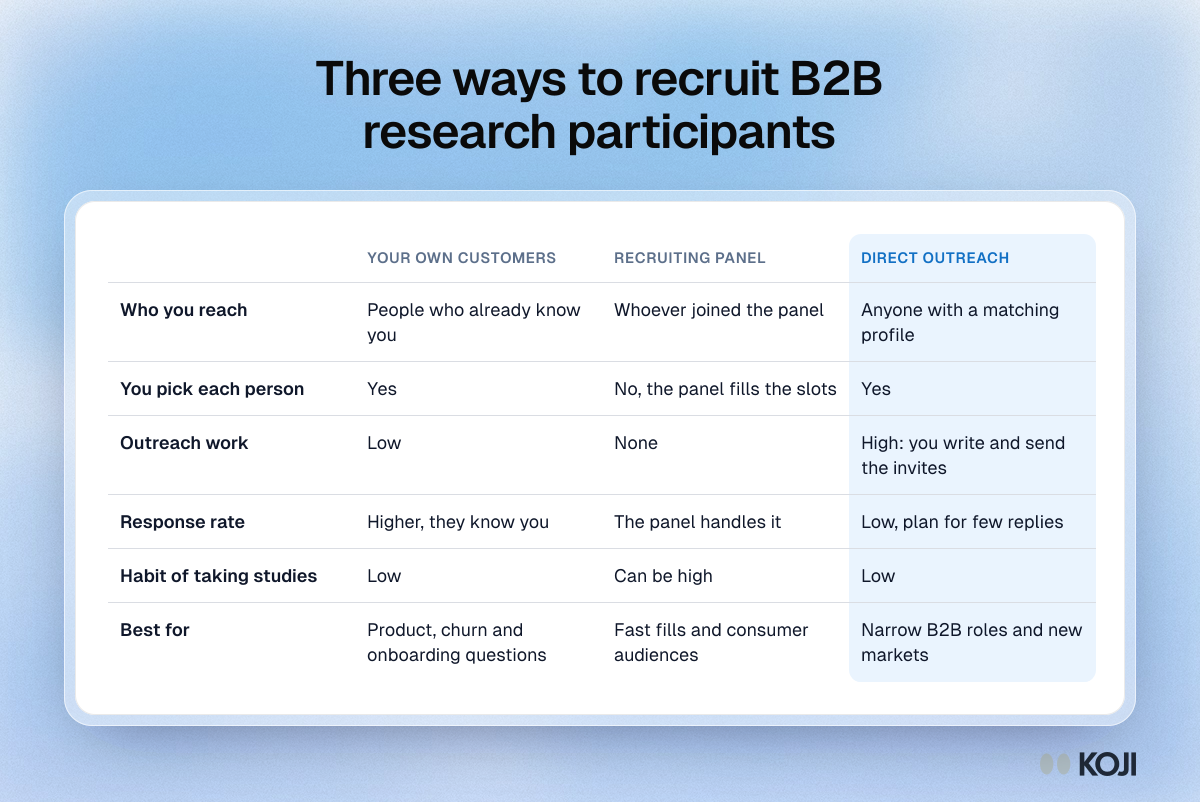
Table comparing three ways to recruit B2B research participants: your own customers, a recruiting panel and direct outreach, by reach, control and effort.

Reference table

Three ways to recruit B2B research participants

Table matching four course evaluation goals to a link type, from tracked personal links for coverage to anonymous links for sensitive topics.

Reference table

Personal or anonymous links for course evaluations
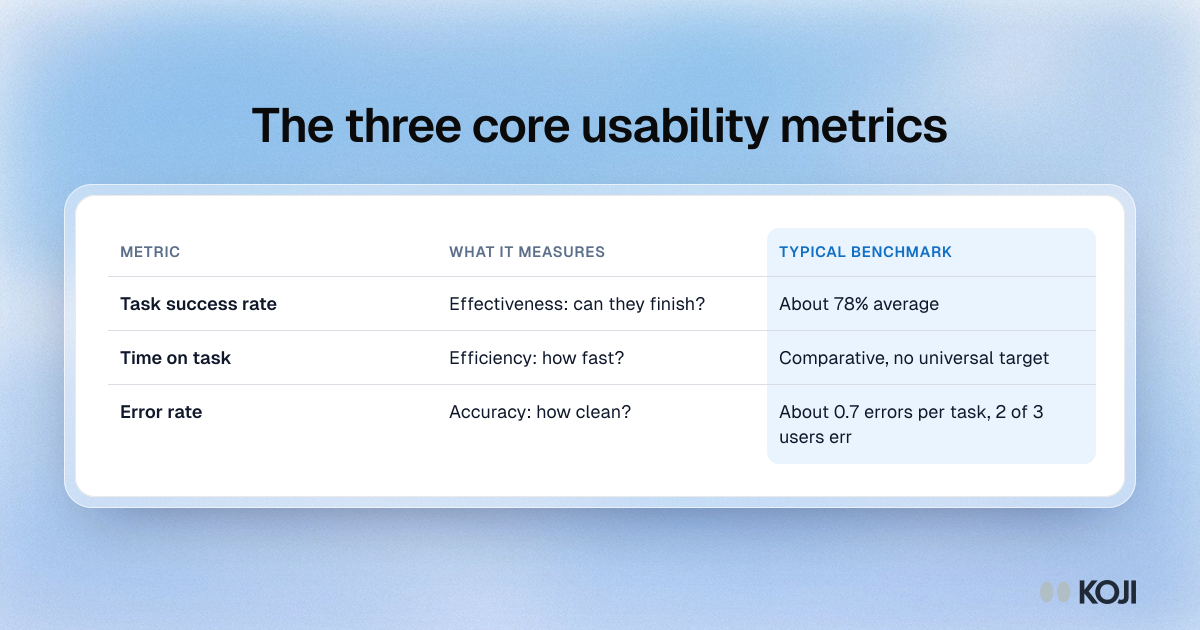
Table of the three core usability metrics with benchmarks: task success rate, about 78%; time on task, comparative; error rate, about 0.7 per task.

Reference table

The three core usability metrics
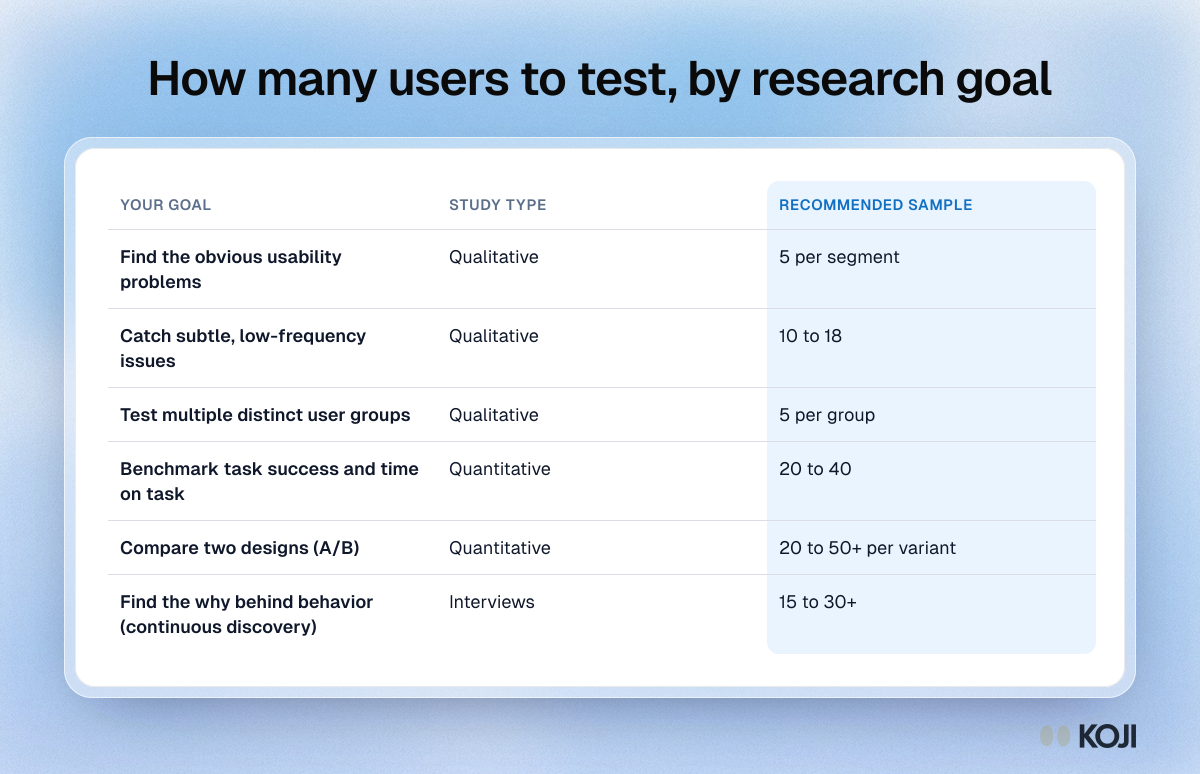
Table of usability test sample sizes by research goal, from 5 users per segment for obvious problems to 20 to 50 plus per variant for design comparisons.

Reference table

How many users to test, by research goal
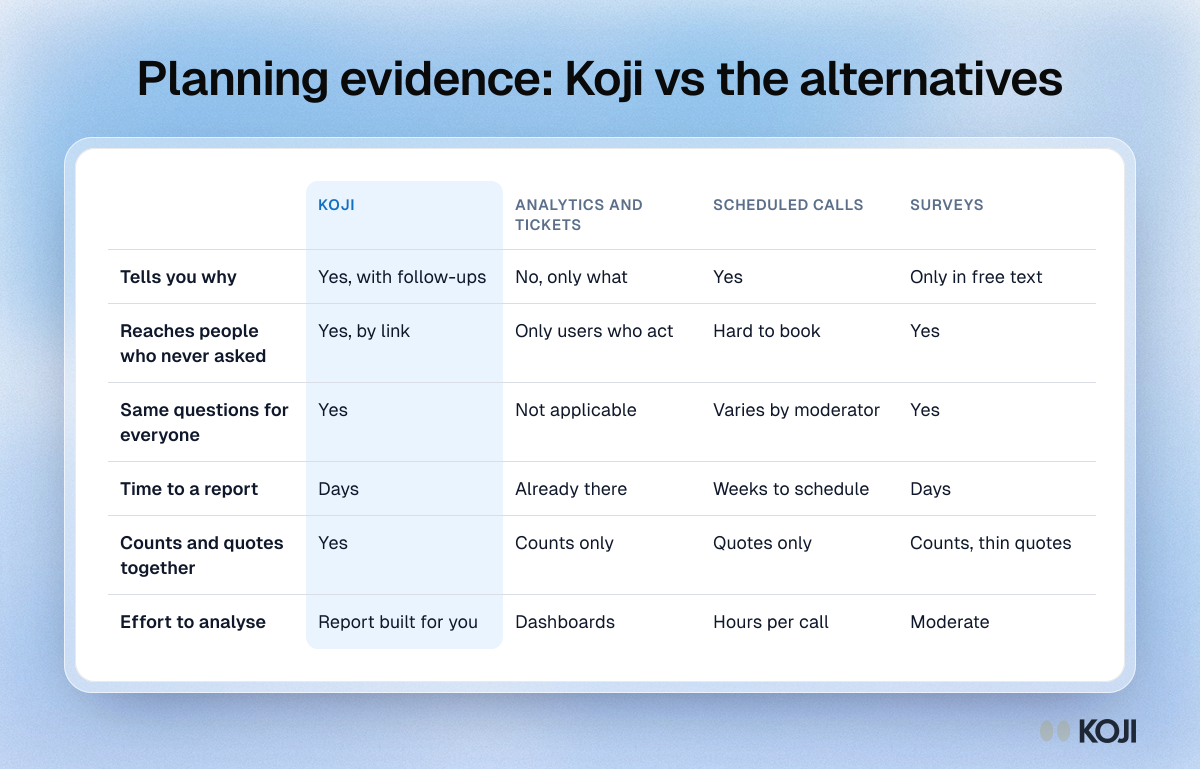
Table comparing Koji, analytics and tickets, scheduled calls and surveys on why, reach, consistency, speed, counts with quotes and analysis effort.

Reference table

Planning evidence: Koji vs the alternatives
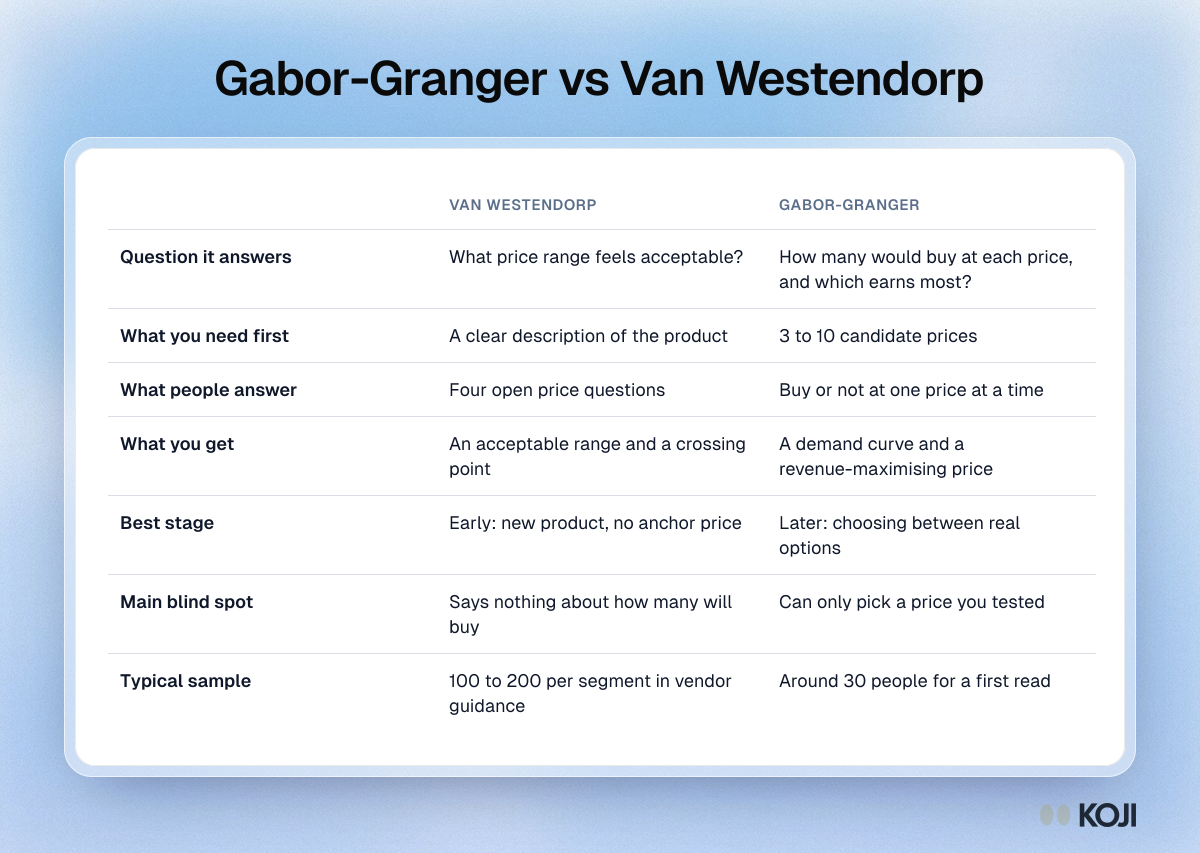
Table comparing Van Westendorp and Gabor-Granger on the question each answers, inputs, outputs, best stage, blind spot and sample size

Reference table

Gabor-Granger vs Van Westendorp
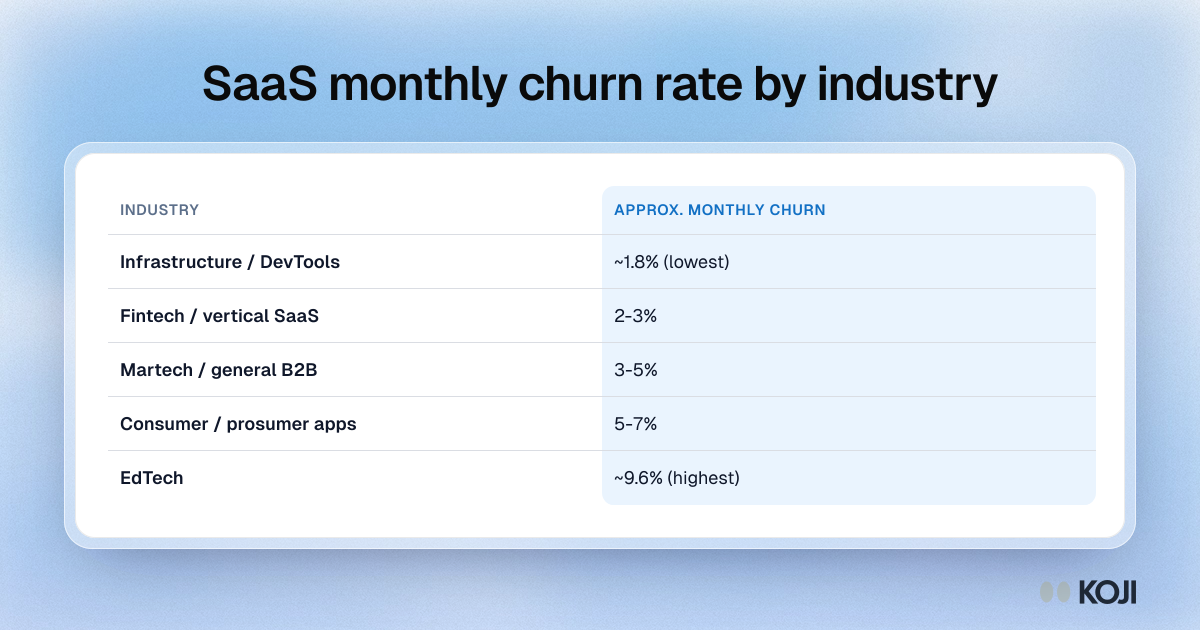
Table of approximate SaaS monthly churn by industry, from about 1.8% for infrastructure and DevTools to about 9.6% for EdTech.

Reference table

SaaS monthly churn rate by industry
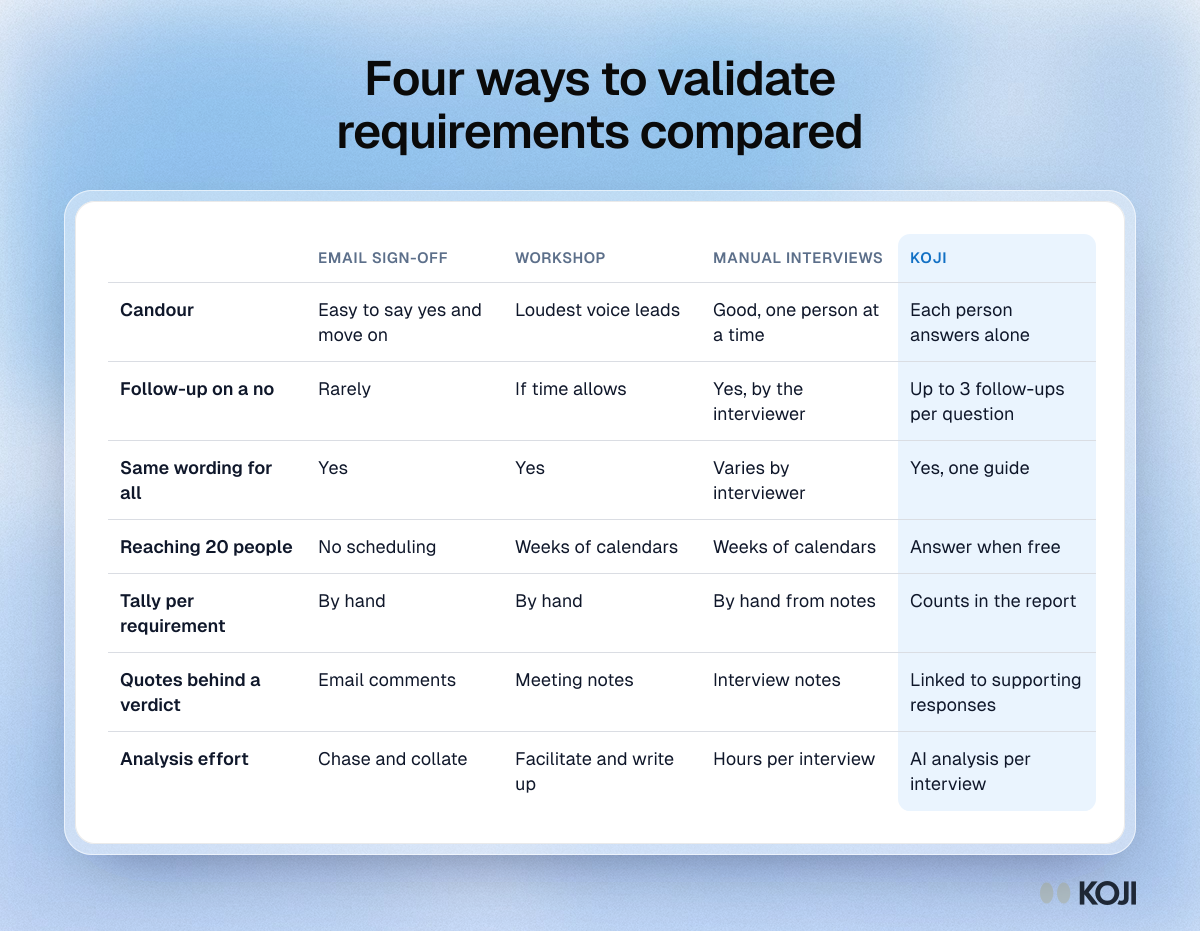
Table comparing email sign-off, workshops, manual interviews and Koji for validating requirements on candour, follow-up, reach and analysis effort.

Reference table

Four ways to validate requirements compared
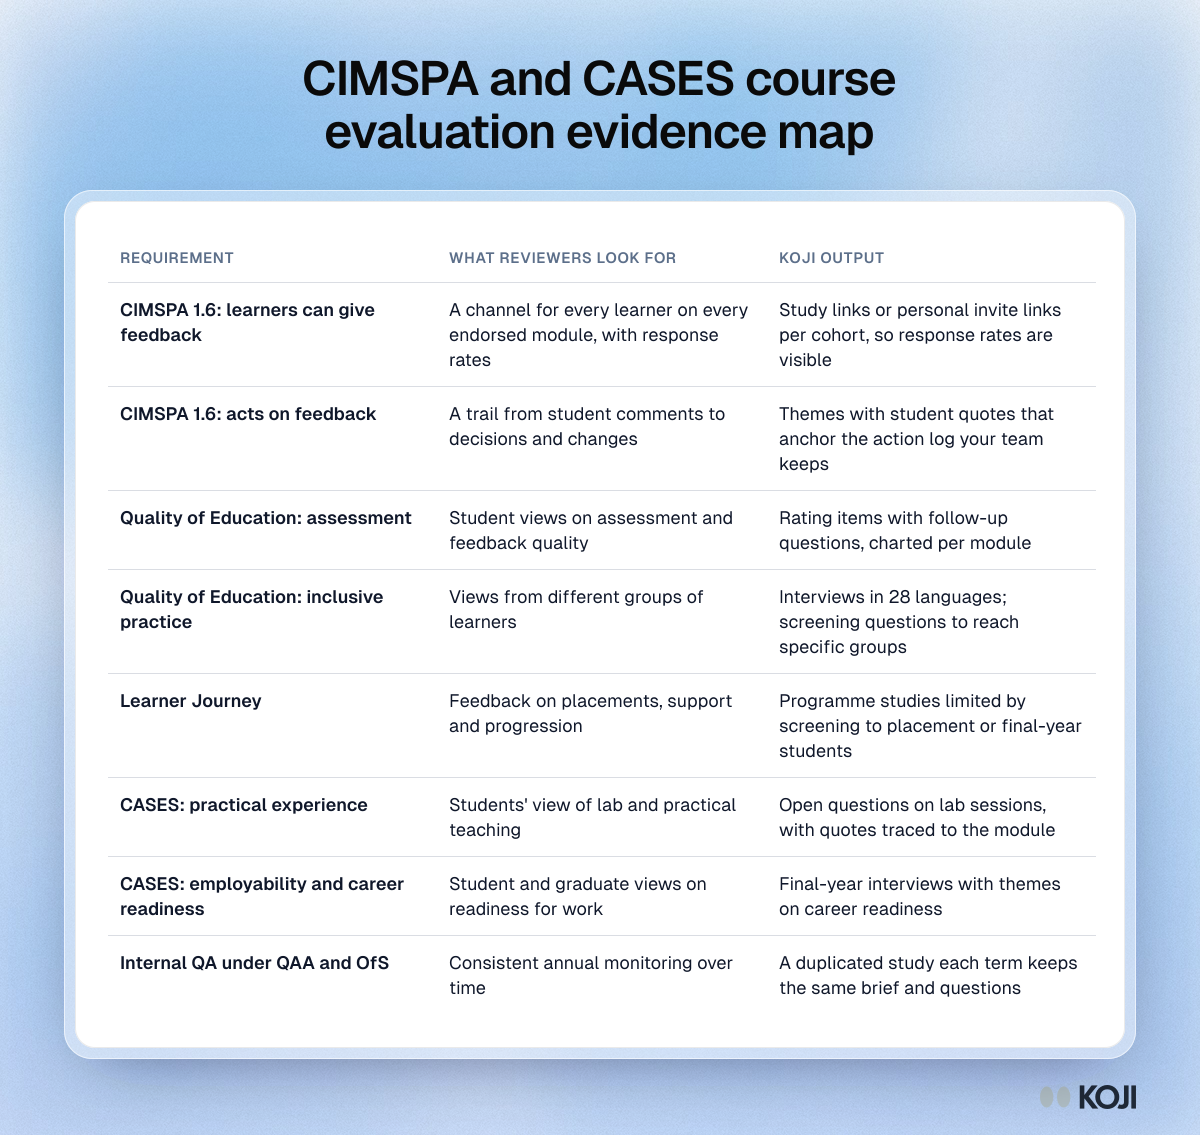
Table mapping CIMSPA and CASES requirements to the evidence reviewers look for and the matching Koji outputs for sport degree courses

Reference table

CIMSPA and CASES course evaluation evidence map
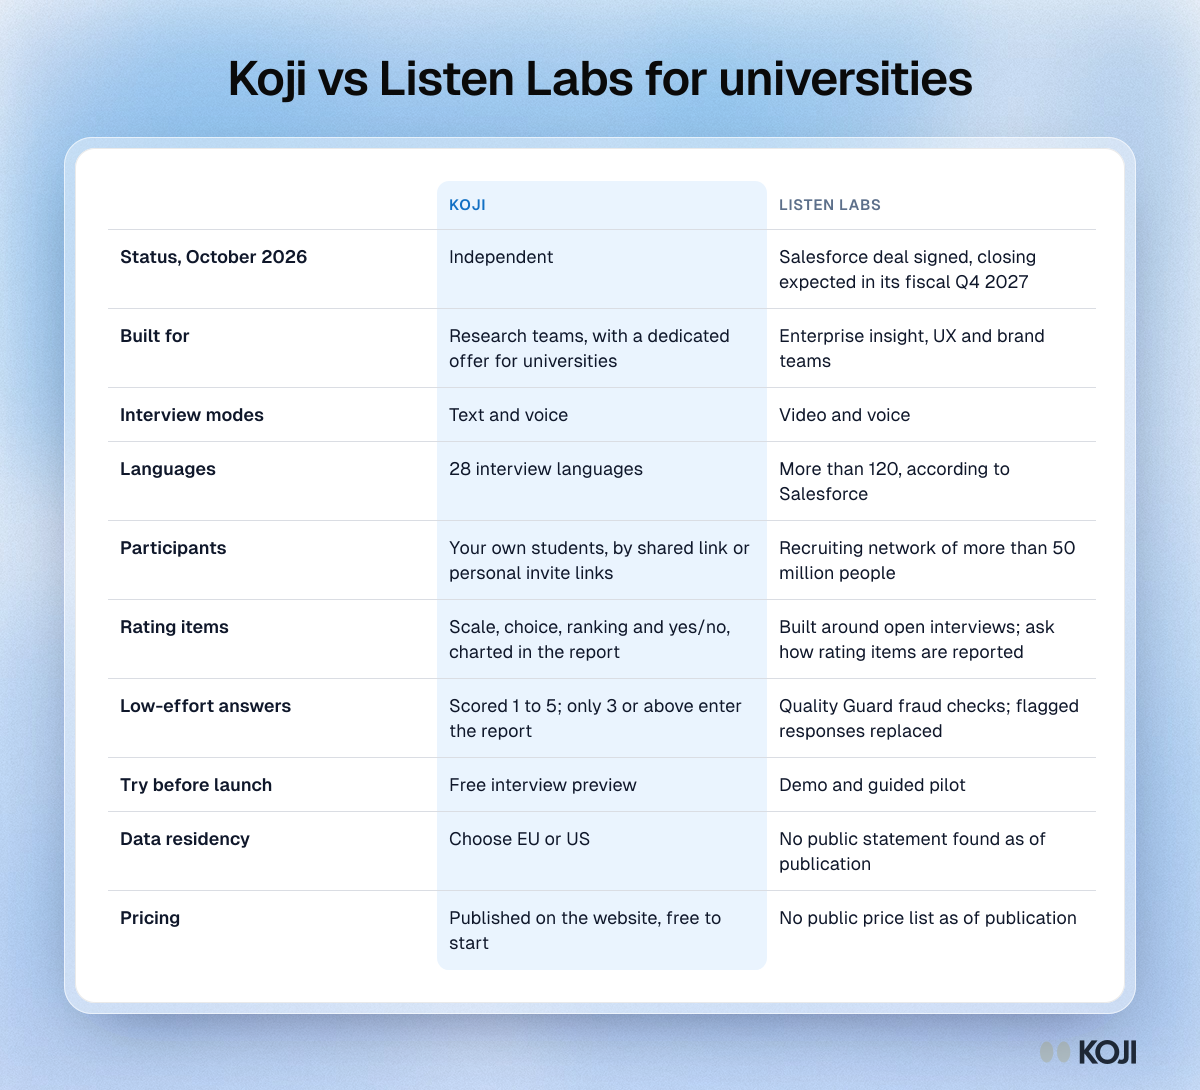
Table comparing Koji and Listen Labs for university feedback on status, interview modes, languages, participants, quality checks, data residency and pricing

Reference table

Koji vs Listen Labs for universities
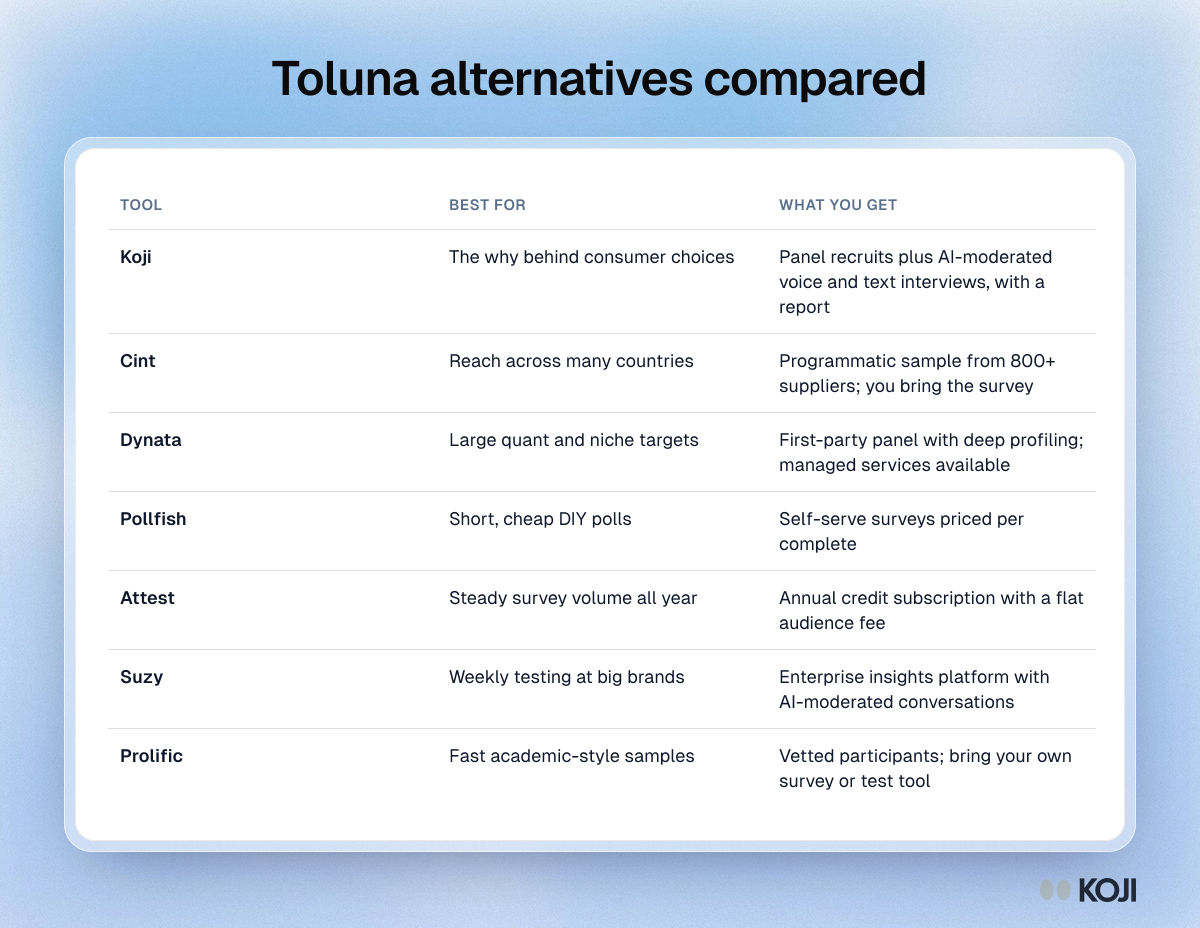
Table comparing seven Toluna alternatives, Koji, Cint, Dynata, Pollfish, Attest, Suzy and Prolific, by what each is best for and what you get

Reference table

Toluna alternatives compared
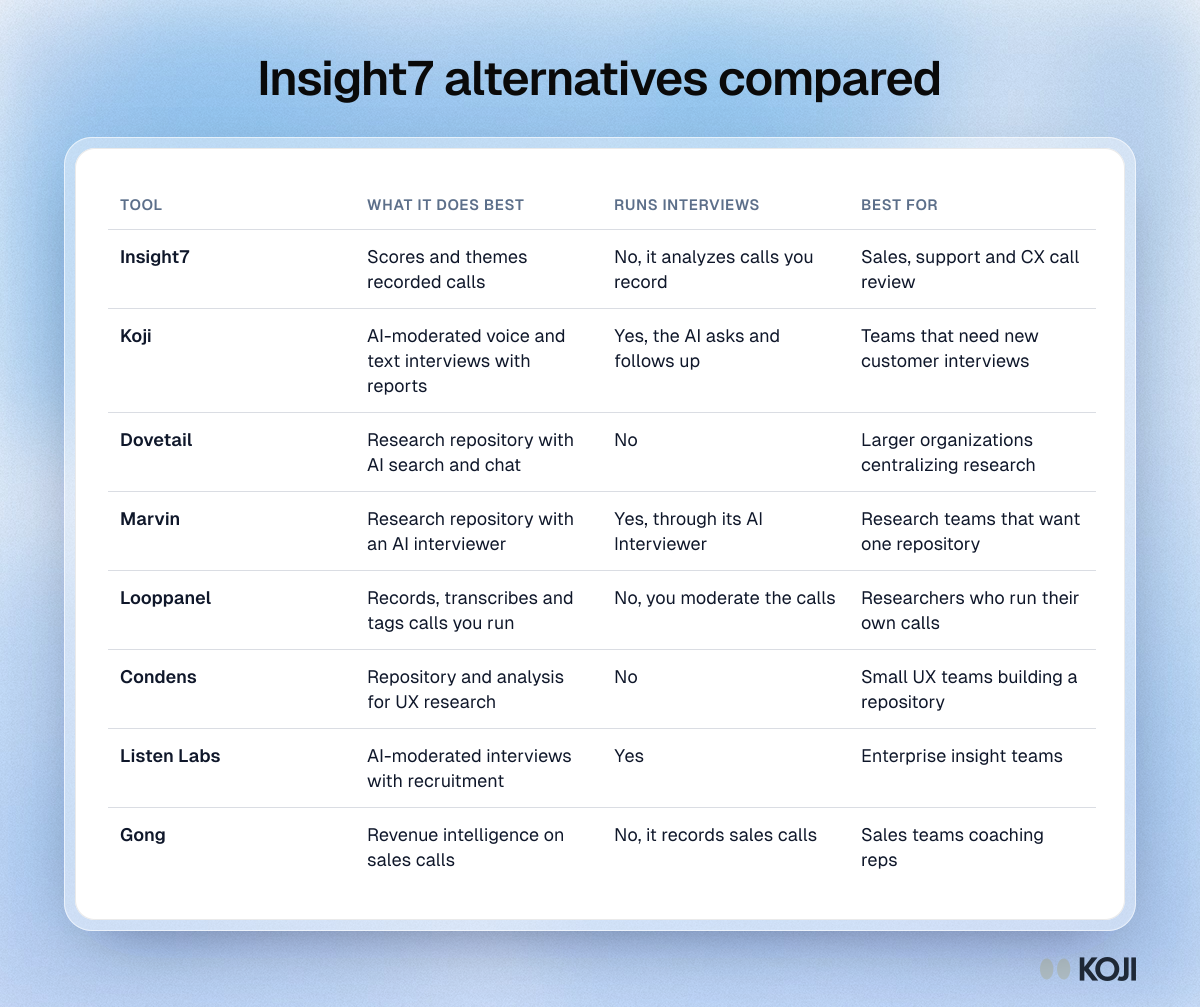
Table comparing Insight7 with seven alternatives by what each does best, whether it runs interviews and who it suits

Reference table

Insight7 alternatives compared
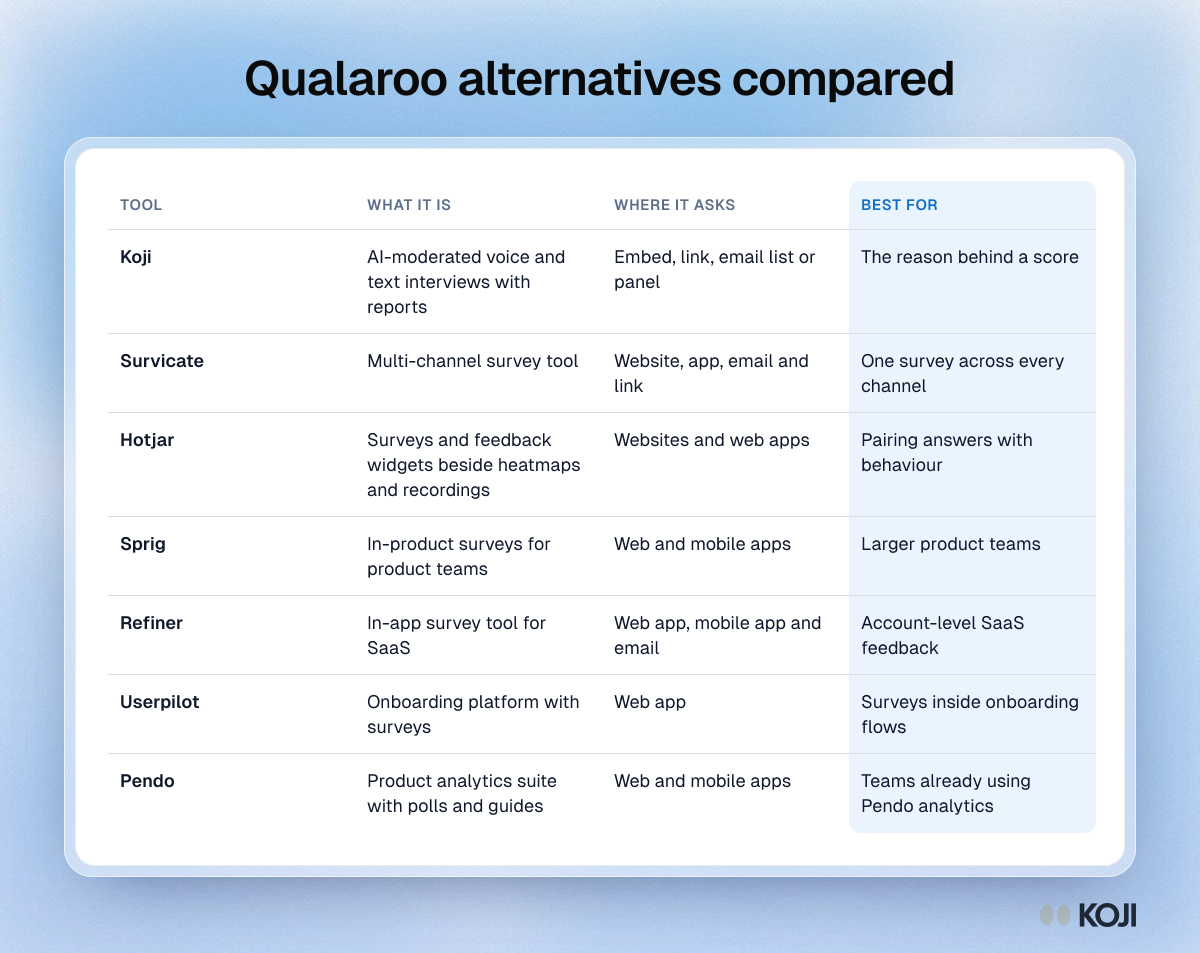
Table comparing Qualaroo alternatives Koji, Survicate, Hotjar, Sprig, Refiner, Userpilot and Pendo by what they are, where they ask and best use

Reference table

Qualaroo alternatives compared
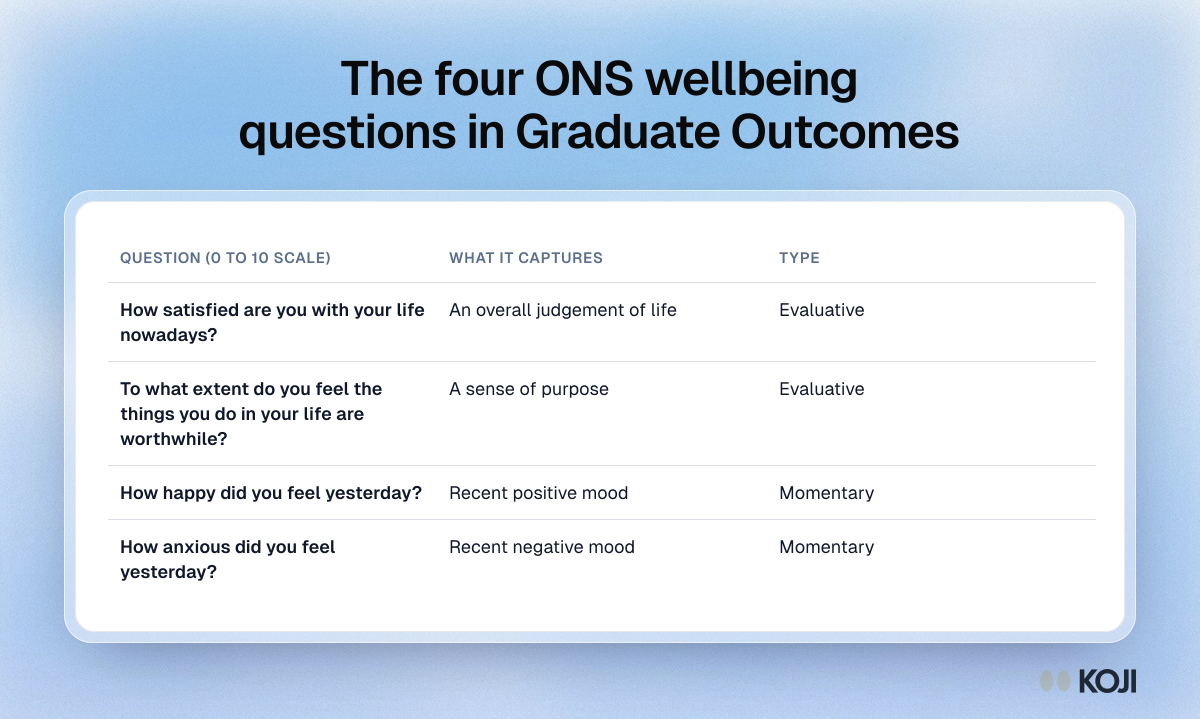
Table of the four ONS personal wellbeing questions asked in the UK Graduate Outcomes survey, split into evaluative and momentary measures.

Reference table

The four ONS wellbeing questions in Graduate Outcomes
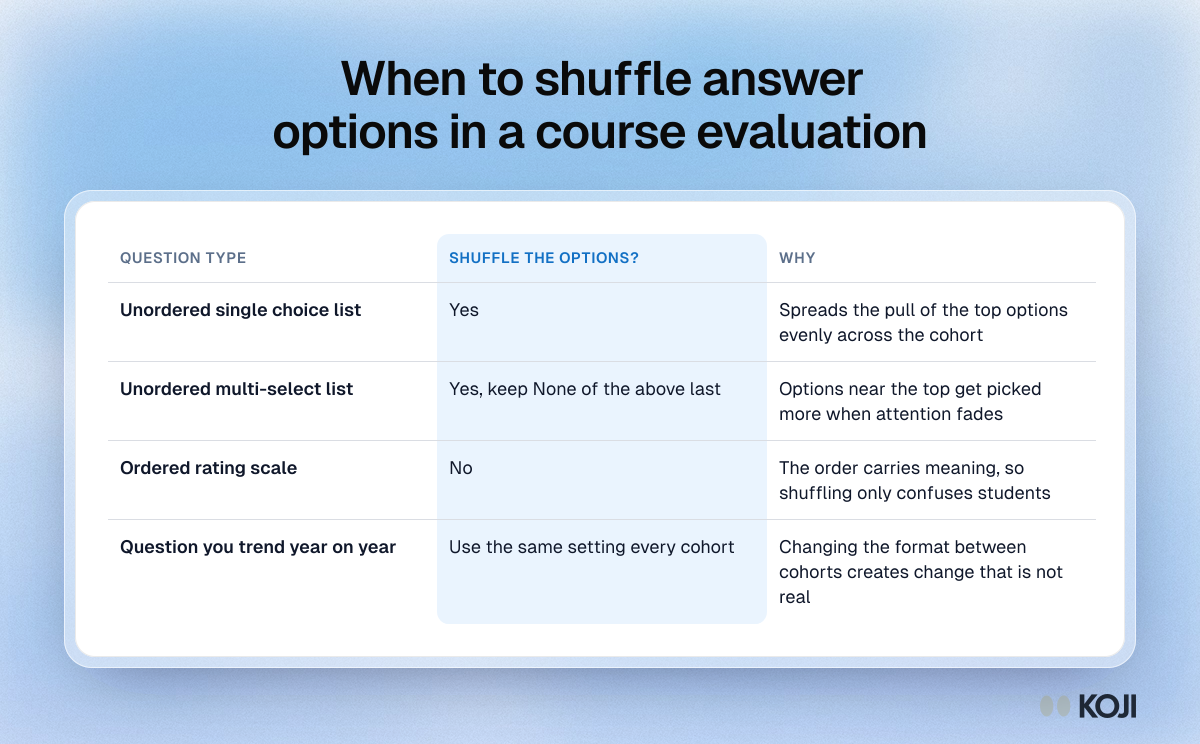
Table showing when to shuffle answer options in a course evaluation: yes for unordered lists, never for ordered rating scales, same setting for trended items

Reference table

When to shuffle answer options in a course evaluation
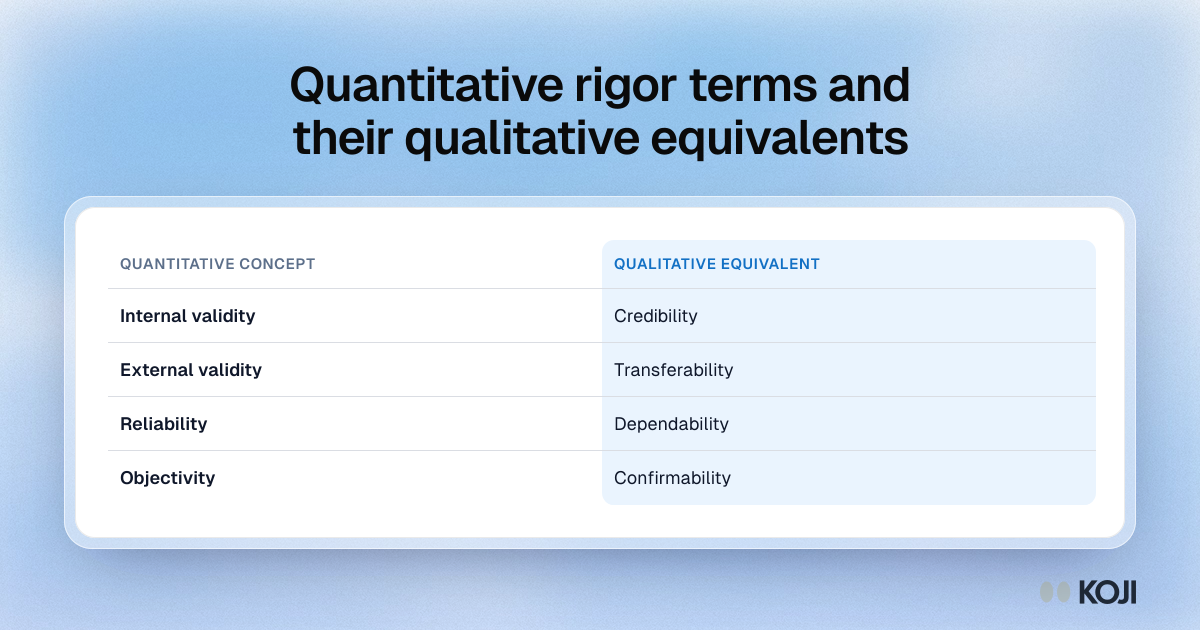
Table pairing quantitative rigor terms with qualitative ones, such as internal validity with credibility and reliability with dependability.

Reference table

Quantitative rigor terms and their qualitative equivalents
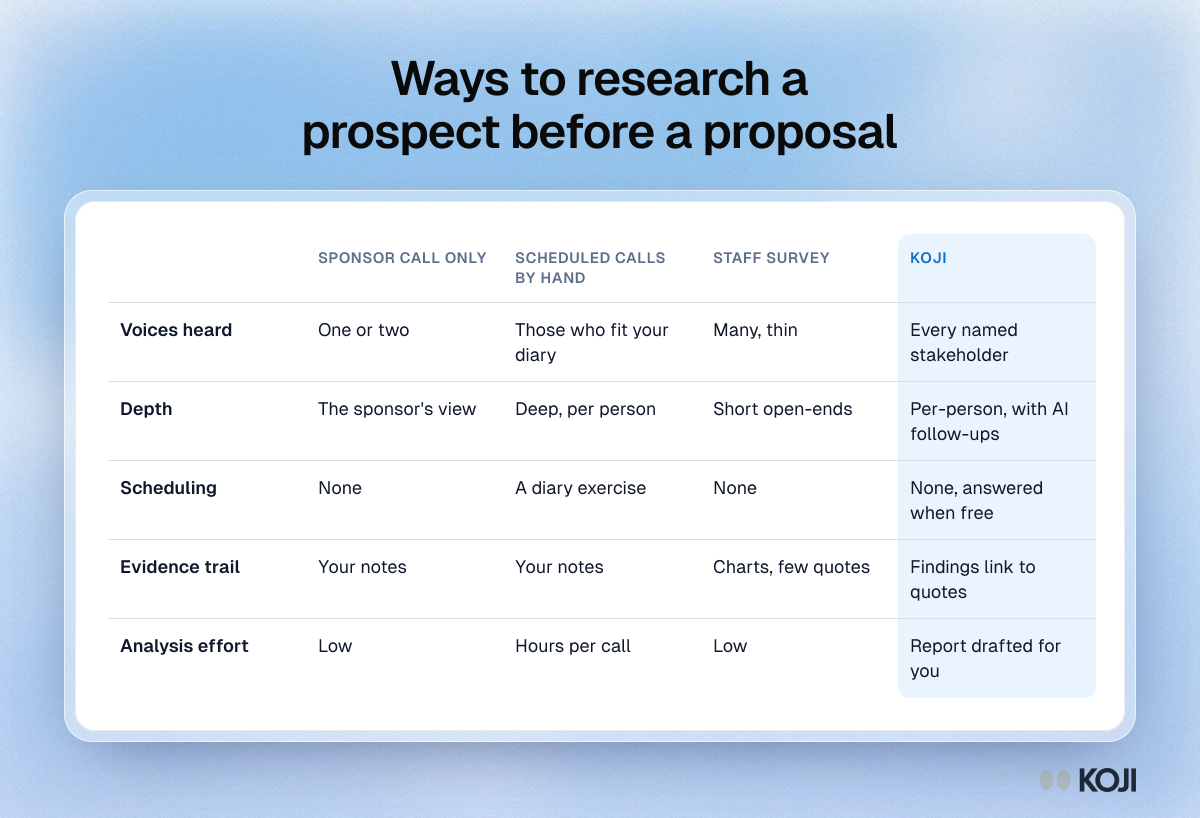
Table comparing four ways to learn about a prospect before a proposal: sponsor call only, scheduled calls by hand, a survey, and Koji.

Reference table

Ways to research a prospect before a proposal
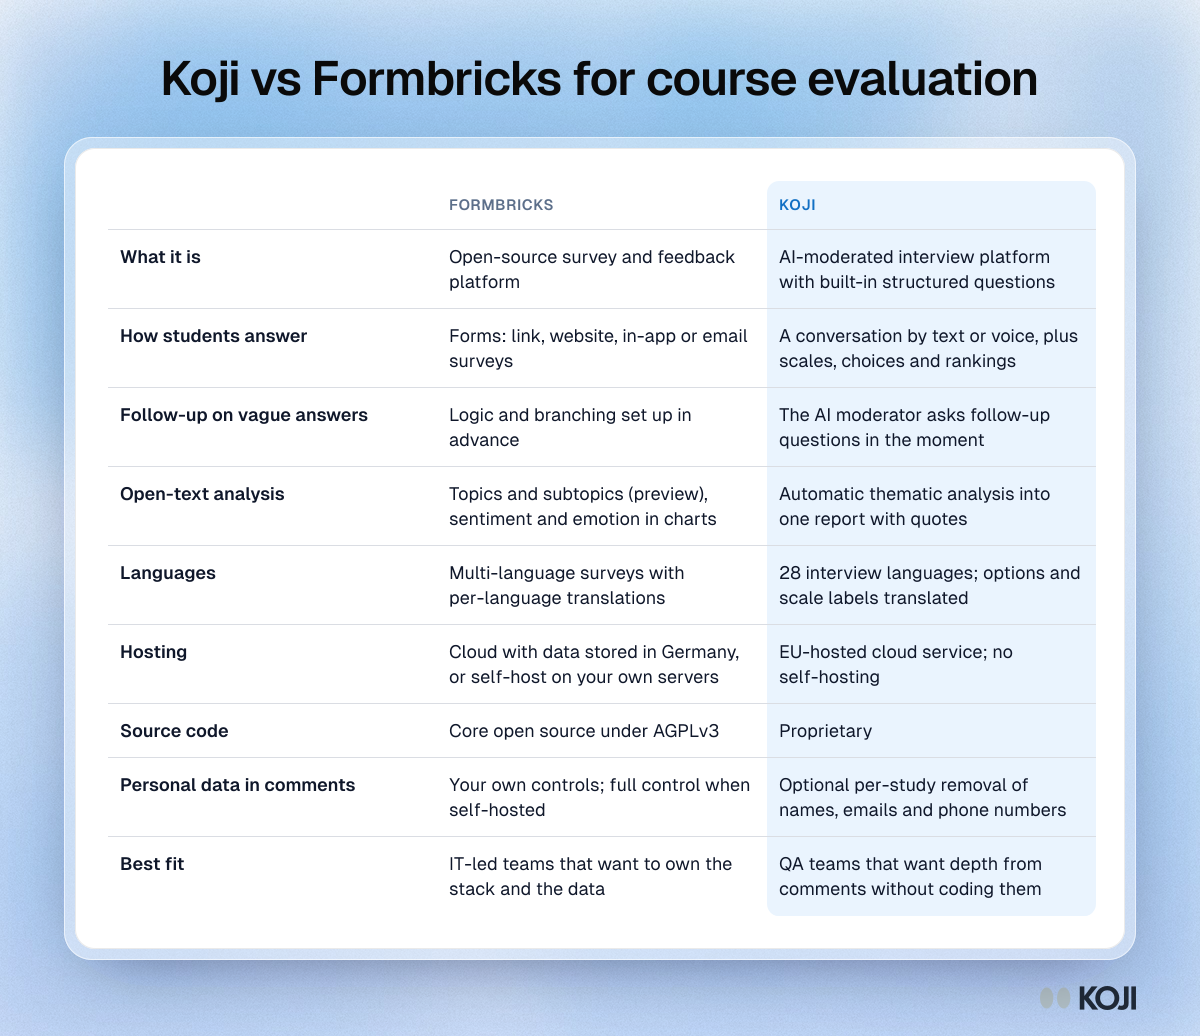
Table comparing Formbricks and Koji for course evaluation across format, follow-up questions, text analysis, languages, hosting, source code and best fit.

Reference table

Koji vs Formbricks for course evaluation
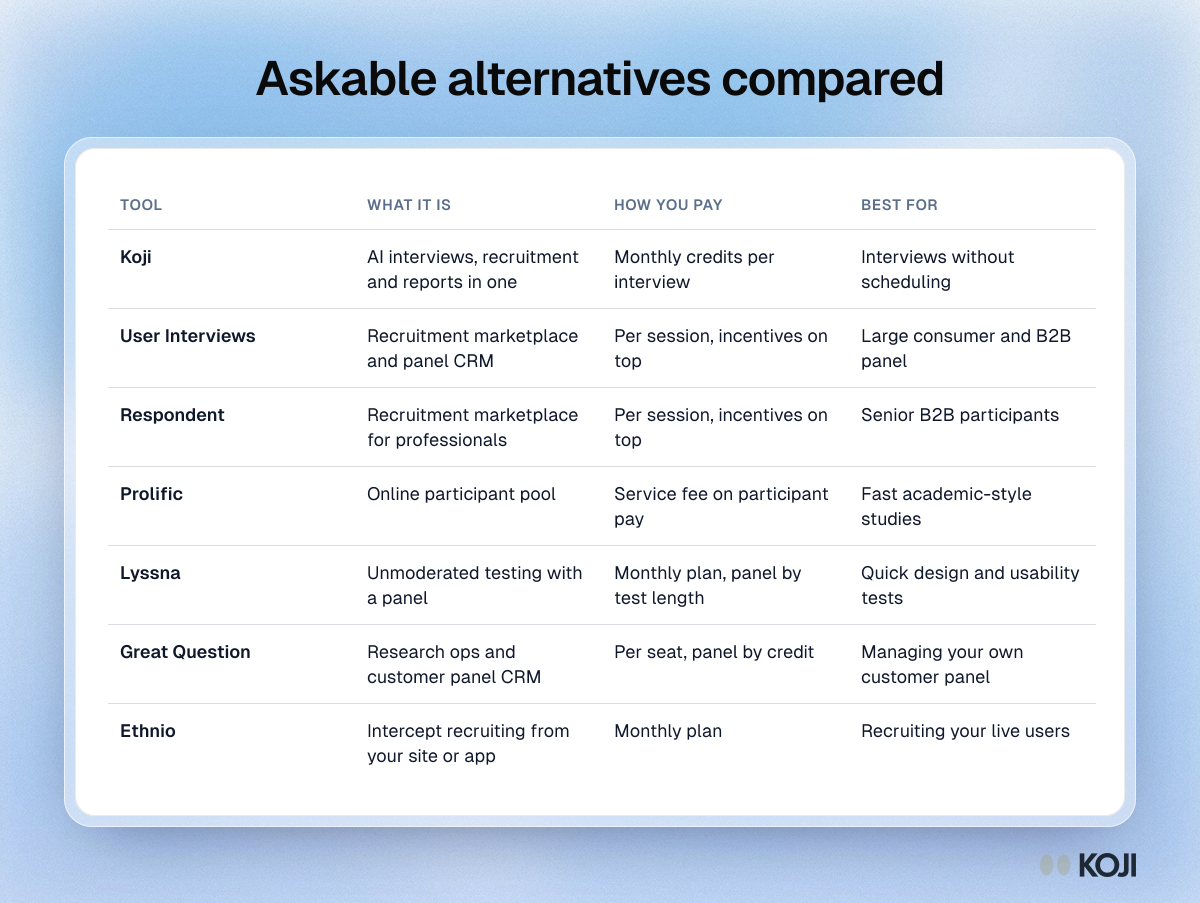
Table comparing Askable alternatives Koji, User Interviews, Respondent, Prolific, Lyssna, Great Question and Ethnio by what they are, how you pay and best use

Reference table

Askable alternatives compared
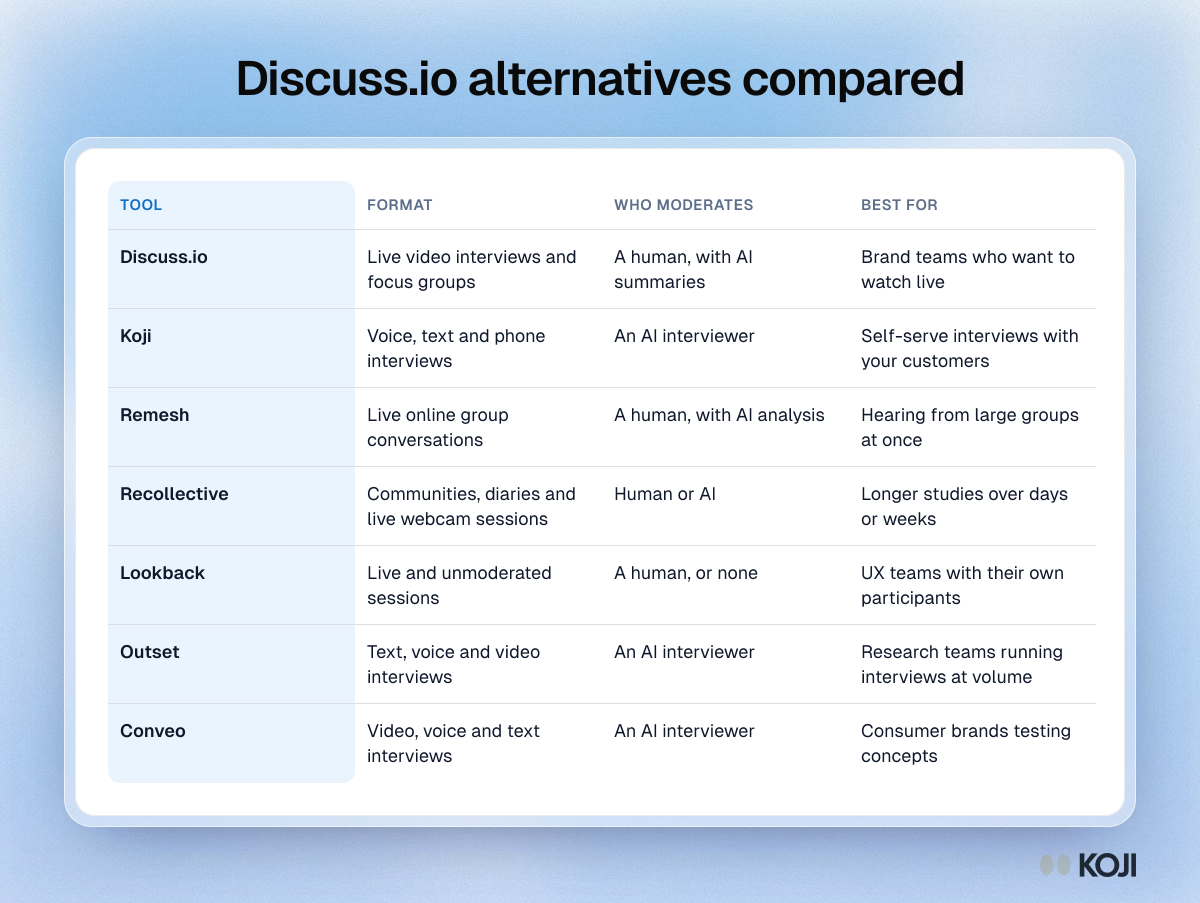
Table comparing Discuss.io with six alternatives, Koji, Remesh, Recollective, Lookback, Outset and Conveo, by format, moderator and best use

Reference table

Discuss.io alternatives compared
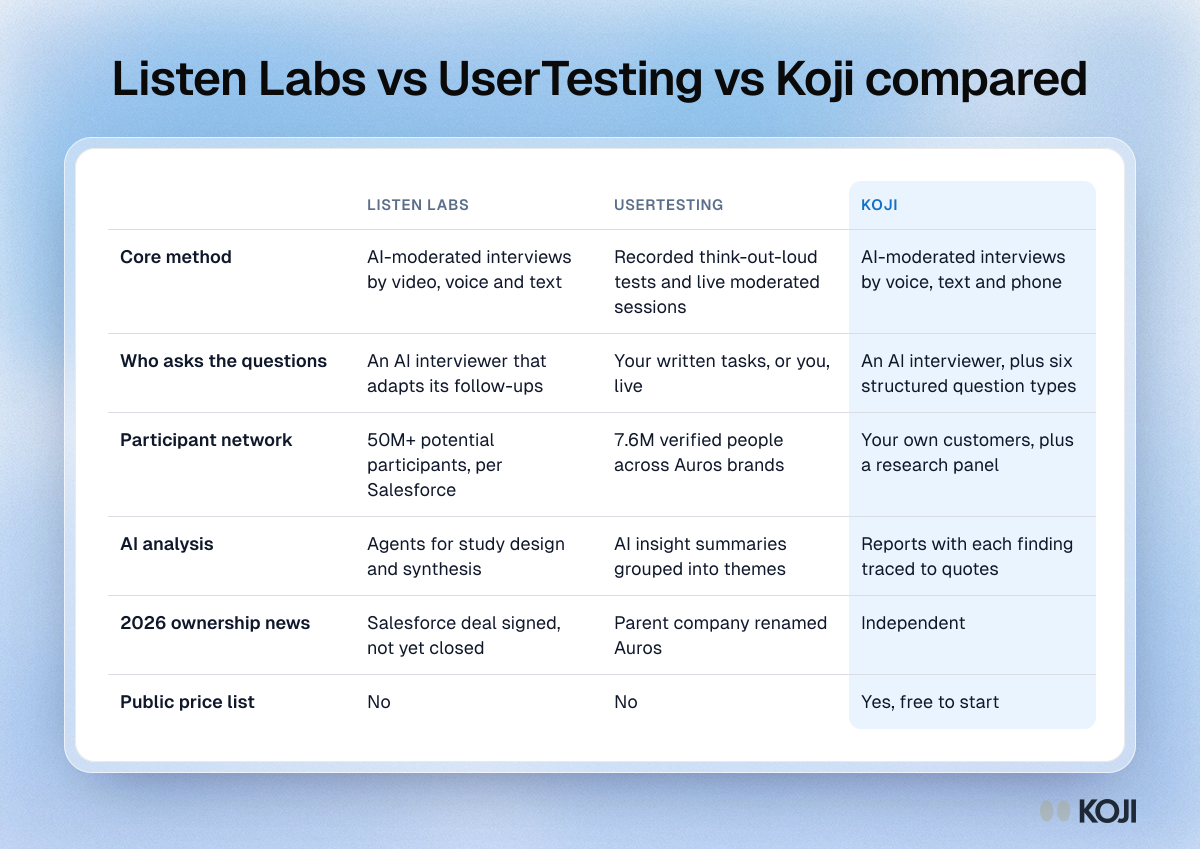
Table comparing Listen Labs, UserTesting and Koji on research method, who asks the questions, participant network, AI analysis, 2026 news and pricing

Reference table

Listen Labs vs UserTesting vs Koji compared
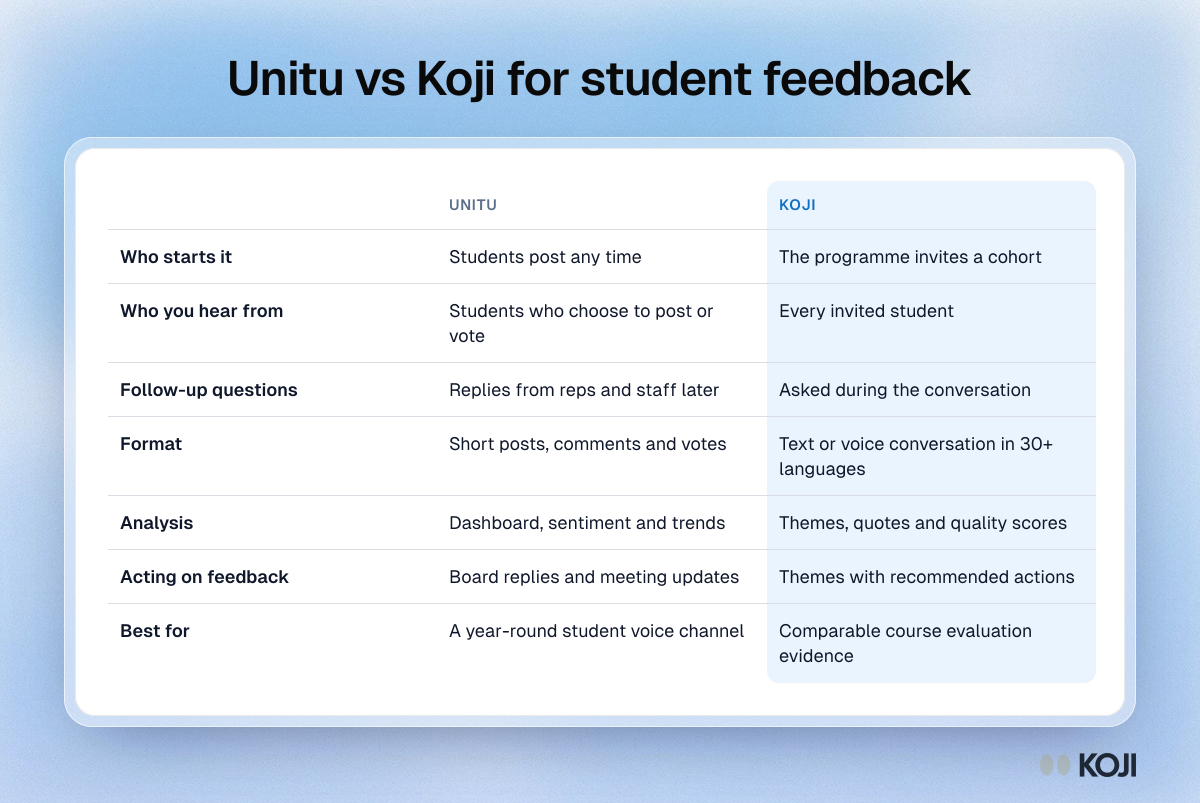
Comparison table of Unitu and Koji for student feedback: who starts it, who you hear from, follow-up questions, analysis and acting on feedback.

Reference table

Unitu vs Koji for student feedback
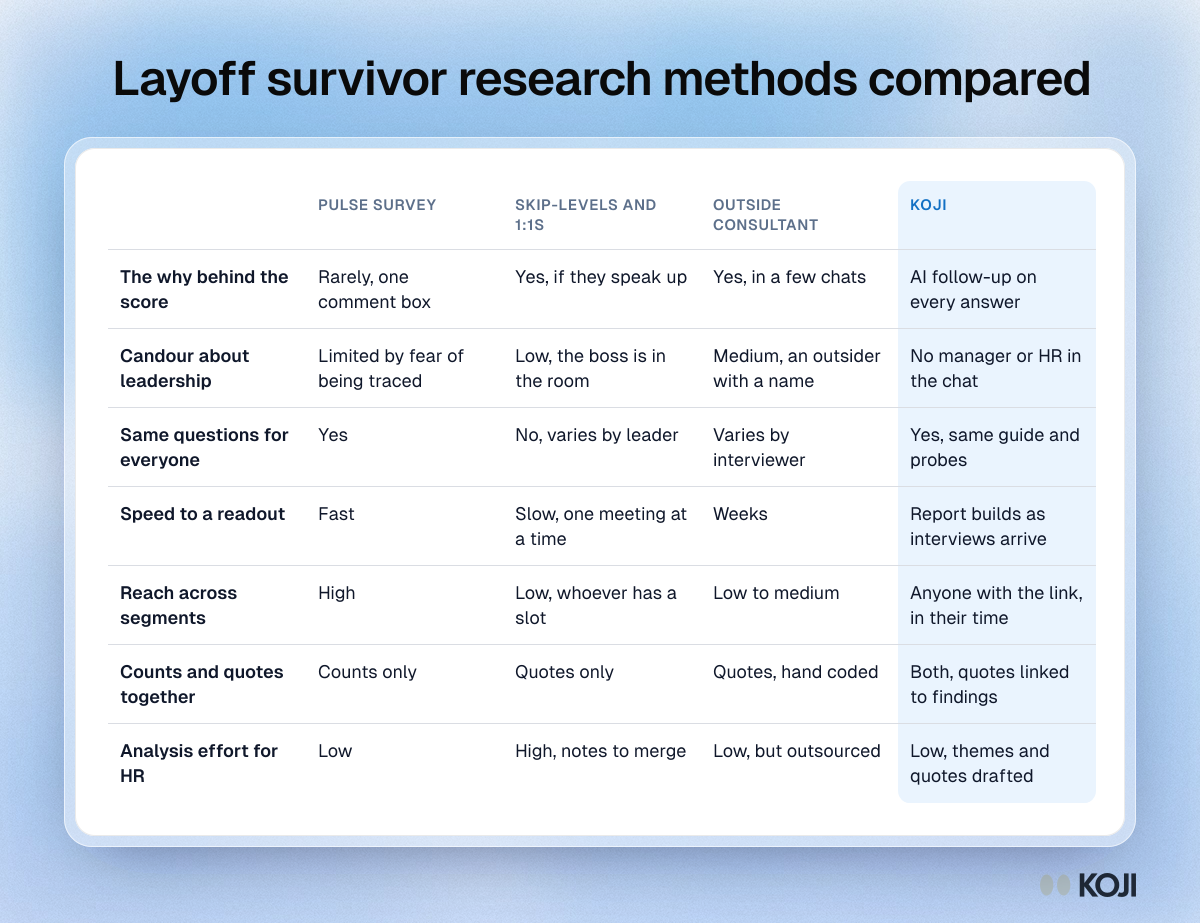
Table comparing a pulse survey, skip-levels and one-to-ones, an outside consultant and Koji for layoff survivor research on seven criteria.

Reference table

Layoff survivor research methods compared
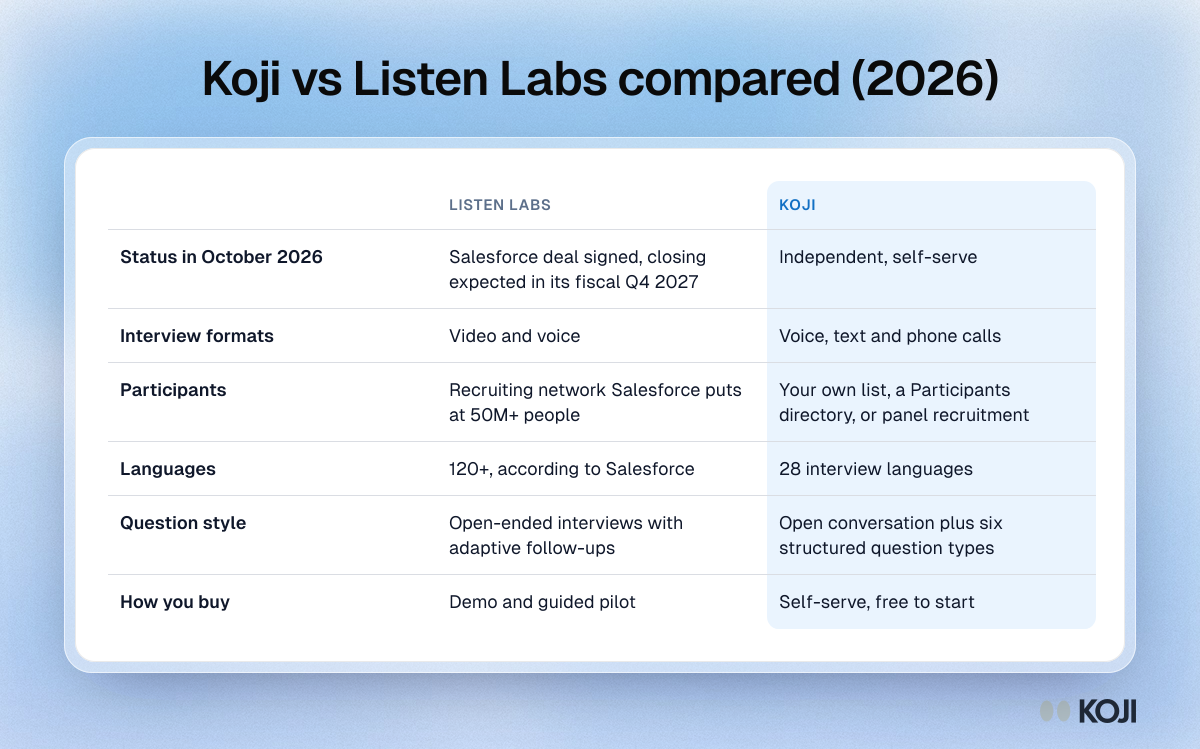
Table comparing Listen Labs and Koji on status, interview formats, participants, languages, question style and how you buy in 2026

Reference table

Koji vs Listen Labs compared (2026)
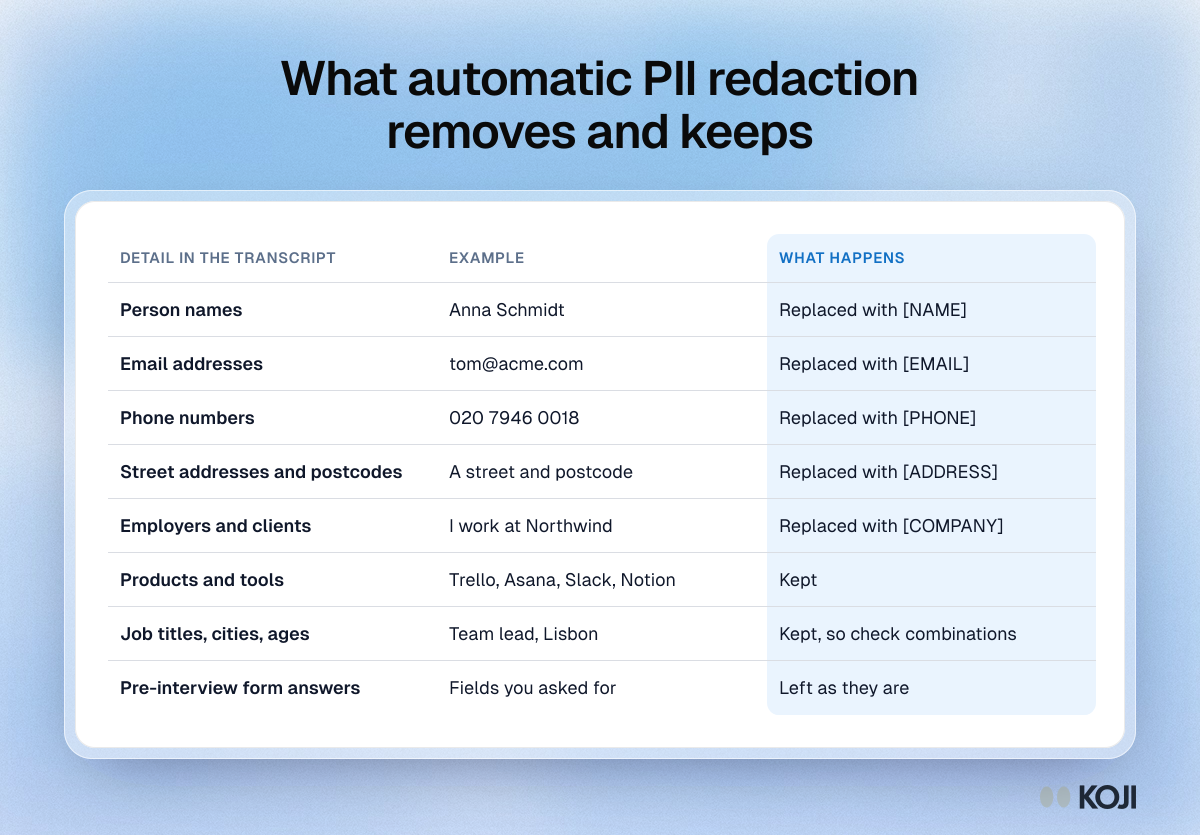
Table comparing what automatic PII redaction removes from an interview transcript, such as names, emails, phones, addresses and employers, with what it keeps

Reference table

What automatic PII redaction removes and keeps
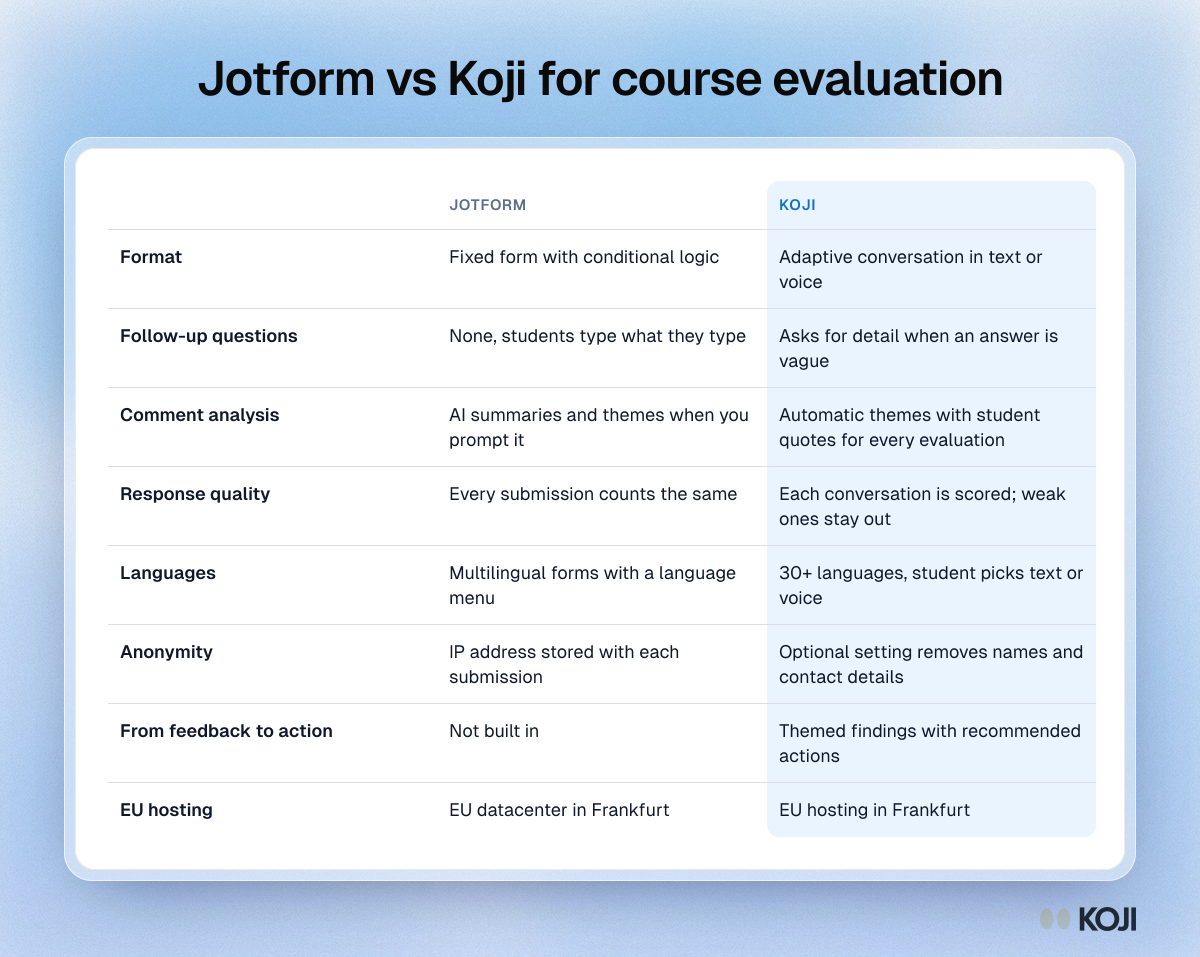
Table comparing Jotform and Koji for course evaluation: format, follow-up questions, comment analysis, languages, anonymity and next steps.

Reference table

Jotform vs Koji for course evaluation
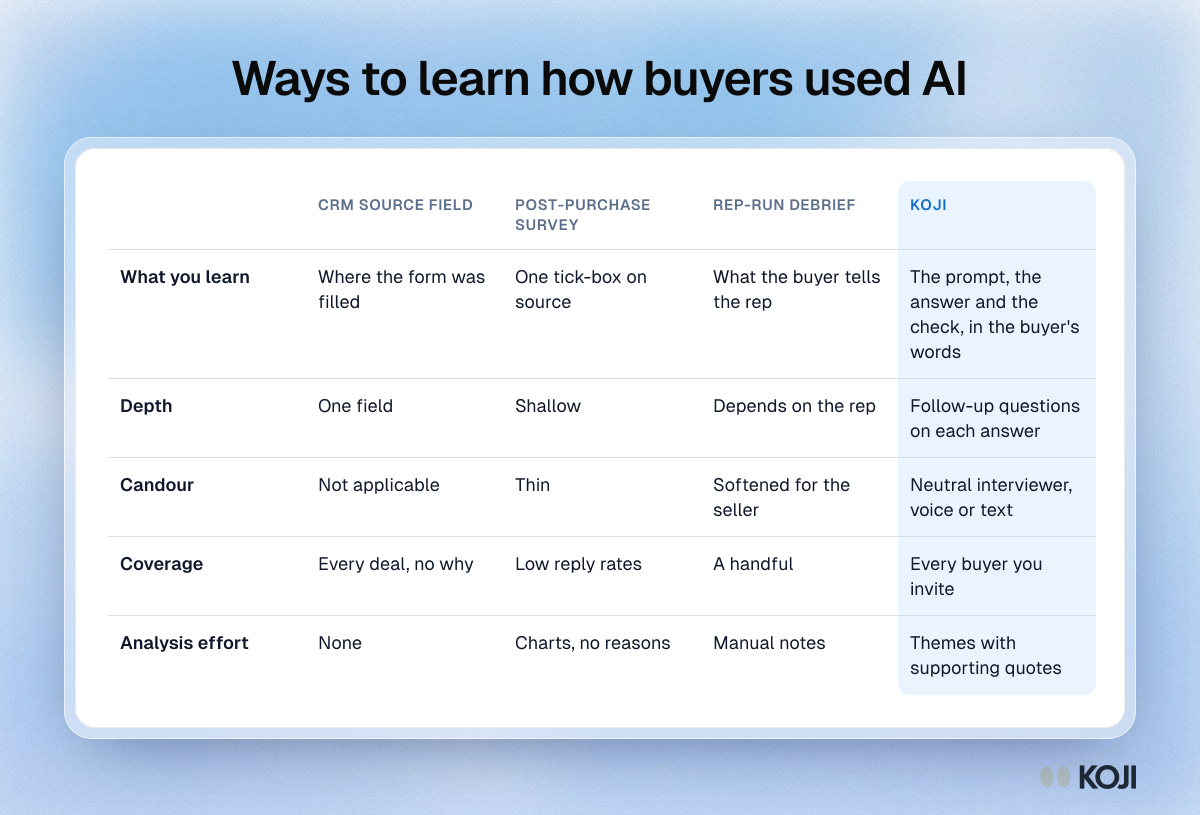
Table comparing a CRM source field, a post-purchase survey, a rep-run debrief and Koji for researching how buyers use AI to shortlist vendors.

Reference table

Ways to learn how buyers used AI
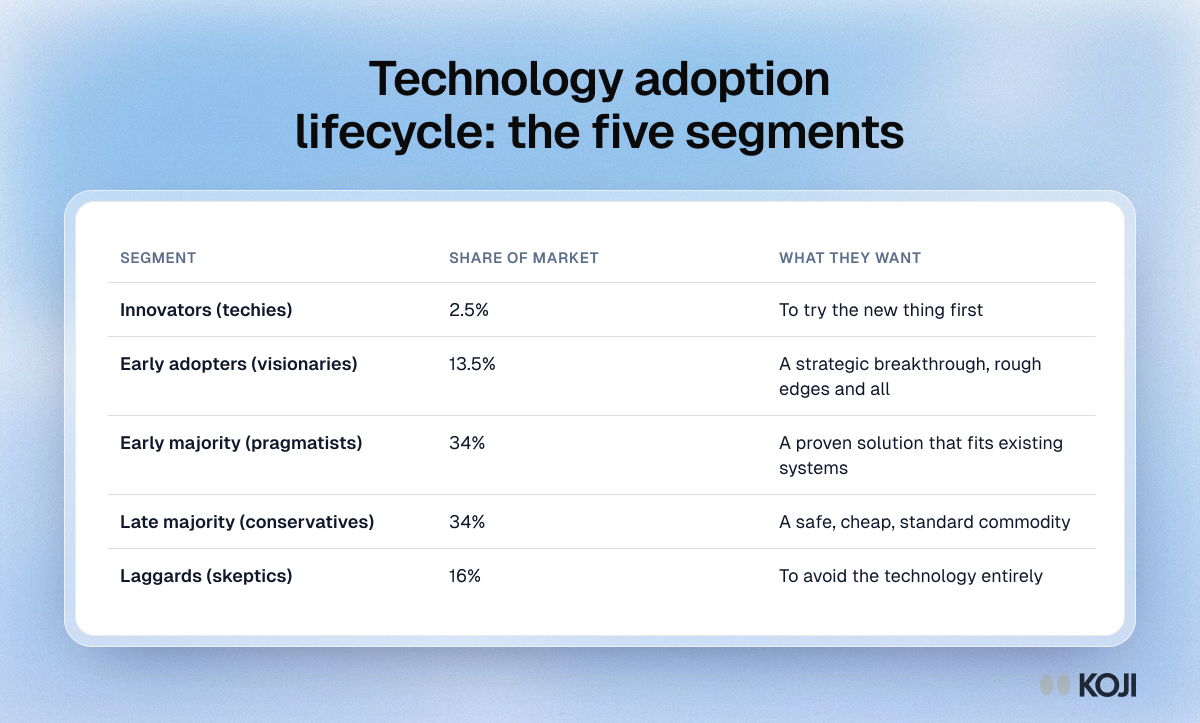
Table of the adoption lifecycle: innovators 2.5%, early adopters 13.5%, early majority 34%, late majority 34% and laggards 16%, plus what each wants.

Reference table

Technology adoption lifecycle: the five segments
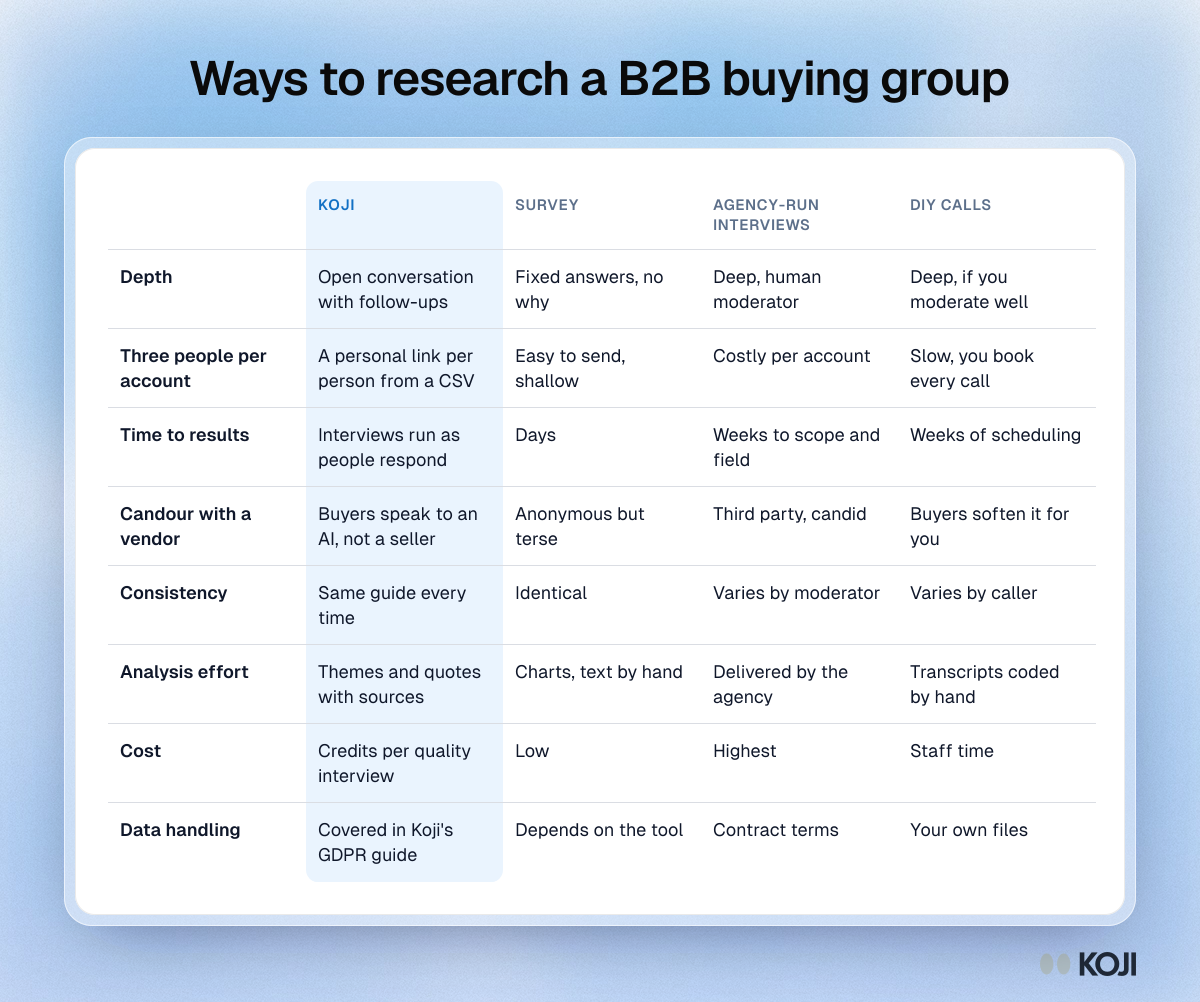
Table comparing Koji, surveys, agency interviews and DIY calls for researching a B2B buying group across eight criteria.

Reference table

Ways to research a B2B buying group
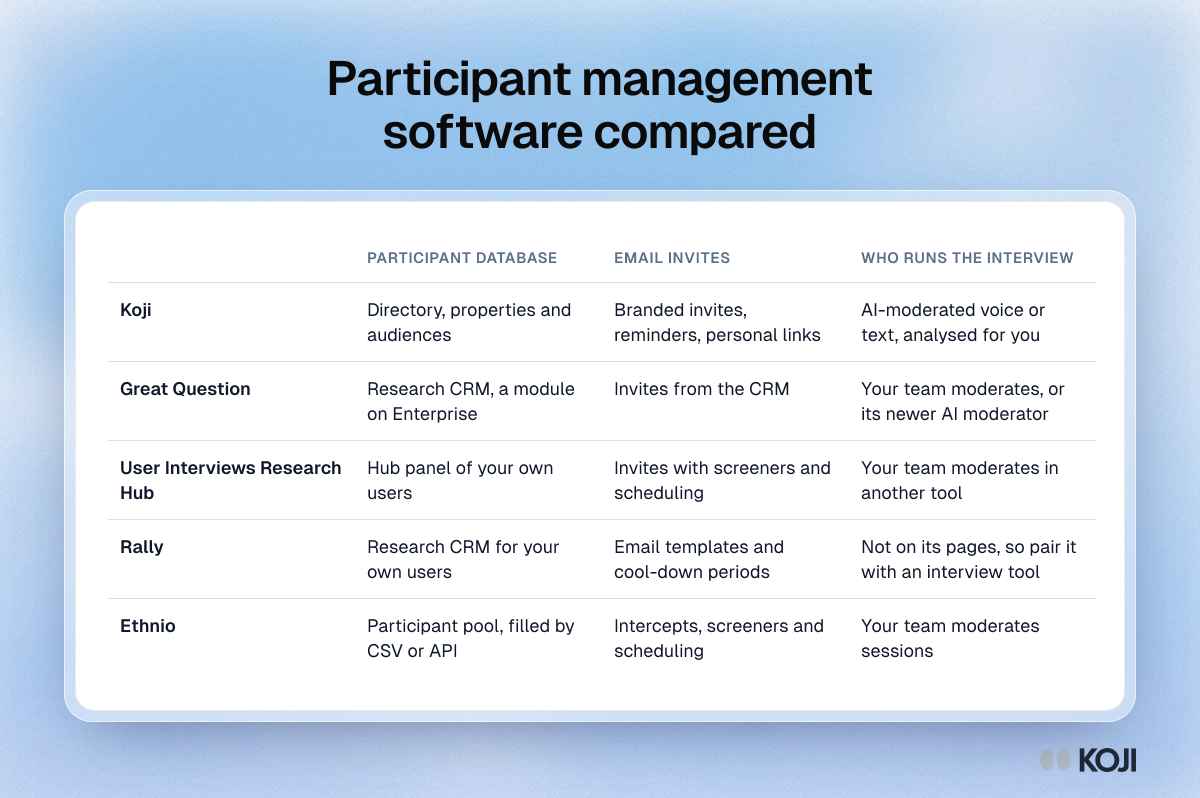
Table comparing Koji, Great Question, User Interviews Research Hub, Rally and Ethnio on participant database, email invitations and who runs the interview.

Reference table

Participant management software compared
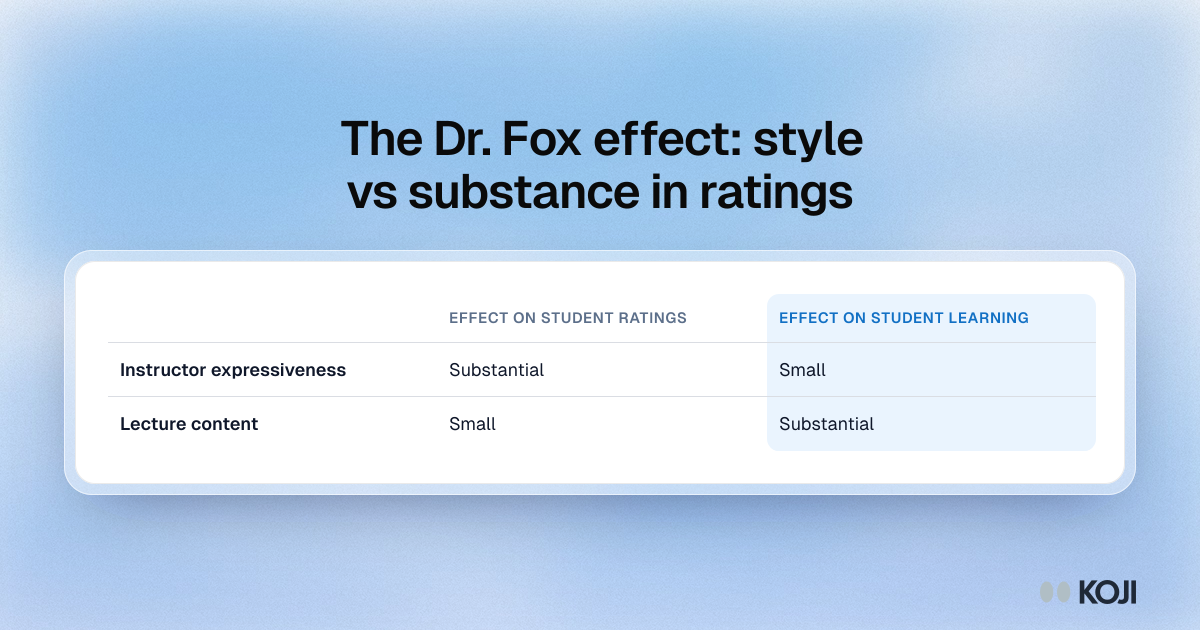
Table showing that instructor expressiveness has a substantial effect on student ratings and a small one on learning, while lecture content shows the reverse.

Reference table

The Dr. Fox effect: style vs substance in ratings
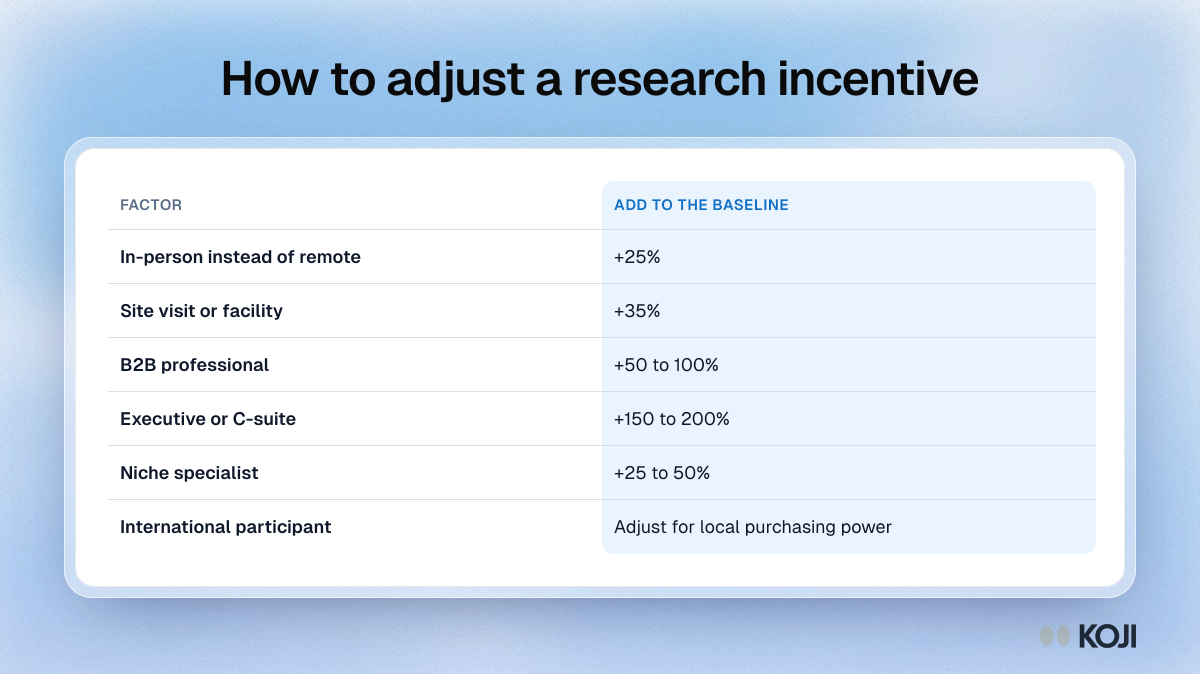
Table showing how much to raise a research incentive for in-person sessions, site visits, B2B and executive participants, specialists and other countries.

Reference table

How to adjust a research incentive
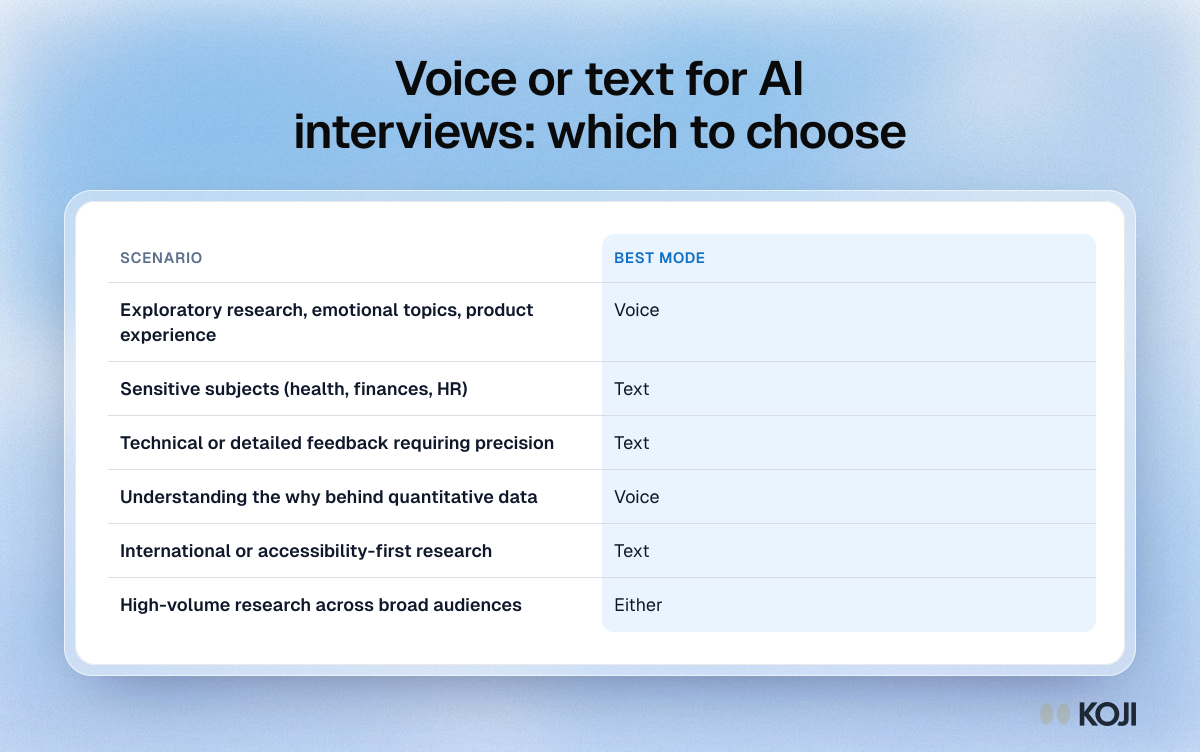
Table matching six research scenarios to voice or text mode for AI-moderated interviews, such as sensitive topics suiting text.

Reference table

Voice or text for AI interviews: which to choose
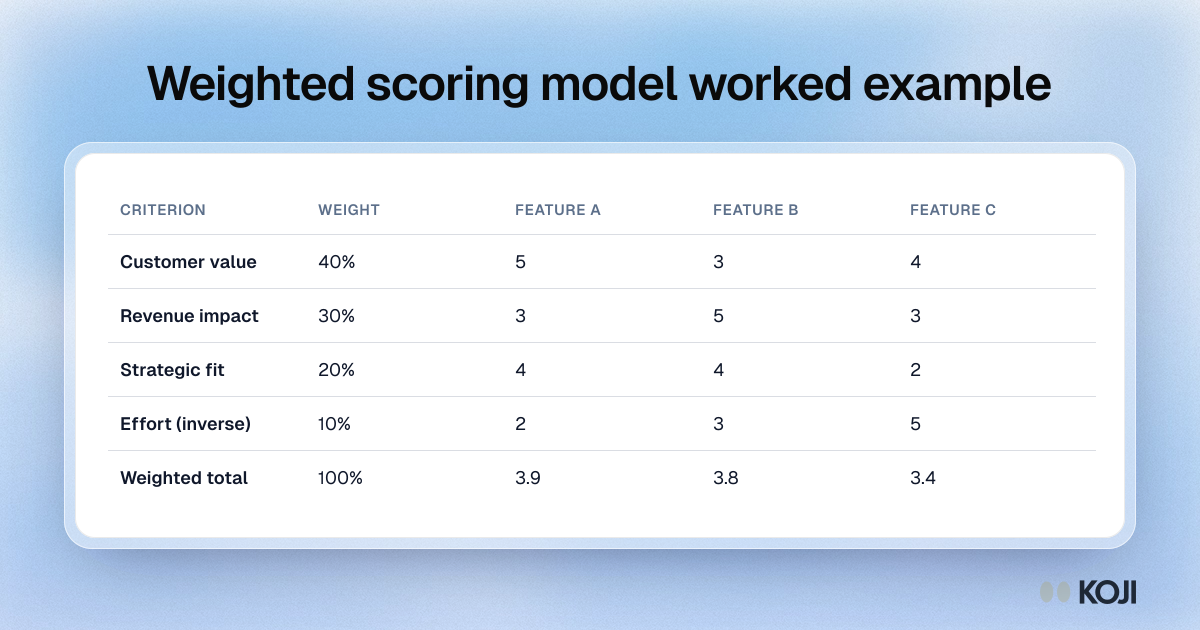
Table scoring three features against four weighted criteria, with weighted totals of 3.9 for Feature A, 3.8 for Feature B and 3.4 for Feature C.

Reference table

Weighted scoring model worked example
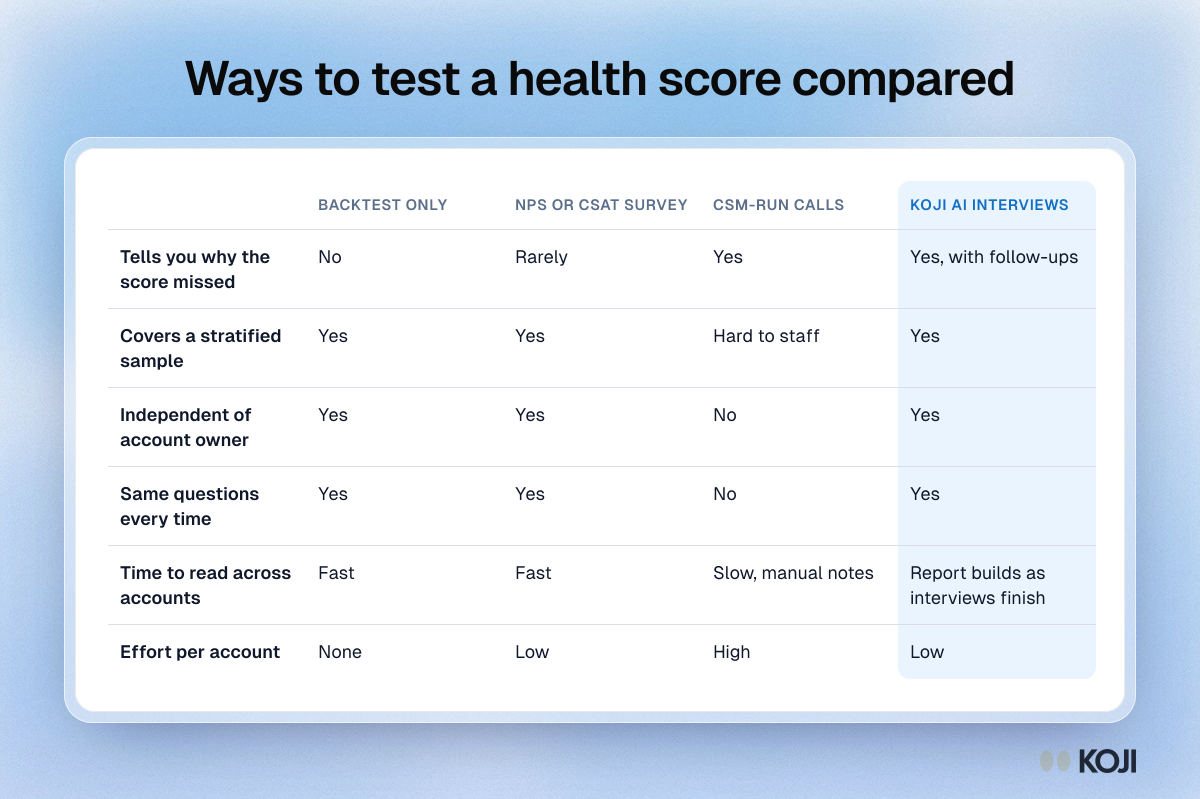
Table comparing a backtest, NPS or CSAT surveys, CSM-run calls and Koji AI interviews for testing a customer health score.

Reference table

Ways to test a health score compared
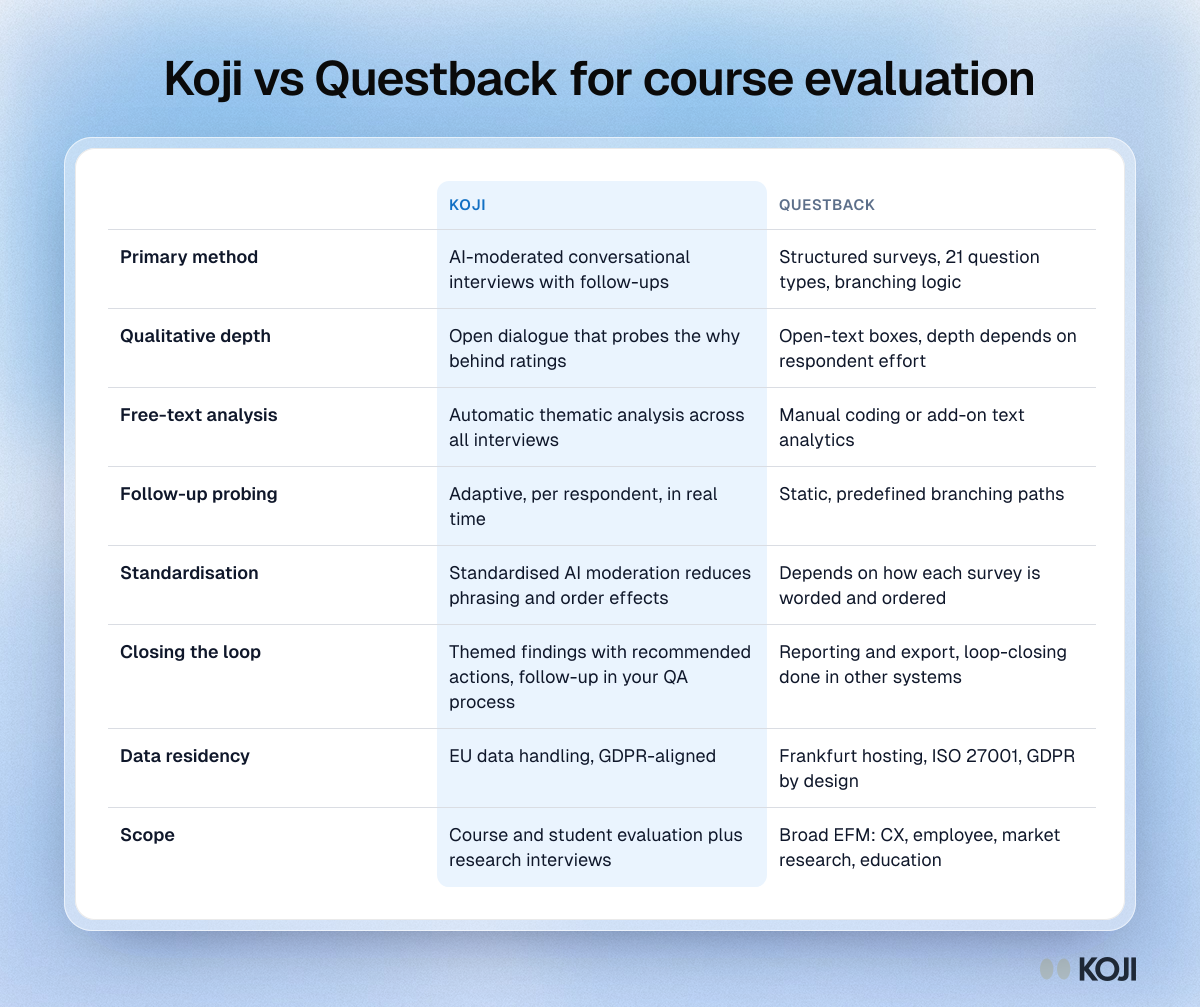
Table comparing Koji and Questback for course evaluation on method, qualitative depth, free-text analysis, follow-up, standardisation and data residency.

Reference table

Koji vs Questback for course evaluation
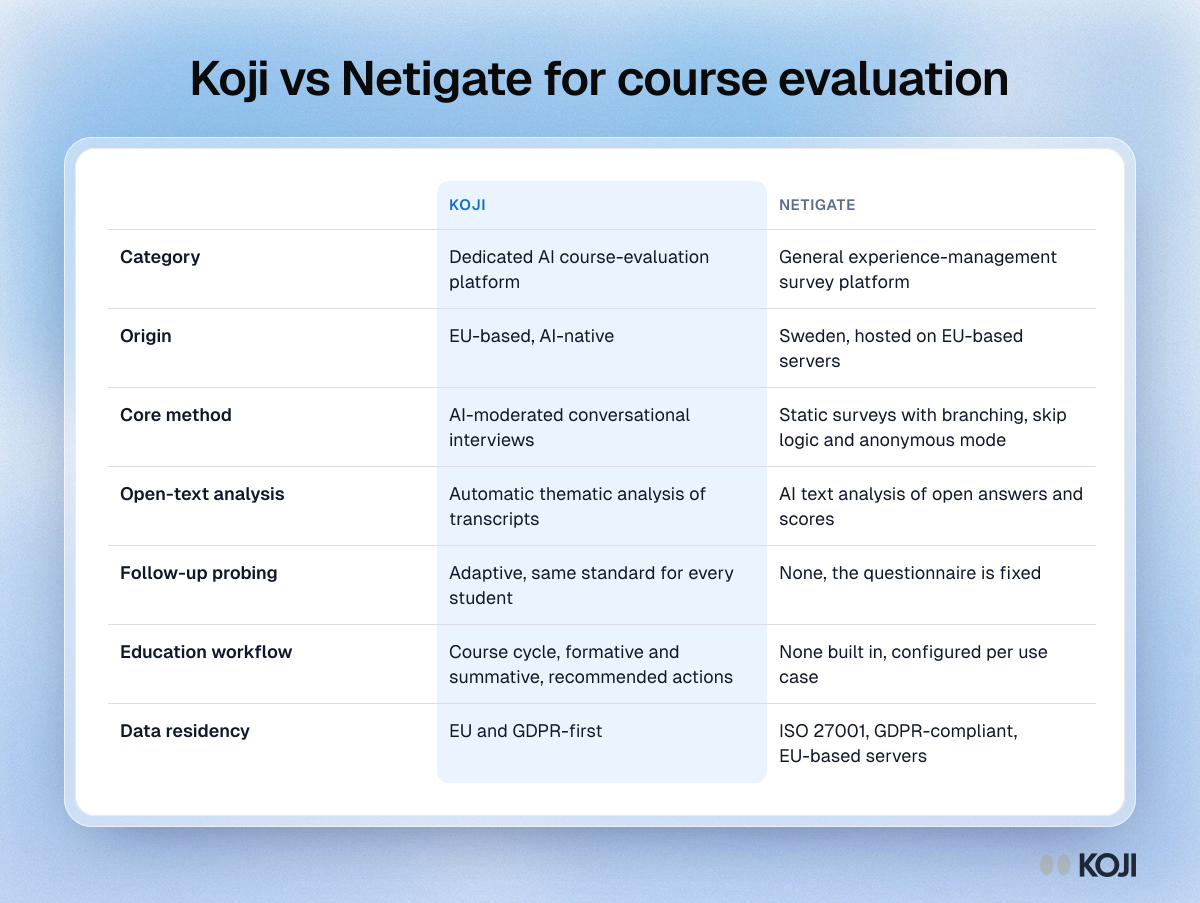
Table comparing Koji and Netigate for course evaluation on category, method, open-text analysis, follow-up probing, education workflow and data residency.

Reference table

Koji vs Netigate for course evaluation
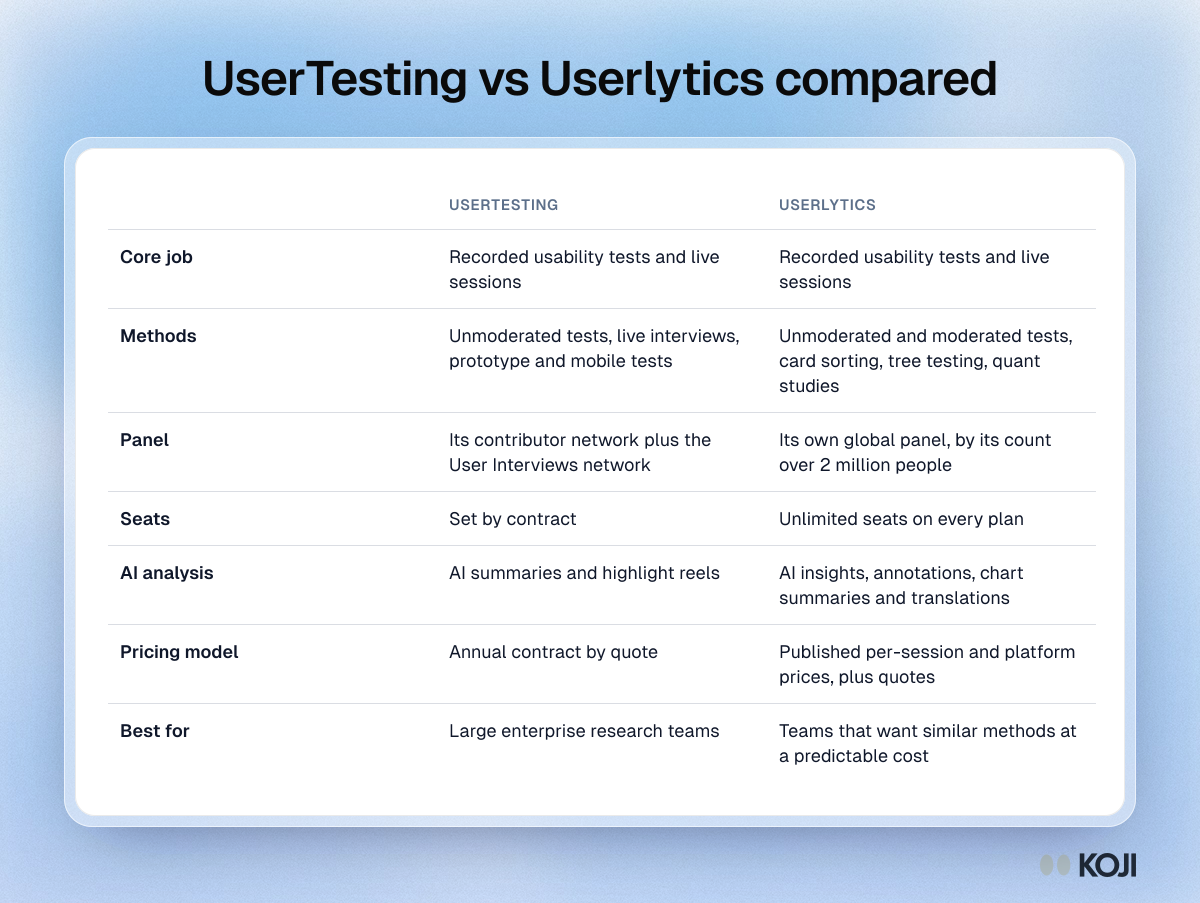
Table comparing UserTesting and Userlytics on methods, panel, seats, AI analysis, pricing model and the teams each one suits best.

Reference table

UserTesting vs Userlytics compared
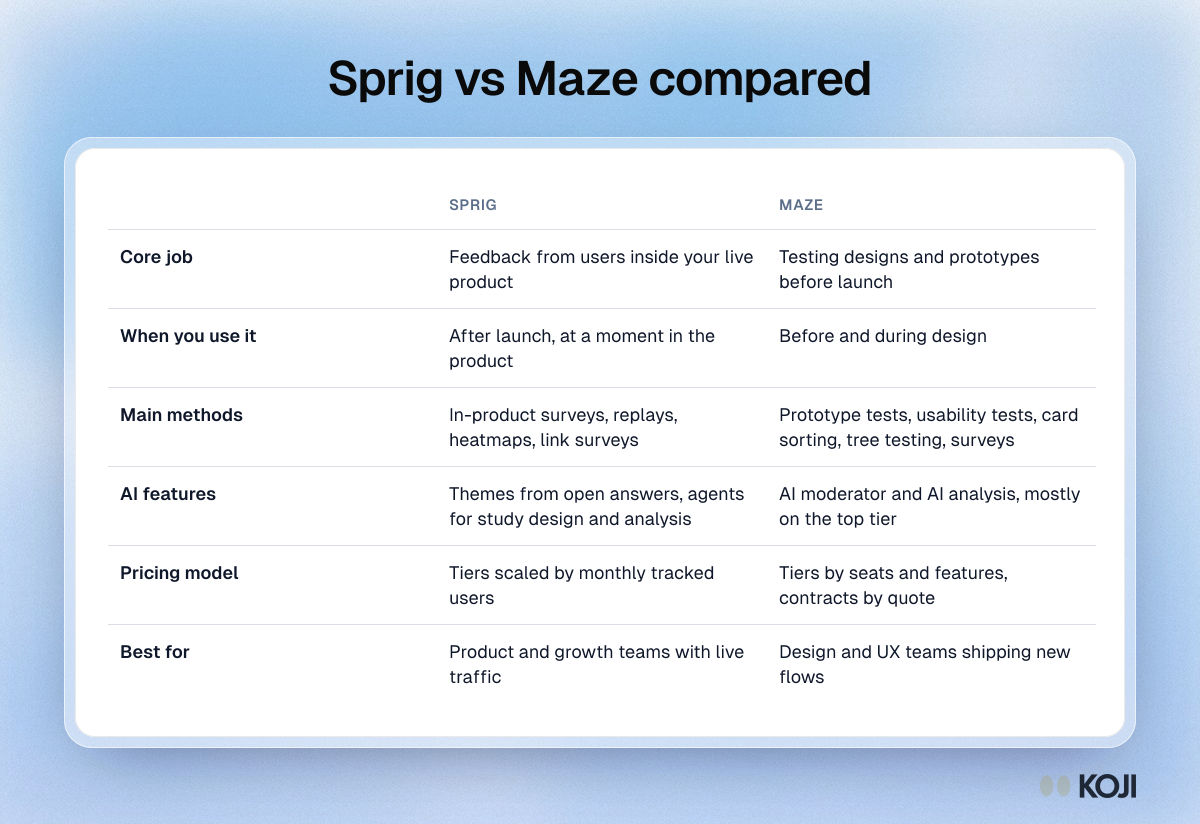
Table comparing Sprig and Maze on core job, timing, methods, AI features, pricing model and the teams each one suits best.

Reference table

Sprig vs Maze compared
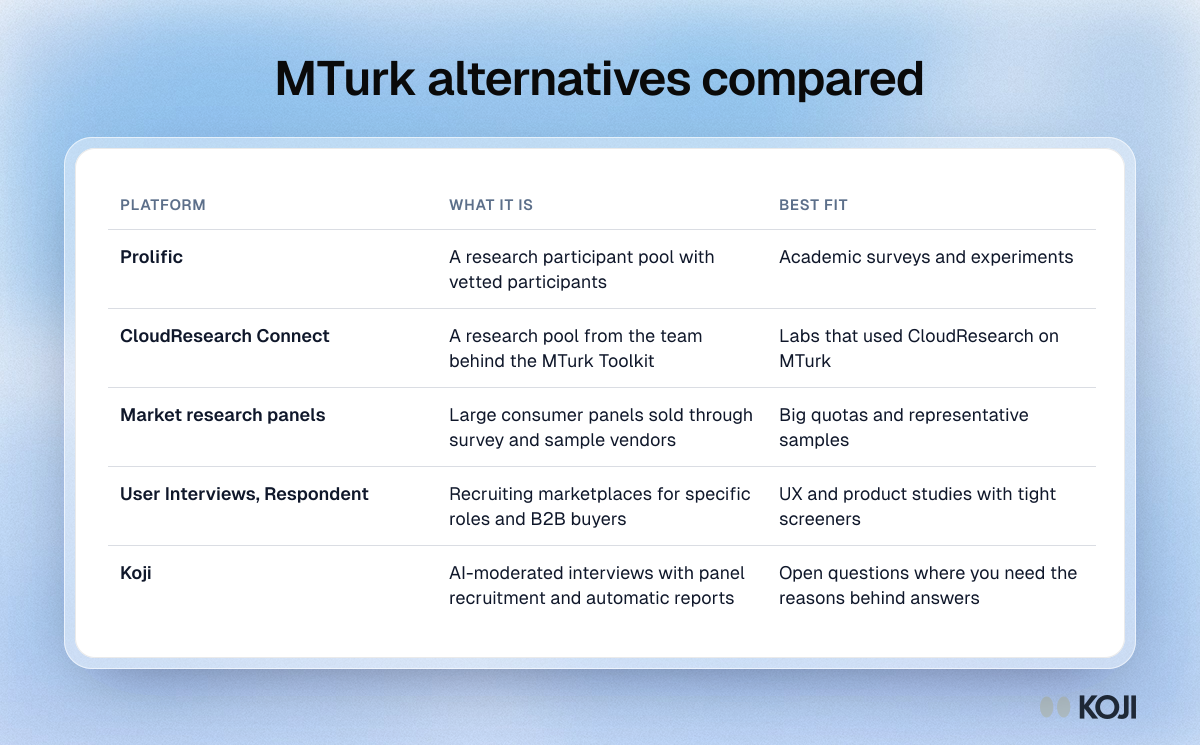
Table comparing five MTurk alternatives, from Prolific and CloudResearch Connect to Koji, by what each platform is and the studies it suits.

Reference table

MTurk alternatives compared
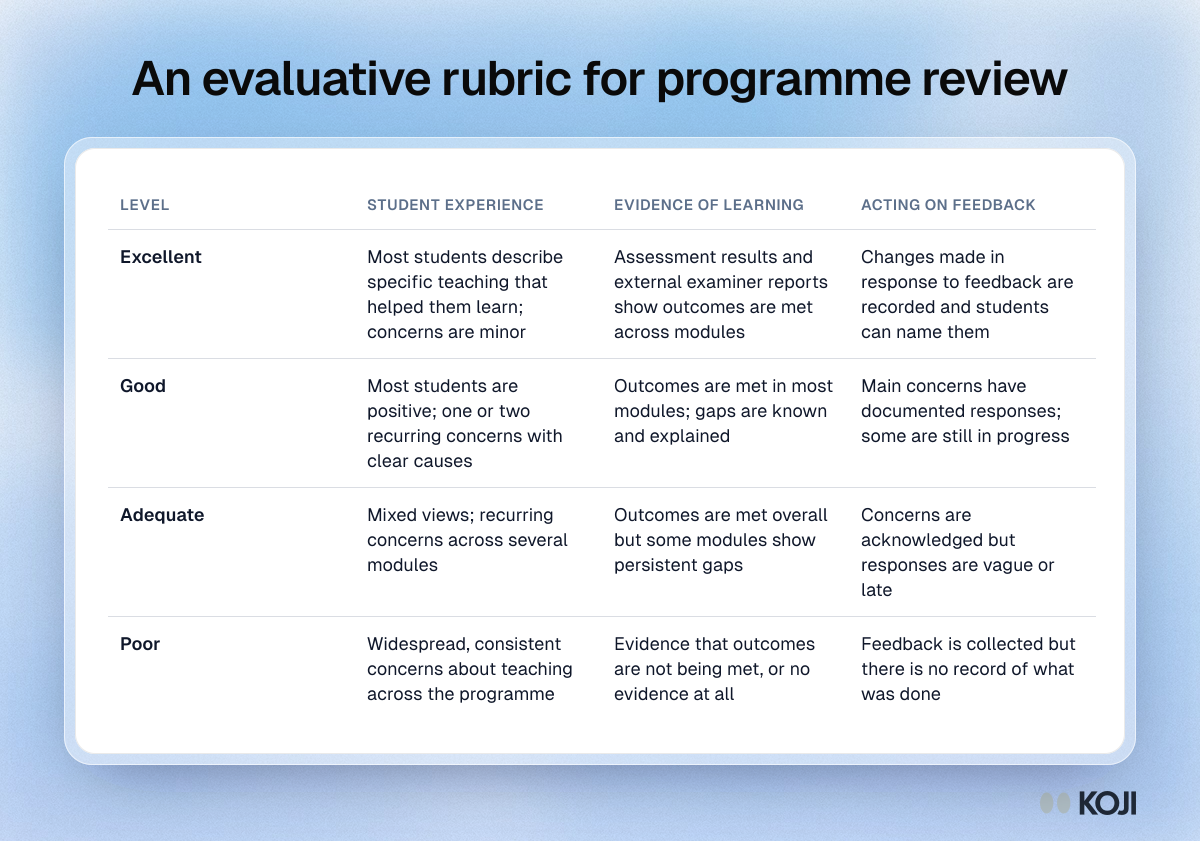
Table showing an evaluative rubric for programme review that rates student experience, learning evidence and acting on feedback from excellent to poor.
Reference table

An evaluative rubric for programme review

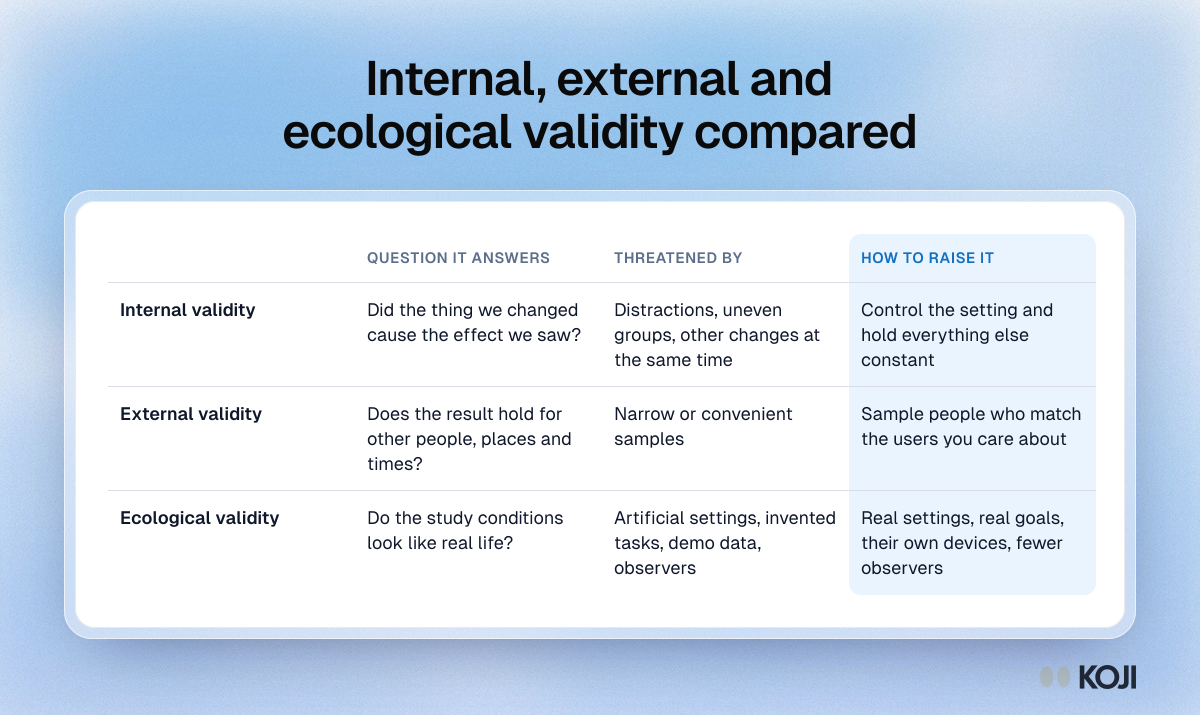
Table comparing internal, external and ecological validity: the question each answers, what threatens it and how to raise it

Reference table

Internal, external and ecological validity compared
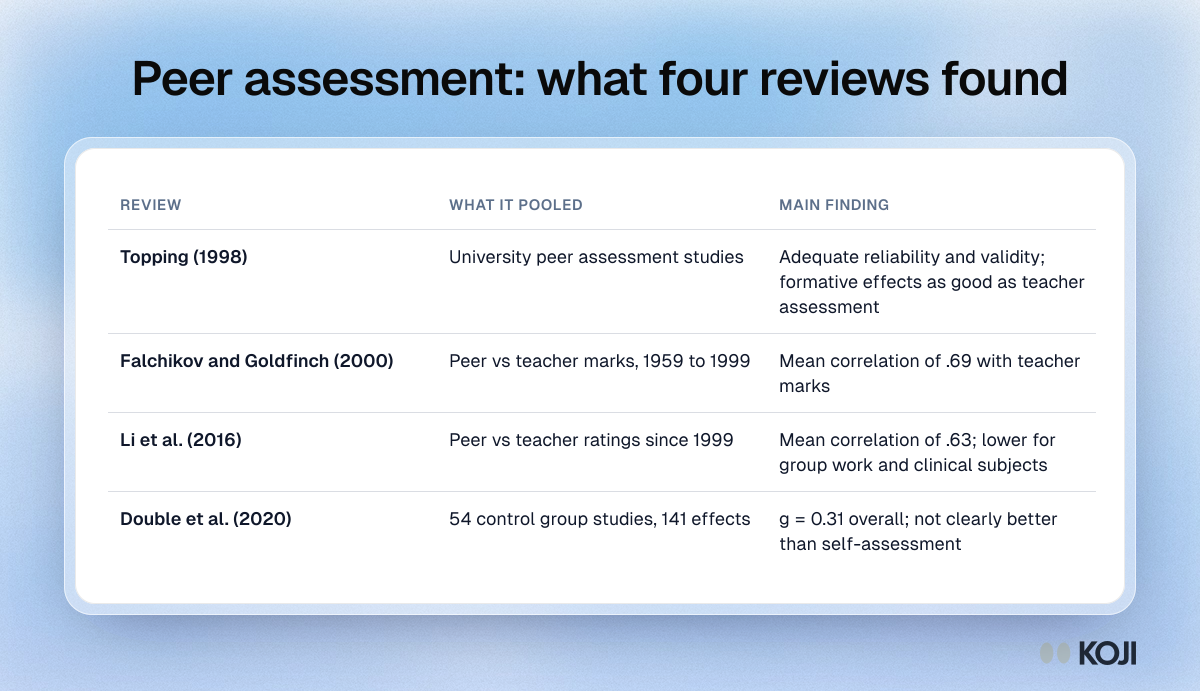
Table comparing four peer assessment reviews, from Topping 1998 to Double et al. 2020, with what each pooled and its main finding.

Reference table

Peer assessment: what four reviews found
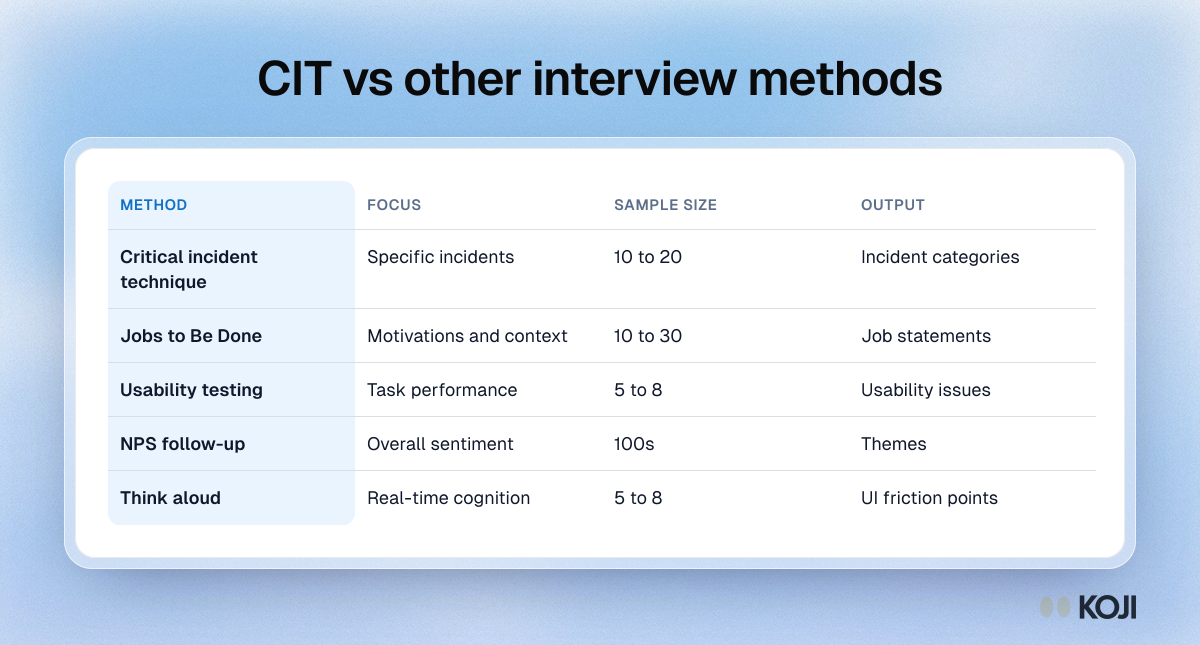
Table comparing critical incident technique, Jobs to Be Done, usability testing, NPS follow-up and think aloud by focus, sample size and output.

Reference table

CIT vs other interview methods