Free to save and share

Frameworks and cheat sheets for customer research

Every framework, checklist and comparison from our guides, as an image you can download, drop into a deck or share with your team.
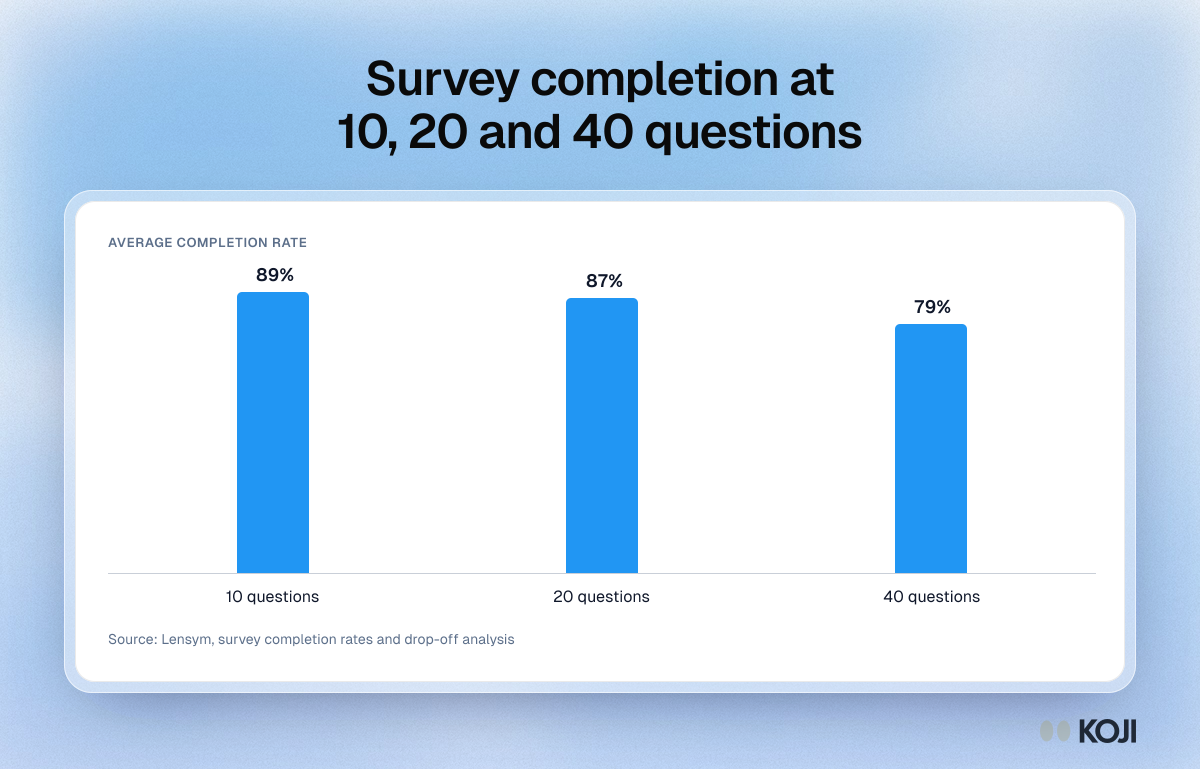
Column chart of average survey completion rate by length: 89% at 10 questions, 87% at 20 questions and 79% at 40 questions.

Column chart

Survey completion at 10, 20 and 40 questions
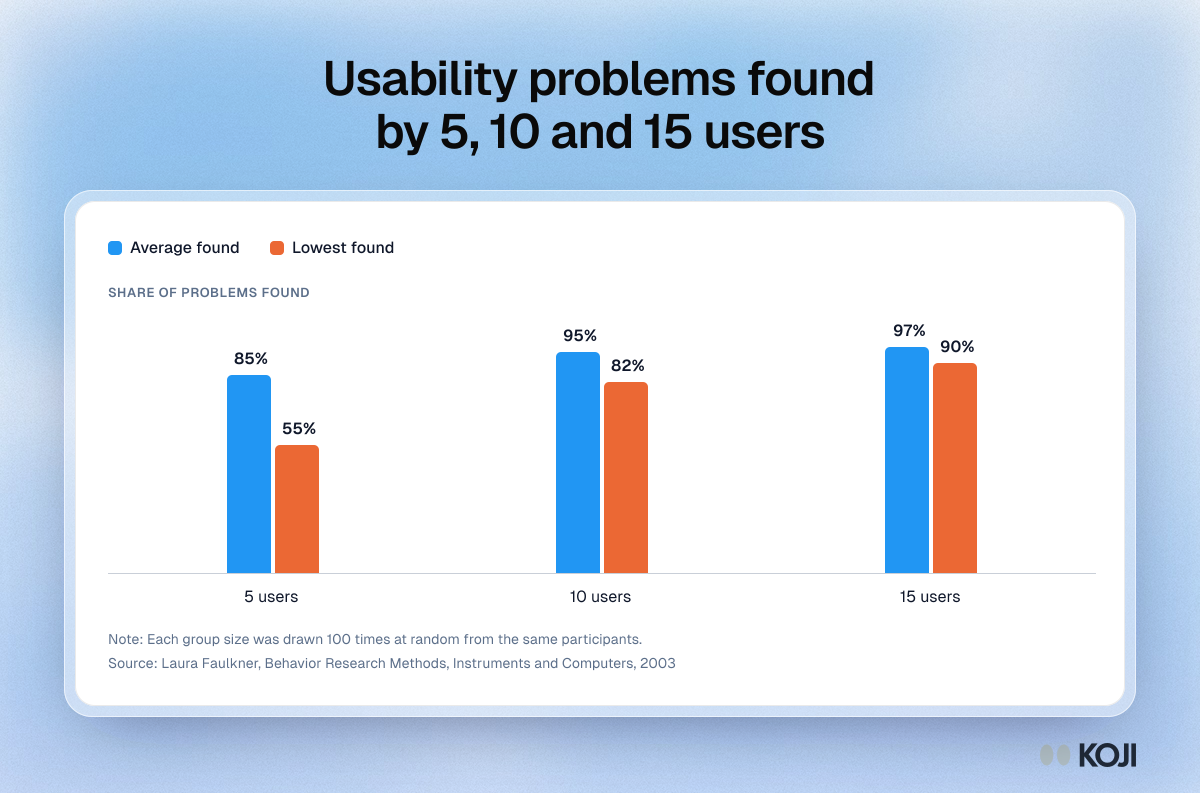
Column chart from Faulkner 2003: 5 users found 85% of usability problems on average but 55% at worst, 10 users 95% and 82%, 15 users 97% and 90%.

Column chart

Usability problems found by 5, 10 and 15 users
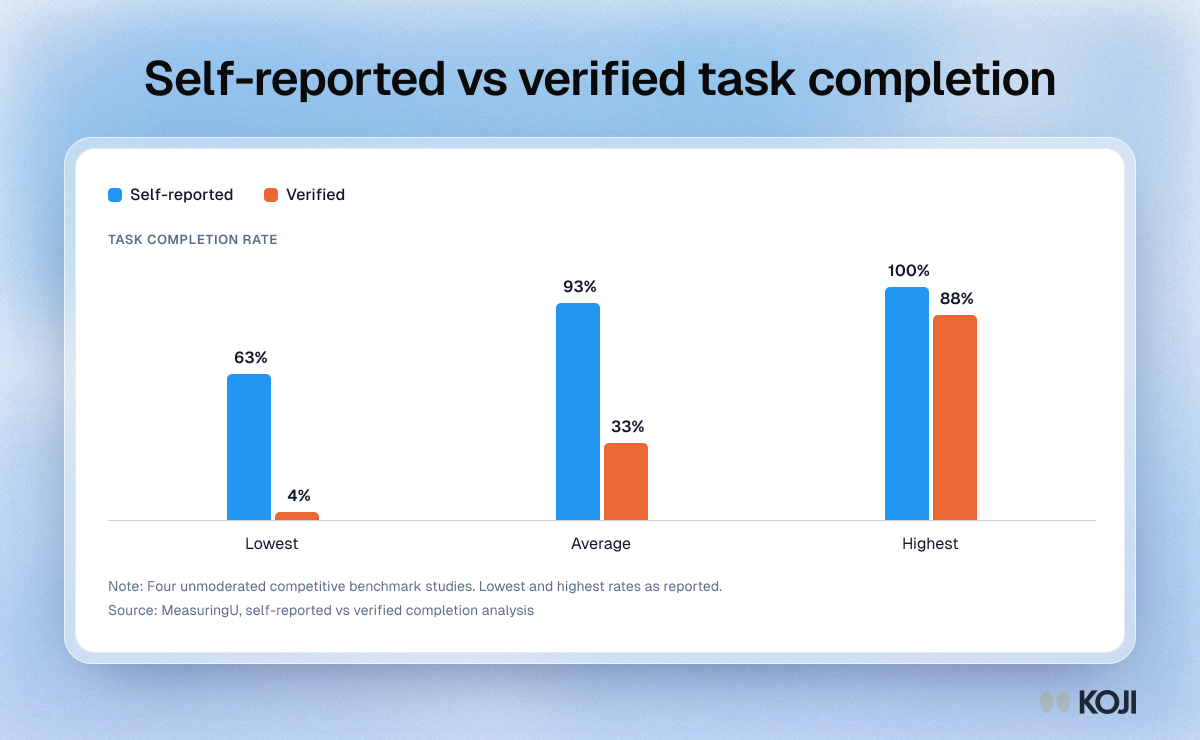
Column chart of self-reported vs verified task completion in four unmoderated studies: average 93% said, 33% verified, lowest 63% vs 4%.
Column chart

Self-reported vs verified task completion

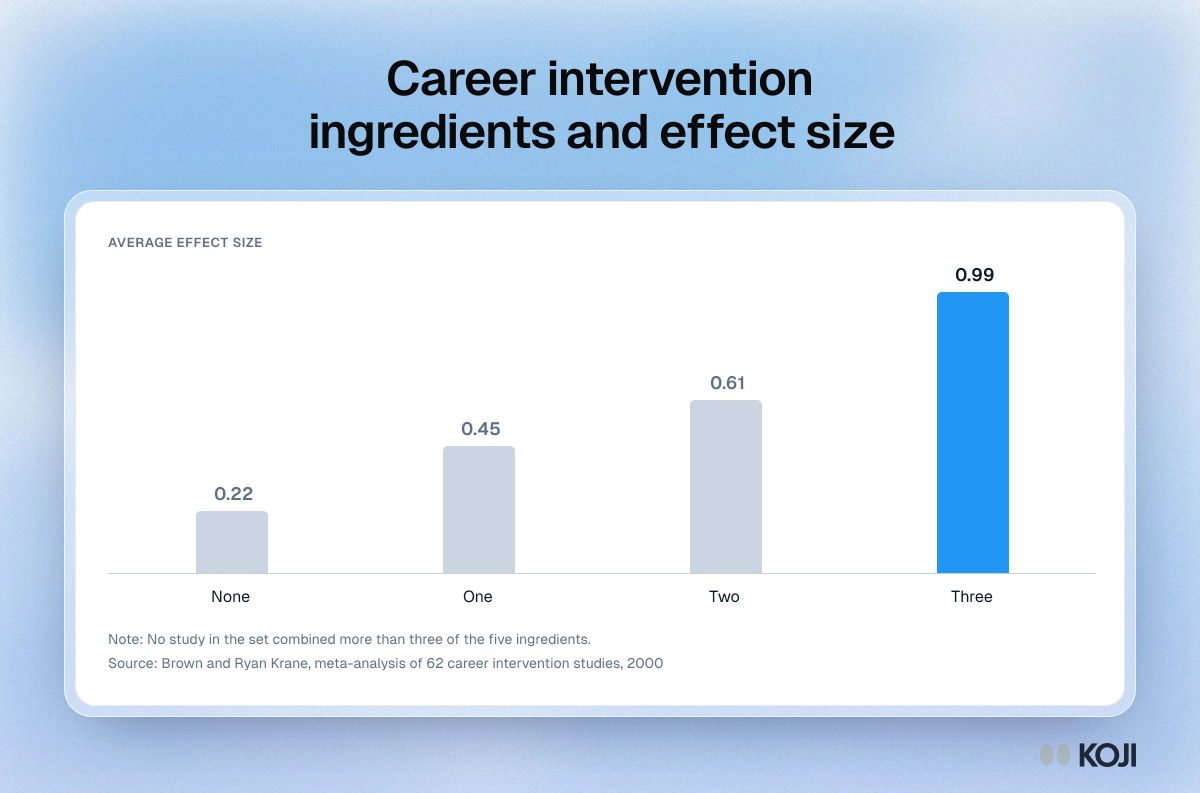
Column chart of average effect size by number of critical ingredients in a career intervention: 0.22 with none, 0.45 with one, 0.61 with two, 0.99 with three.

Column chart

Career intervention ingredients and effect size
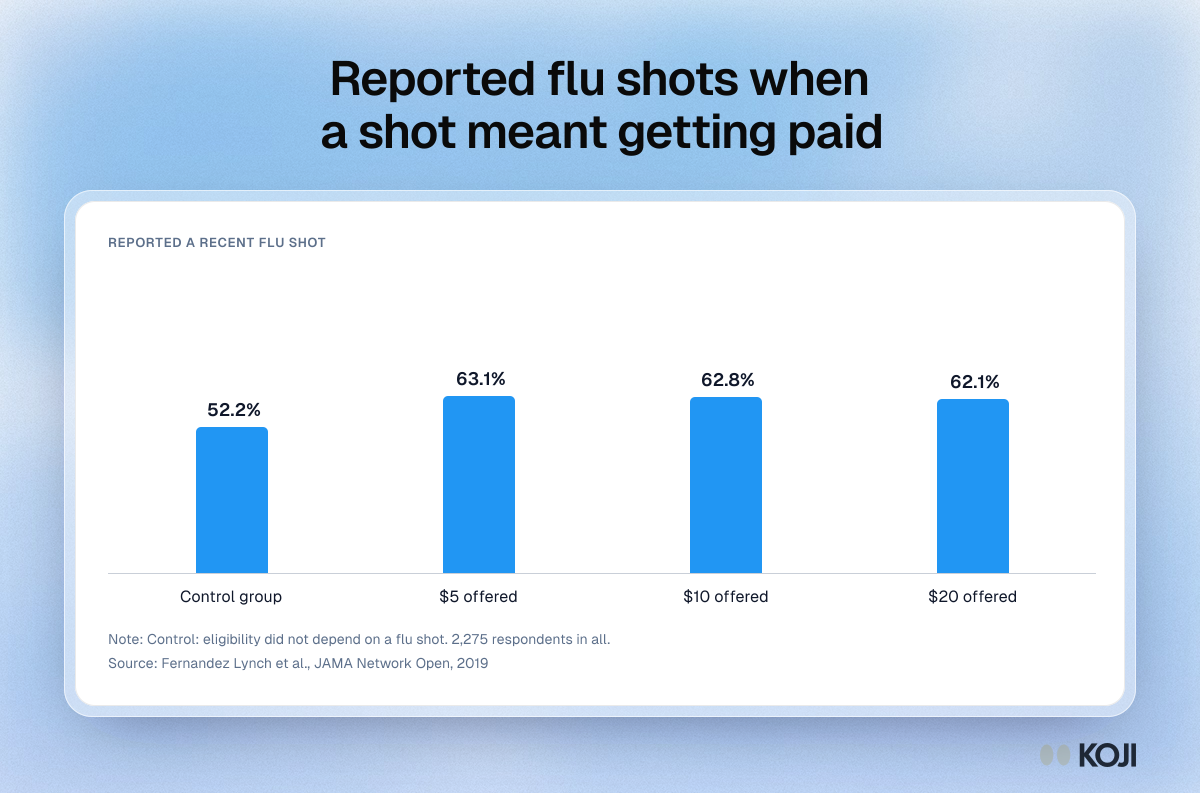
Column chart: 52.2% reported a recent flu shot when it made no difference, and about 62% to 63% when it made them eligible for pay.

Column chart

Reported flu shots when a shot meant getting paid
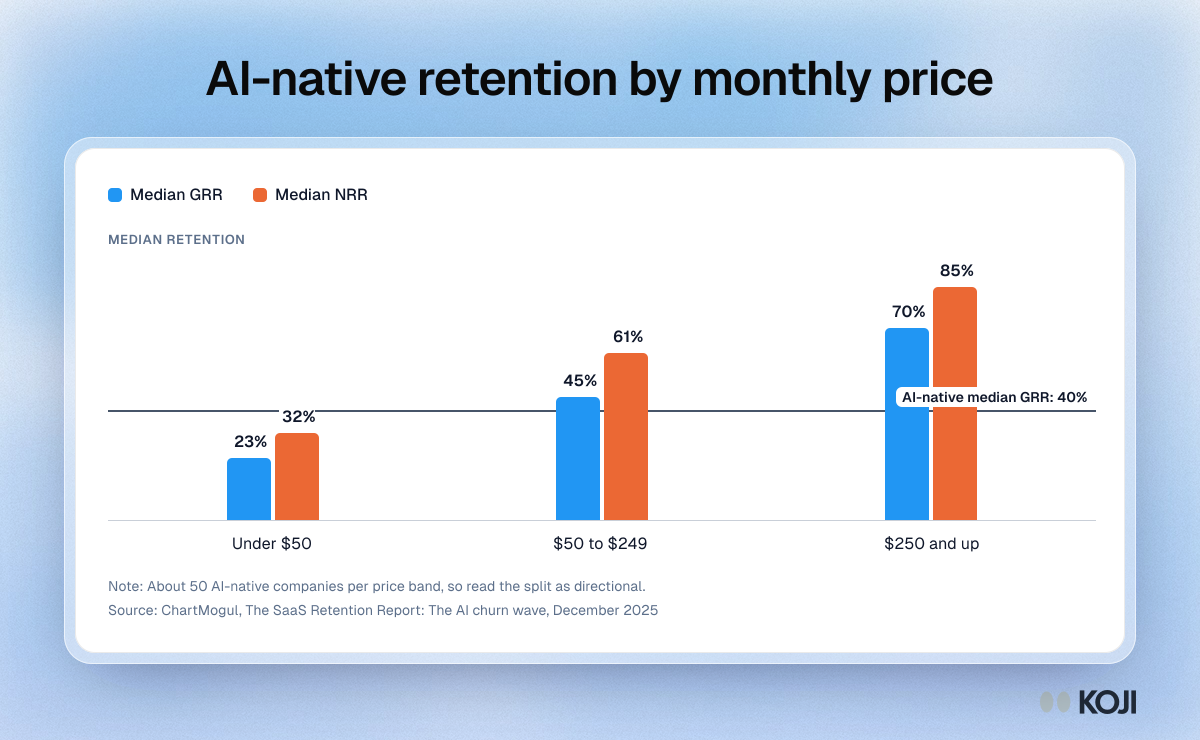
Column chart of AI-native median retention by monthly price: GRR of 23% under $50, 45% at $50 to $249 and 70% at $250 and up

Column chart

AI-native retention by monthly price
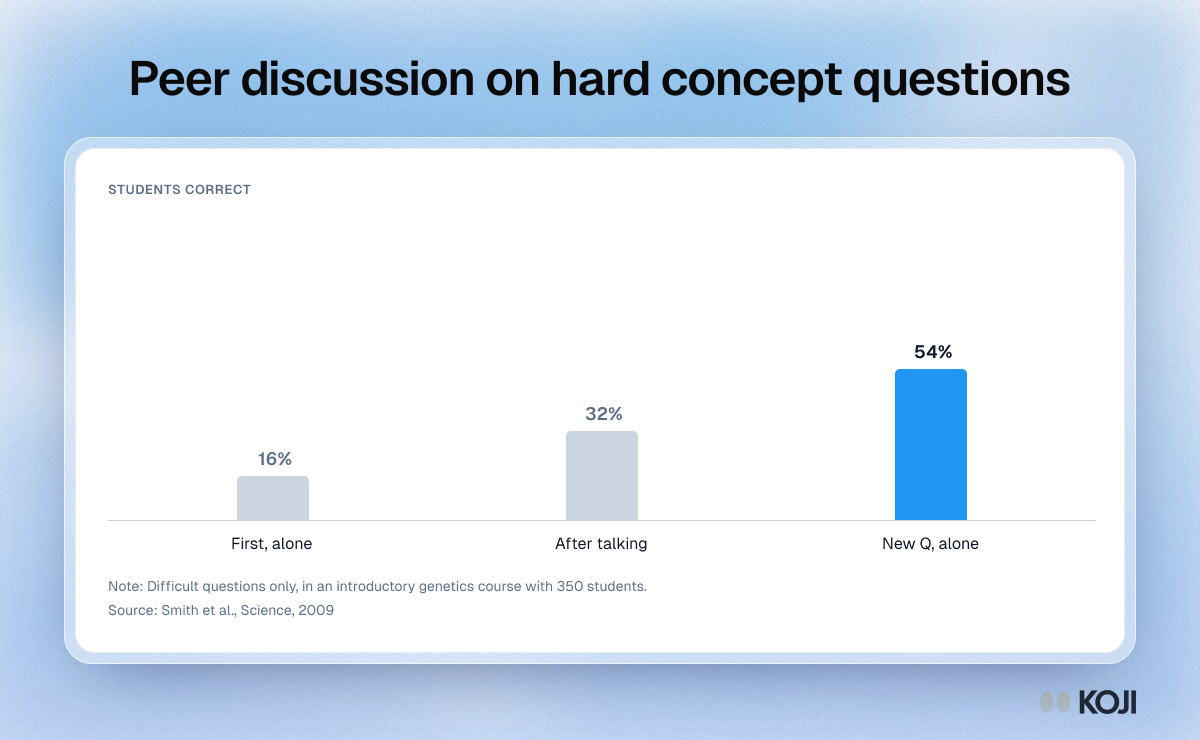
Column chart of difficult concept questions: 16% correct answering alone, 32% after peer discussion, and 54% on a new question answered alone.

Column chart

Peer discussion on hard concept questions
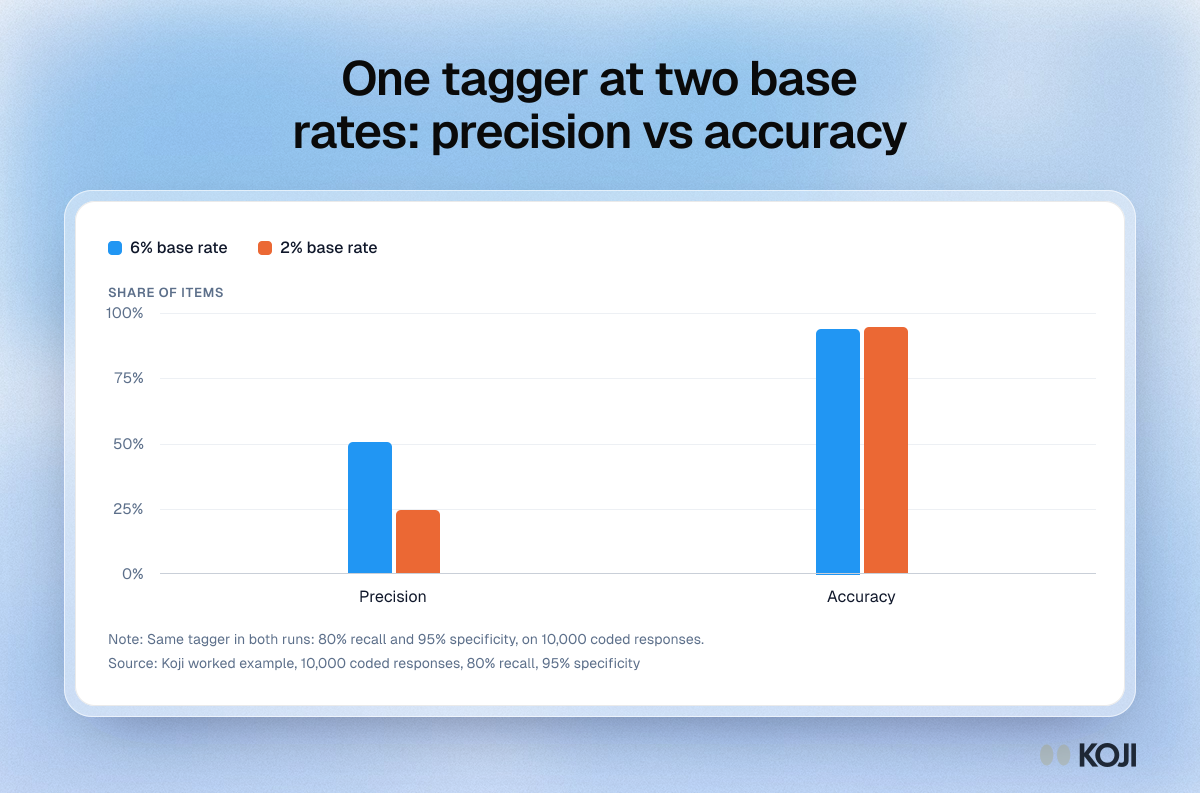
Column chart of one tagger at a 6% and a 2% base rate: precision falls from 50.5% to 24.6% while accuracy rises from 94.1% to 94.7%.

Column chart

One tagger at two base rates: precision vs accuracy
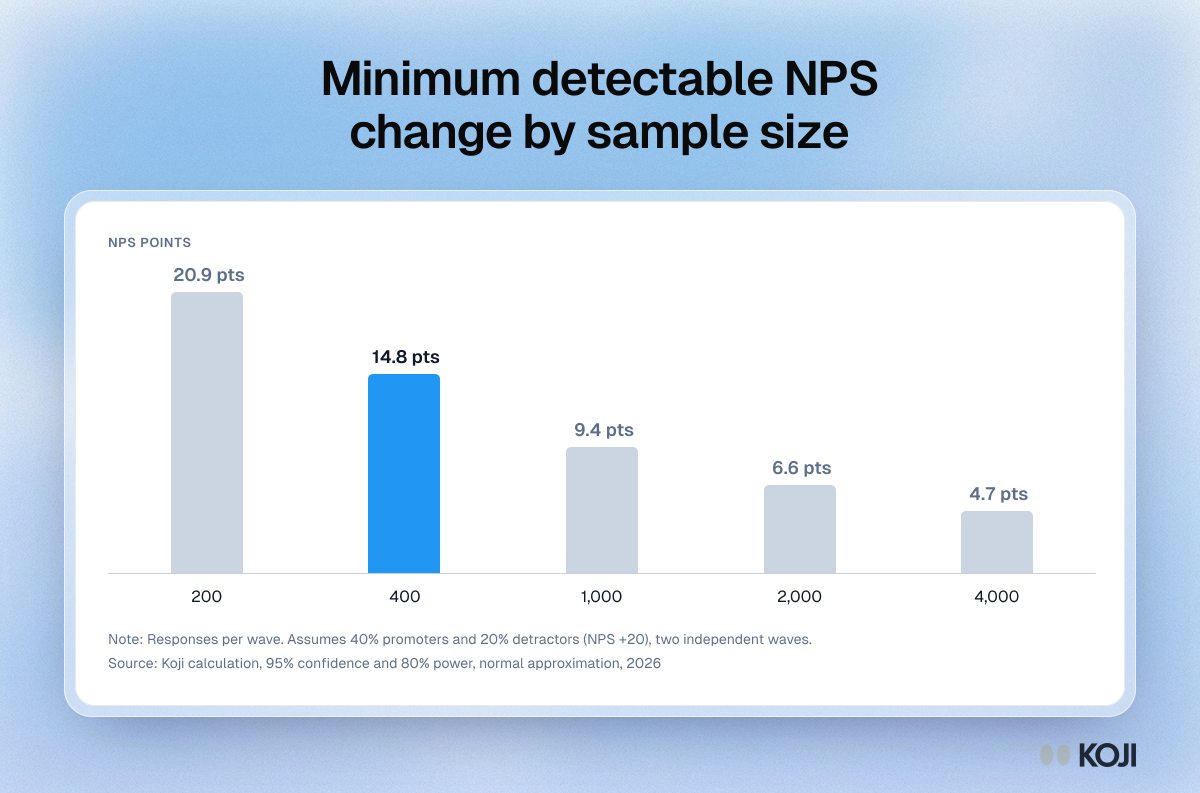
Column chart of the smallest NPS change two survey waves can detect: 20.9 points at 200 responses, 14.8 at 400, down to 4.7 at 4,000.

Column chart

Minimum detectable NPS change by sample size
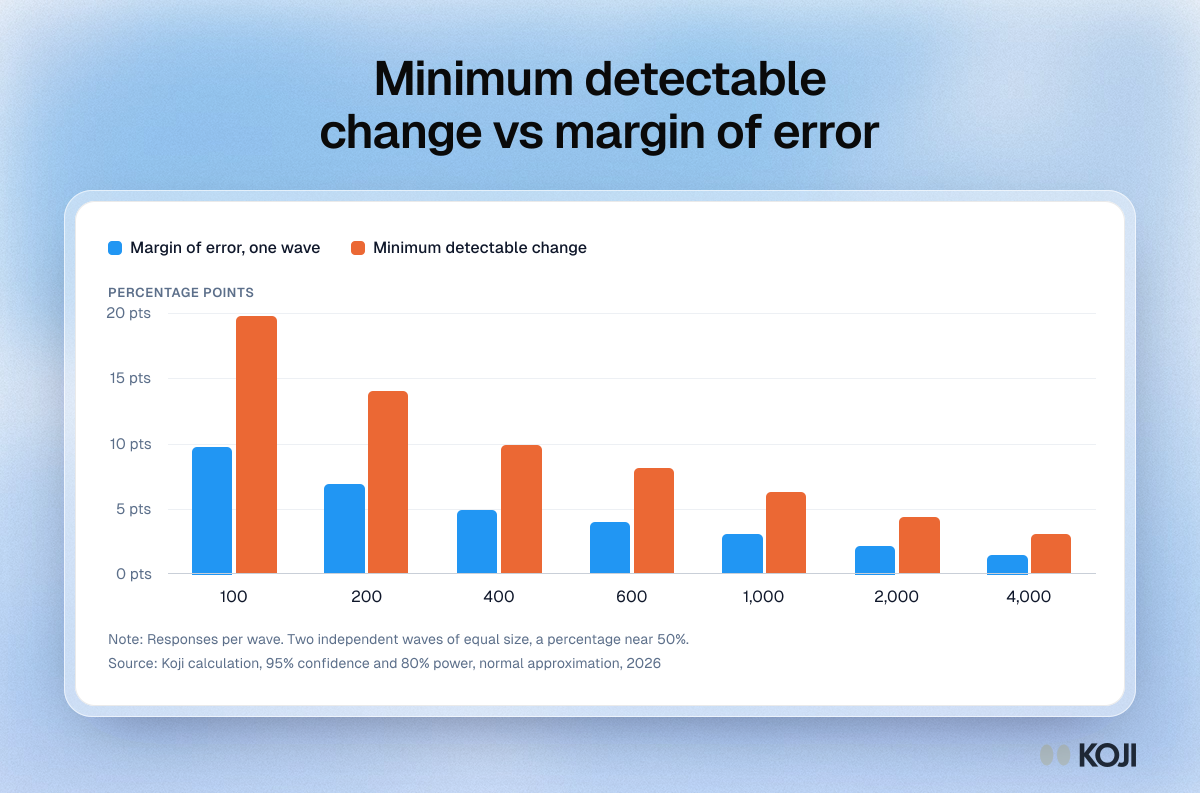
Column chart comparing margin of error with minimum detectable change by responses per wave: at 400 responses, 4.9 points against 9.9 points.

Column chart

Minimum detectable change vs margin of error
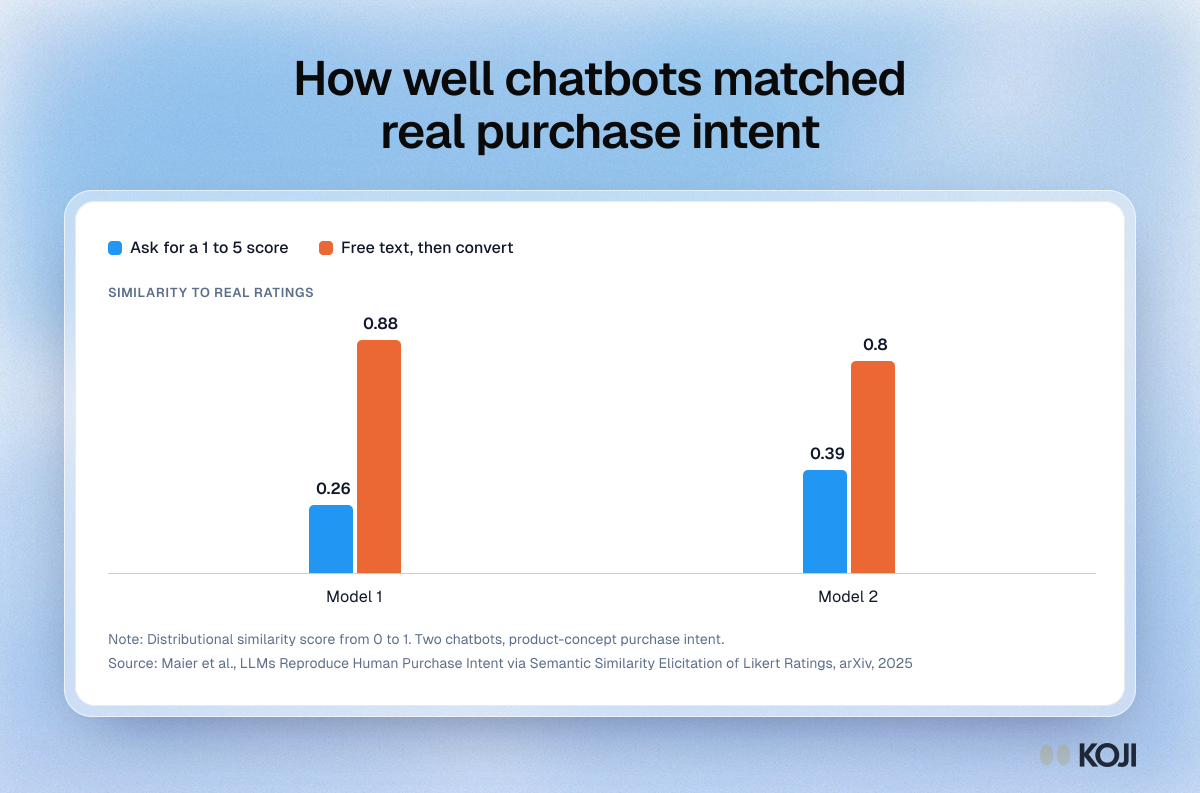
Column chart: two chatbots matched real purchase-intent ratings at 0.26 and 0.39 when asked for a score, and 0.88 and 0.80 when asked for words first.

Column chart

How well chatbots matched real purchase intent
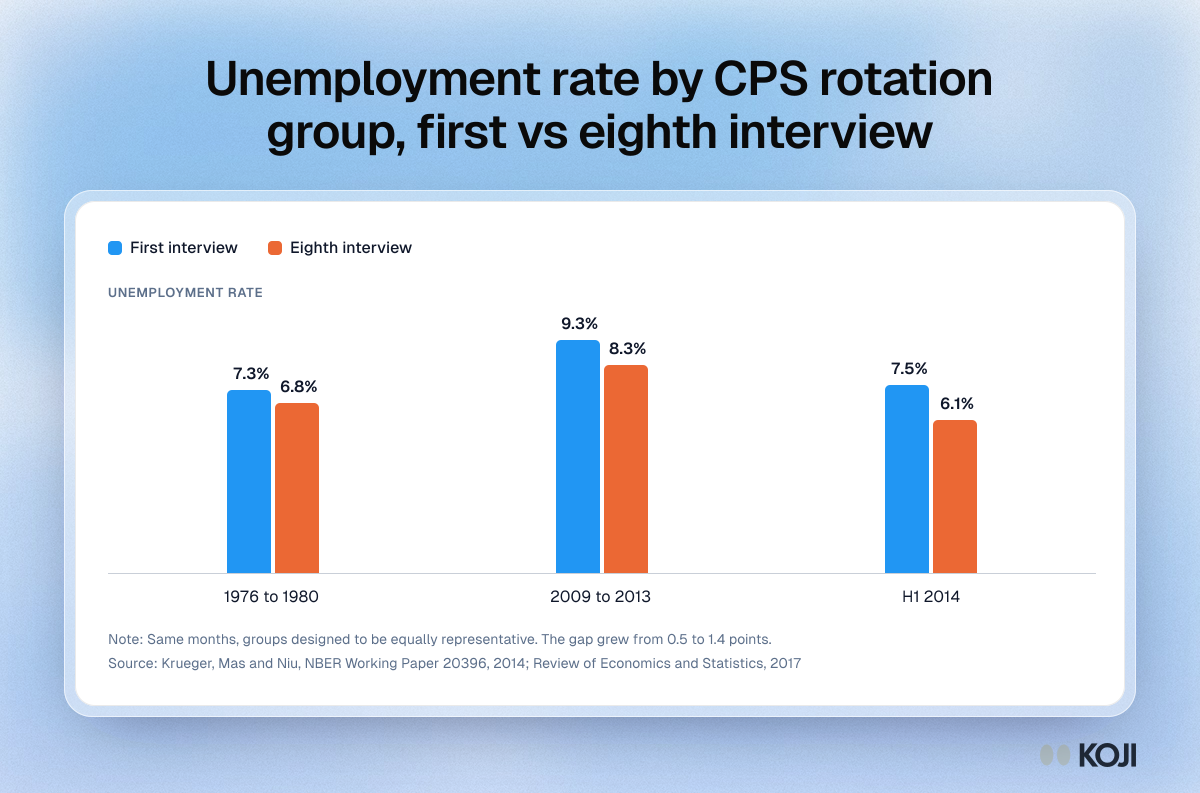
Column chart of the US unemployment rate reported by first-time and eighth-time CPS households: 7.3% vs 6.8%, 9.3% vs 8.3%, 7.5% vs 6.1%.

Column chart

Unemployment rate by CPS rotation group, first vs eighth interview
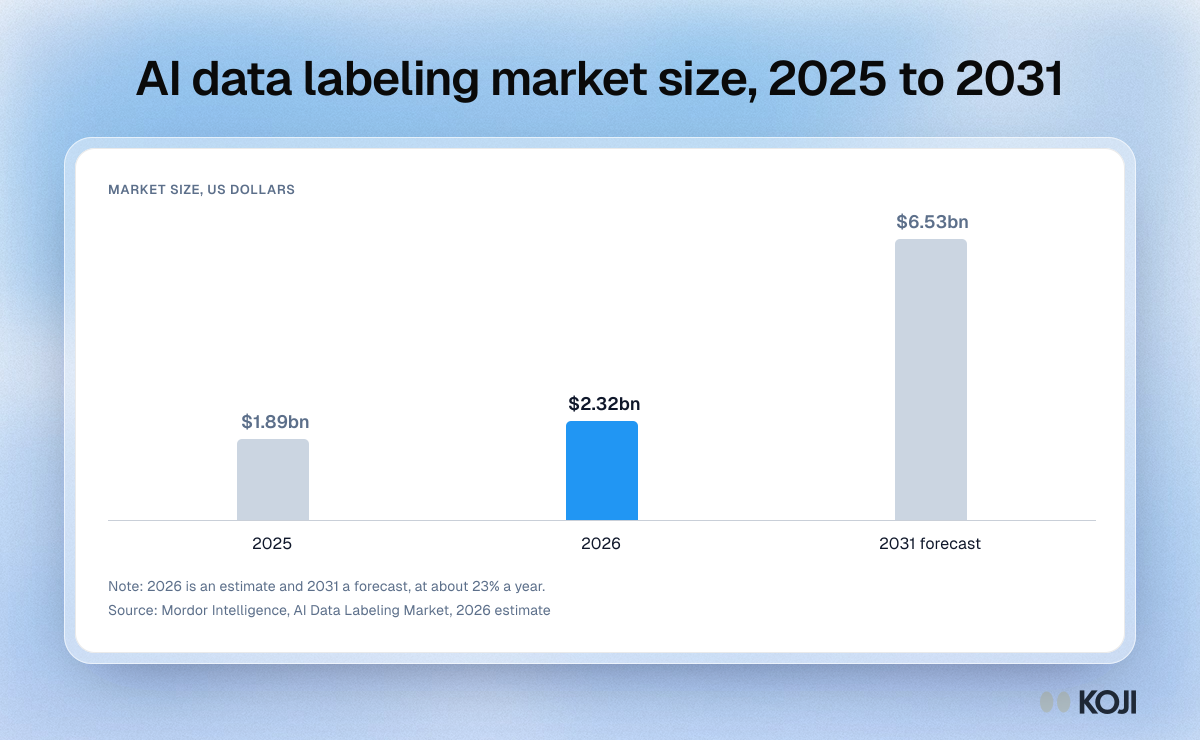
Column chart of the AI data labeling market: $1.89 billion in 2025, about $2.32 billion in 2026 and a forecast $6.53 billion by 2031.

Column chart

AI data labeling market size, 2025 to 2031
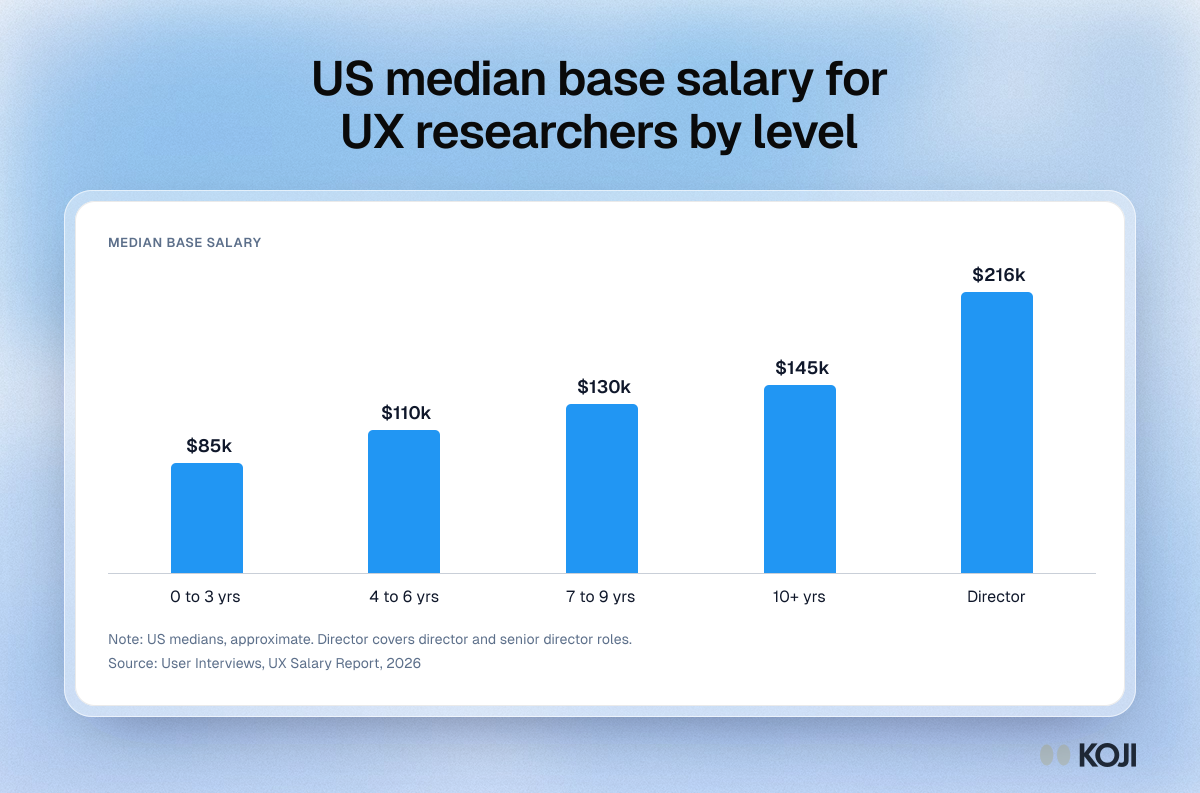
Column chart of 2026 US median base salary for UX researchers: about $85k entry level, $110k mid, $130k senior, $145k at 10+ years and $216k for directors.

Column chart

US median base salary for UX researchers by level
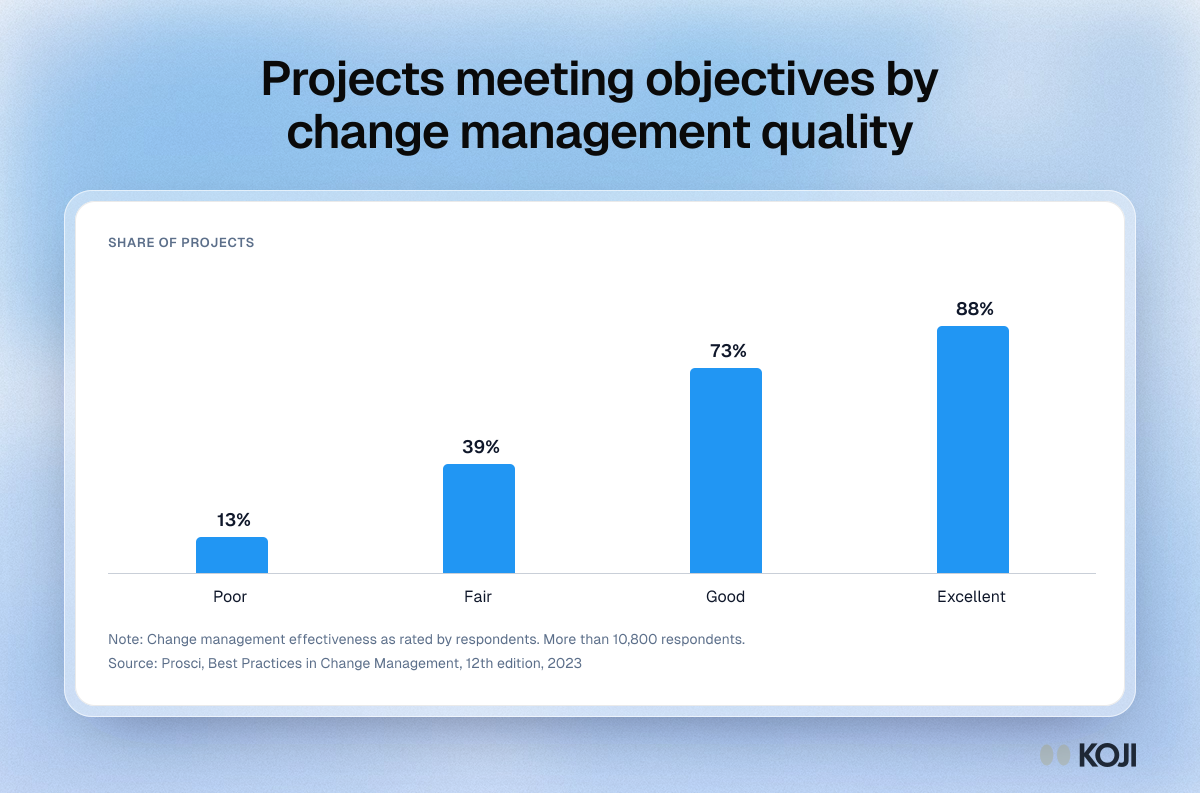
Column chart of the share of projects meeting or exceeding objectives by change management effectiveness: poor 13%, fair 39%, good 73%, excellent 88%.

Column chart

Projects meeting objectives by change management quality
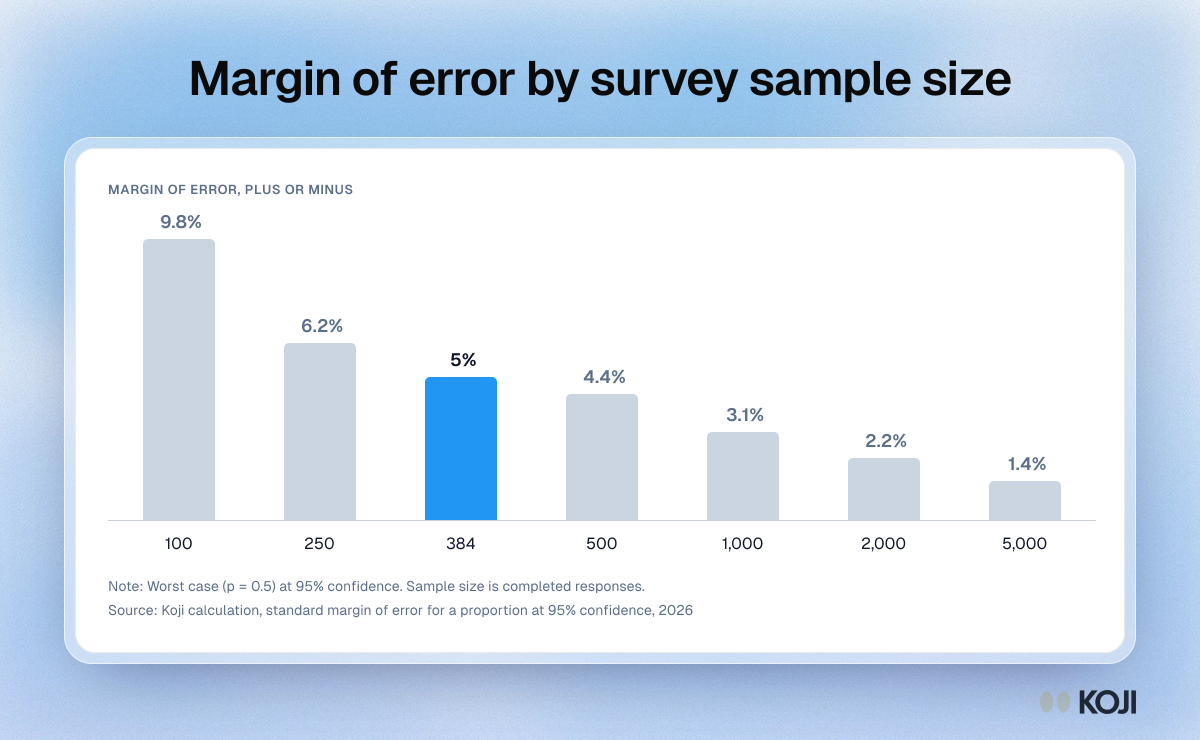
Column chart of survey margin of error by sample size at 95% confidence: 9.8% at 100 responses, 5% at 384, 3.1% at 1,000 and 1.4% at 5,000.

Column chart

Margin of error by survey sample size
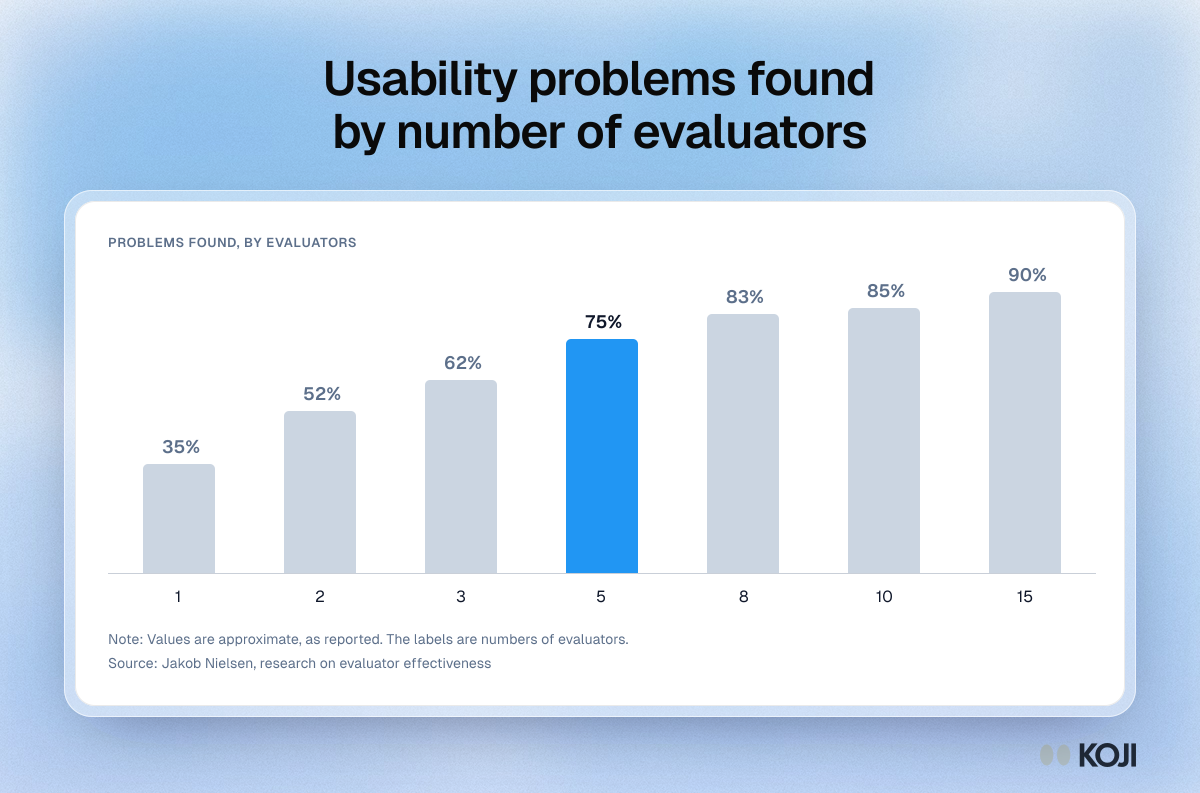
Column chart of usability problems found by number of evaluators: about 35% with 1, 62% with 3, 75% with 5, 85% with 10 and 90% with 15.

Column chart

Usability problems found by number of evaluators
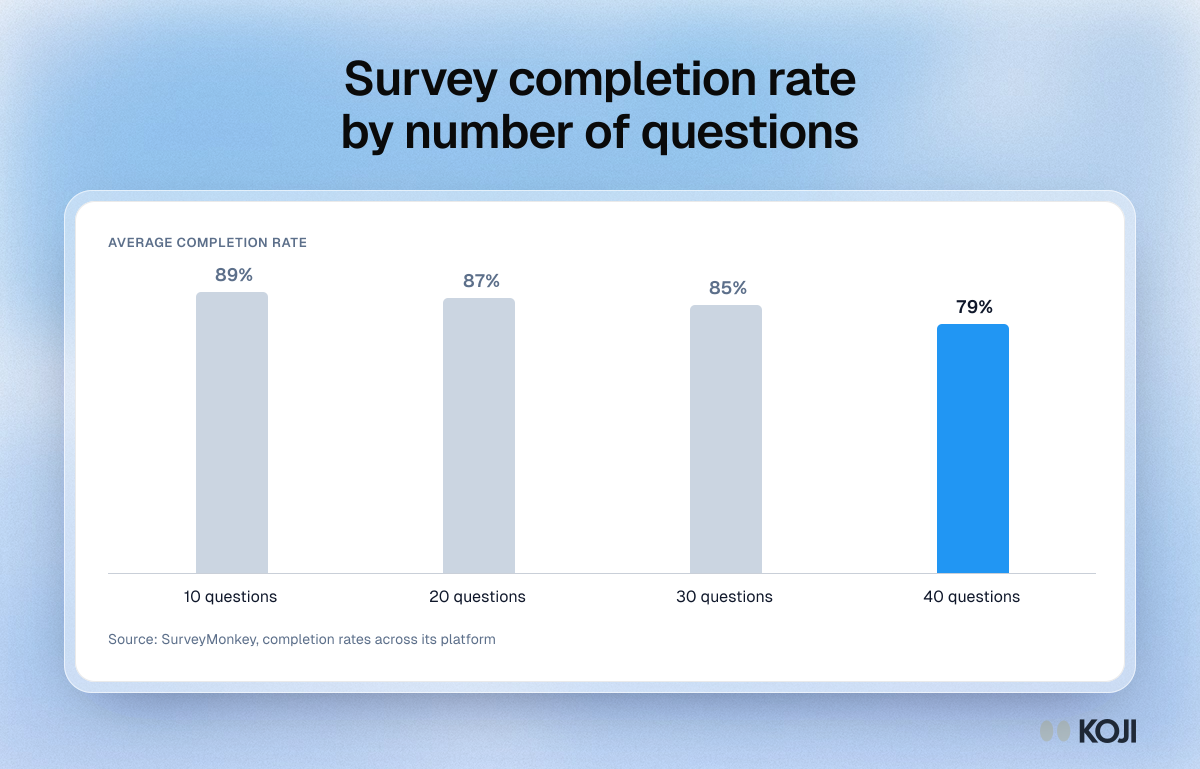
Column chart of average survey completion rate by length: 89% at 10 questions, 87% at 20, 85% at 30 and 79% at 40 questions.

Column chart

Survey completion rate by number of questions
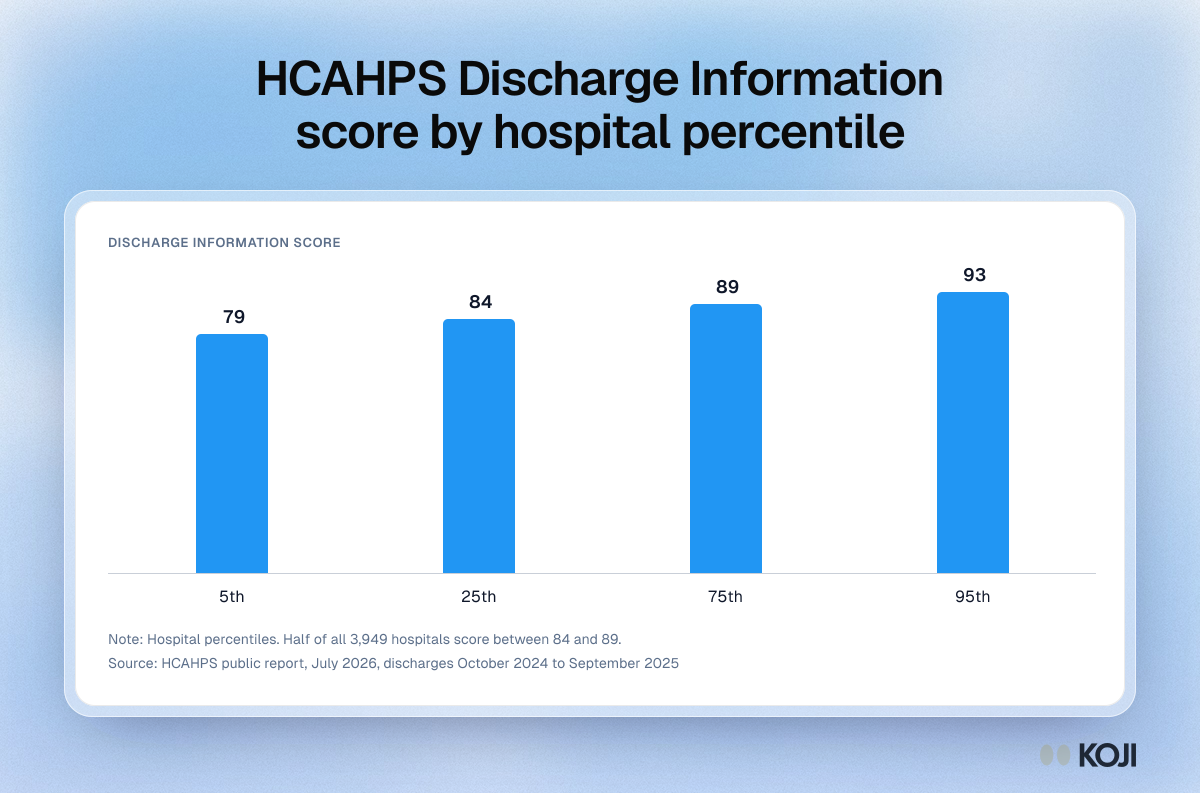
Column chart of HCAHPS Discharge Information scores by hospital percentile: 79 at the 5th, 84 at the 25th, 89 at the 75th and 93 at the 95th.

Column chart

HCAHPS Discharge Information score by hospital percentile
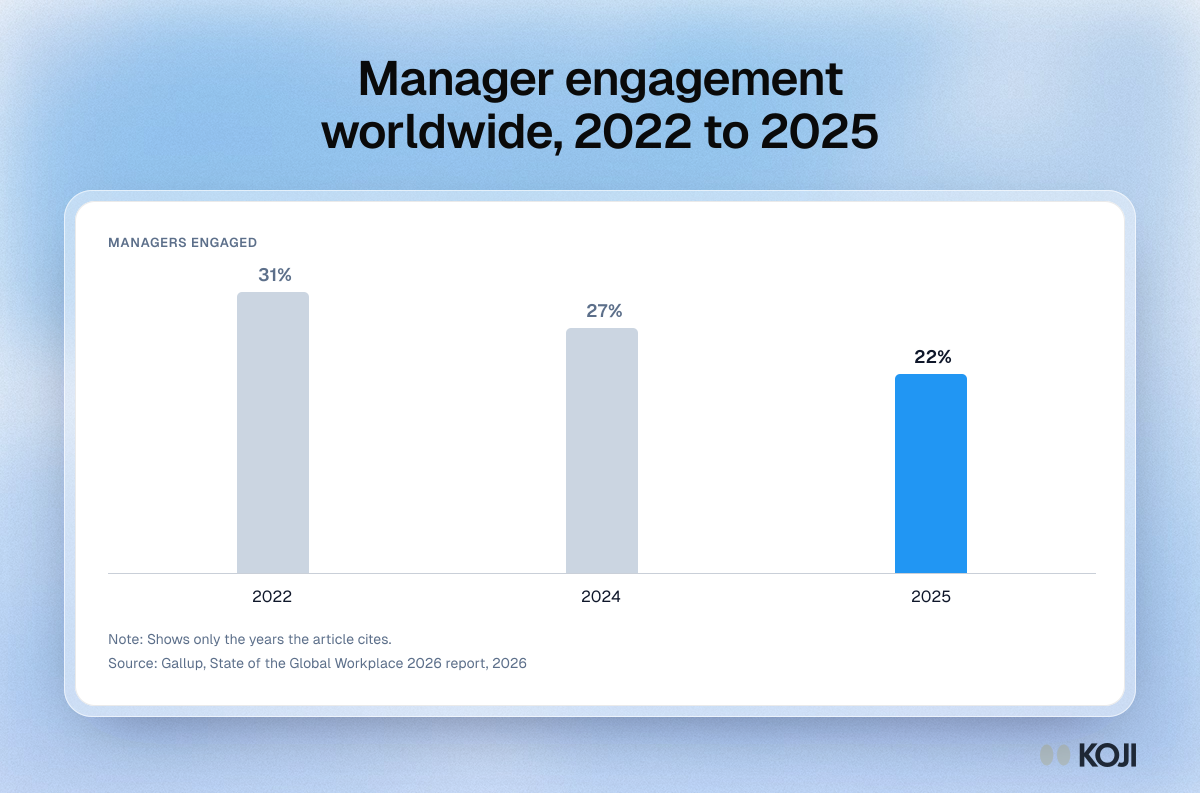
Column chart of the share of managers engaged at work worldwide: 31% in 2022, 27% in 2024 and 22% in 2025

Column chart

Manager engagement worldwide, 2022 to 2025
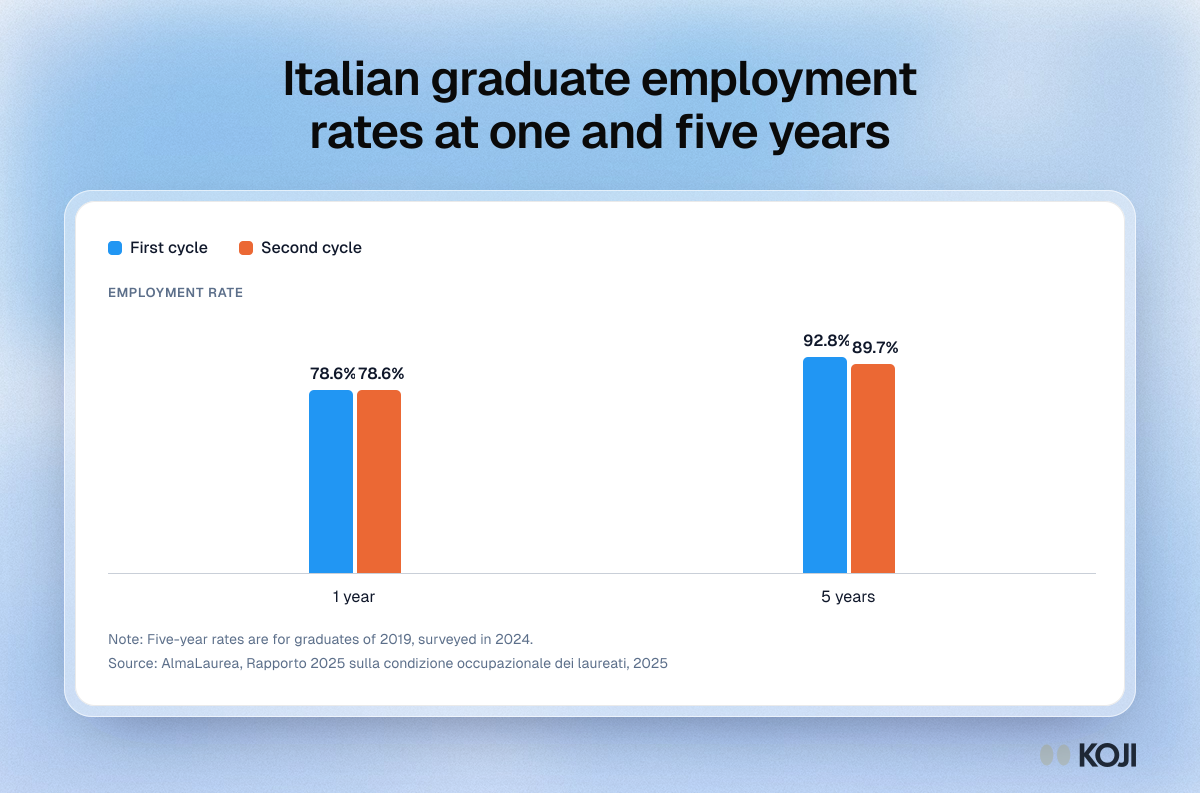
Column chart of AlmaLaurea 2025 employment rates: 78.6% at one year for both cycles, 92.8% and 89.7% at five years.

Column chart

Italian graduate employment rates at one and five years
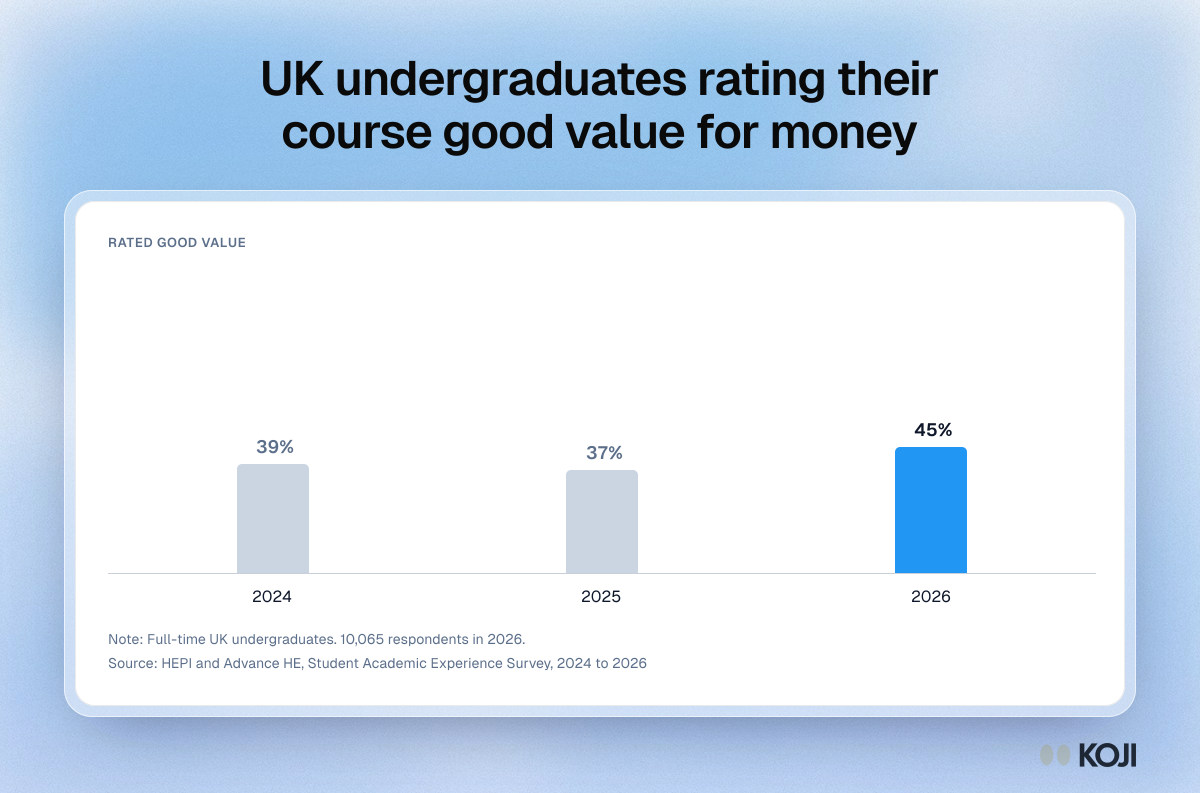
Column chart of the share of UK full-time undergraduates rating their course good or very good value for money: 39% in 2024, 37% in 2025 and 45% in 2026.

Column chart

UK undergraduates rating their course good value for money
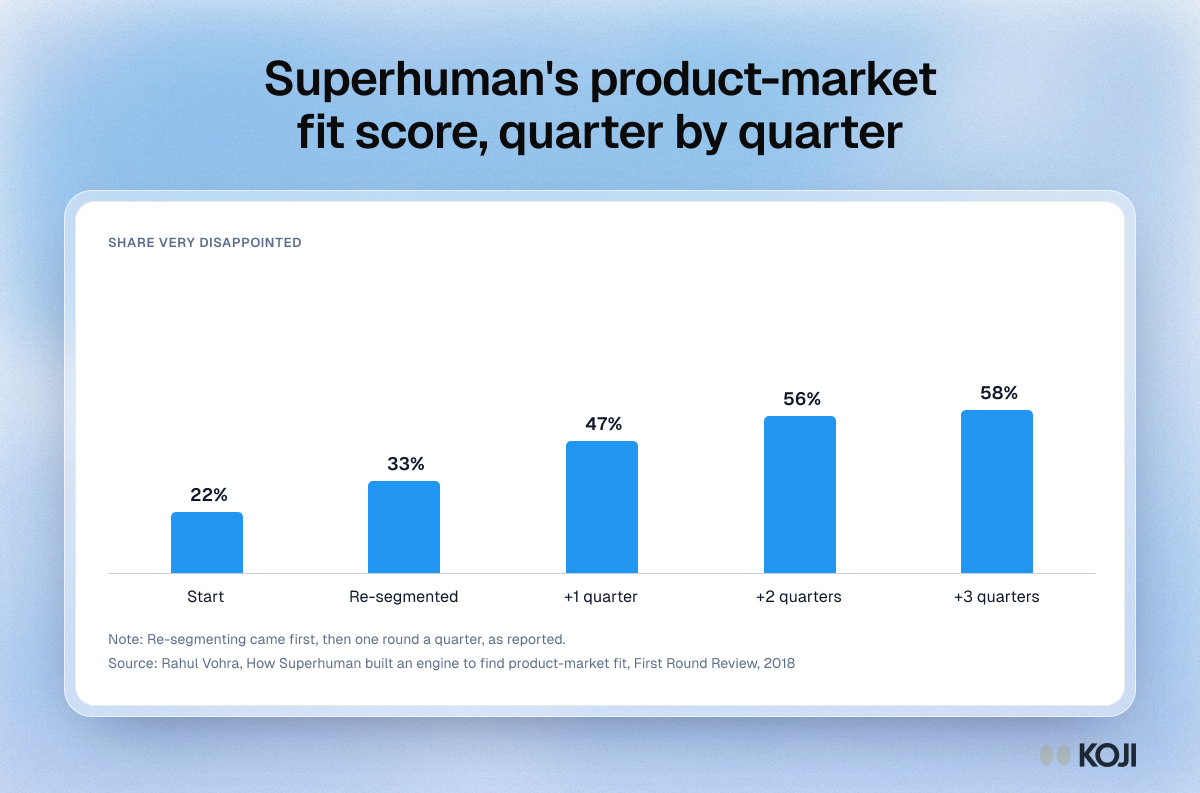
Column chart of Superhuman's very disappointed score rising from 22% to 33% after re-segmenting, then 47%, 56% and 58%.

Column chart

Superhuman's product-market fit score, quarter by quarter
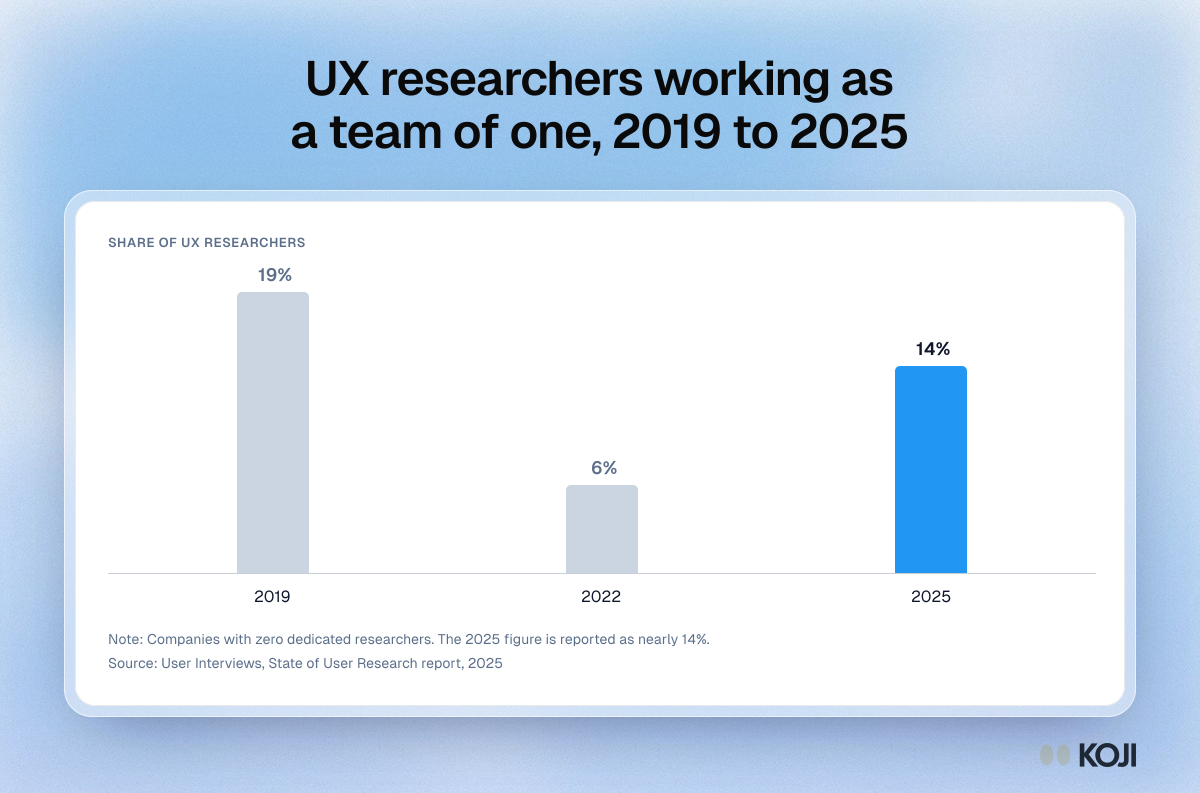
Column chart: the share of UX researchers at companies with zero dedicated researchers was 19% in 2019, 6% in 2022 and nearly 14% in 2025.

Column chart

UX researchers working as a team of one, 2019 to 2025
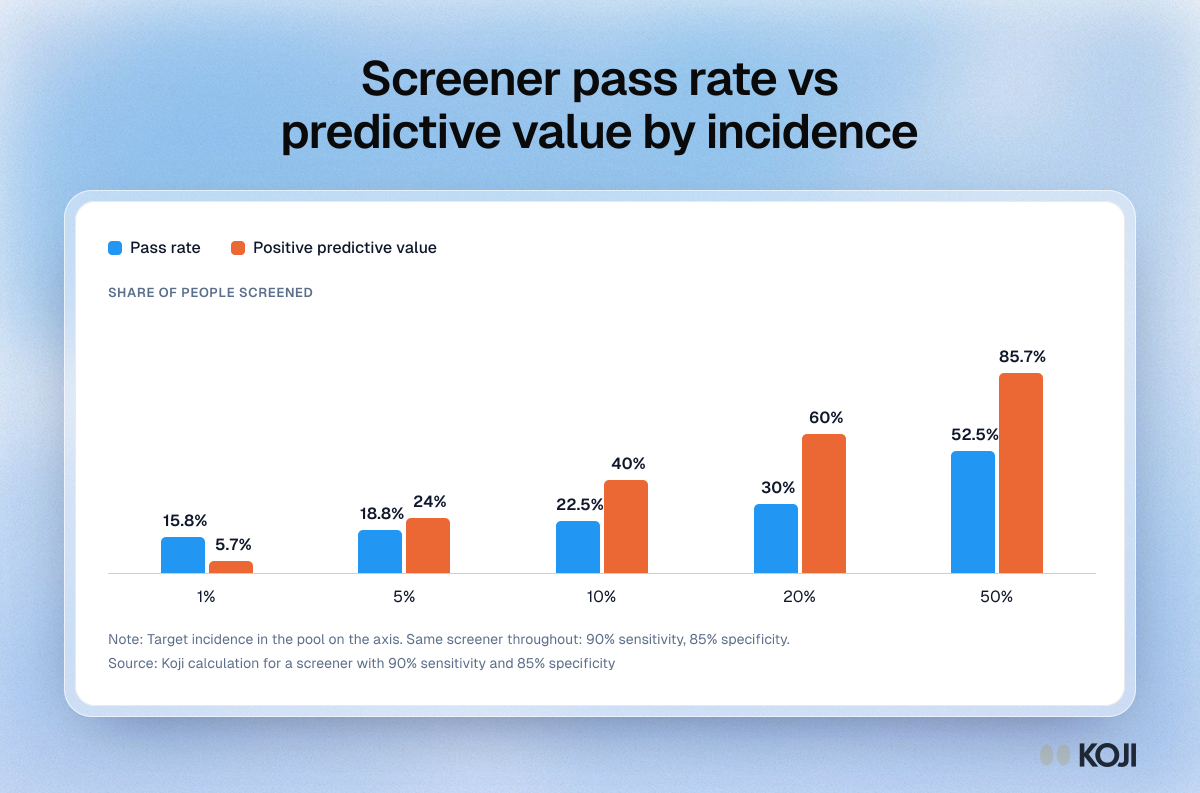
Column chart of a screener at 90% sensitivity and 85% specificity: as target incidence rises from 1% to 50%, predictive value climbs from 5.7% to 85.7%

Column chart

Screener pass rate vs predictive value by incidence
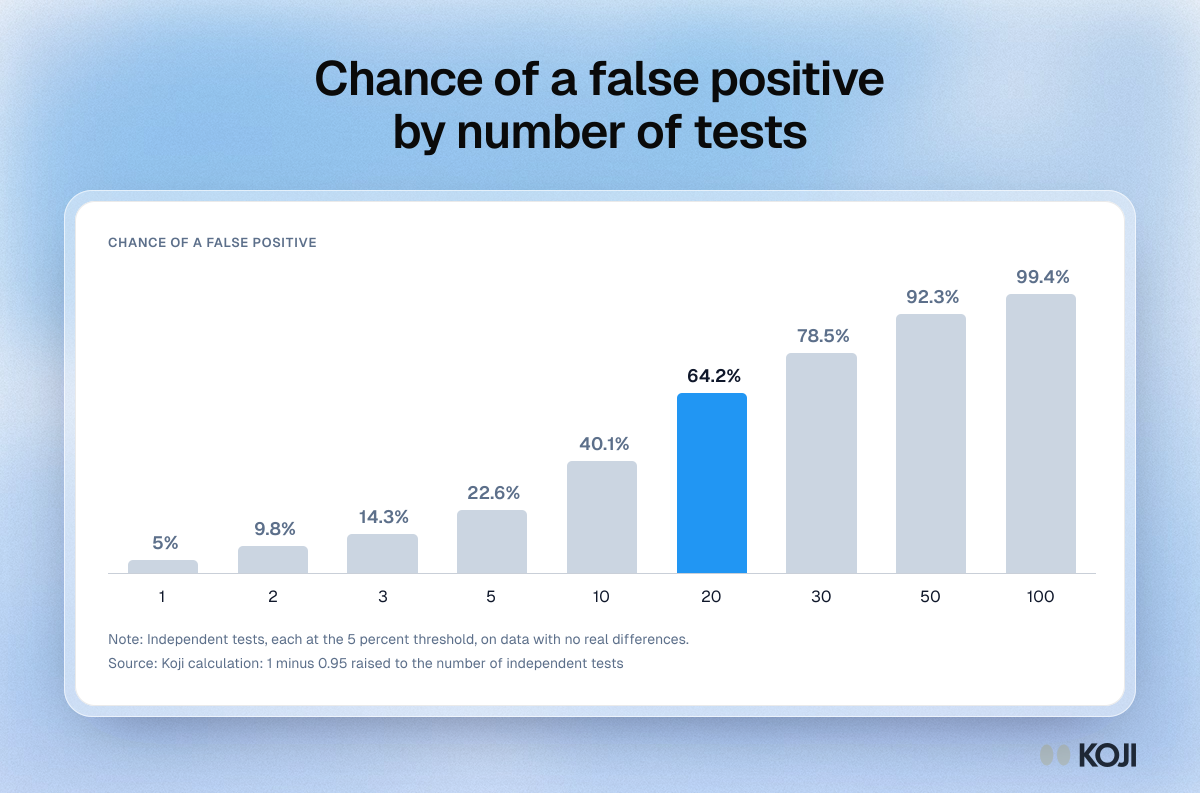
Column chart of the chance of at least one false positive at the 5 percent threshold: 5% for one test, 64.2% for 20 tests and 99.4% for 100 tests

Column chart

Chance of a false positive by number of tests
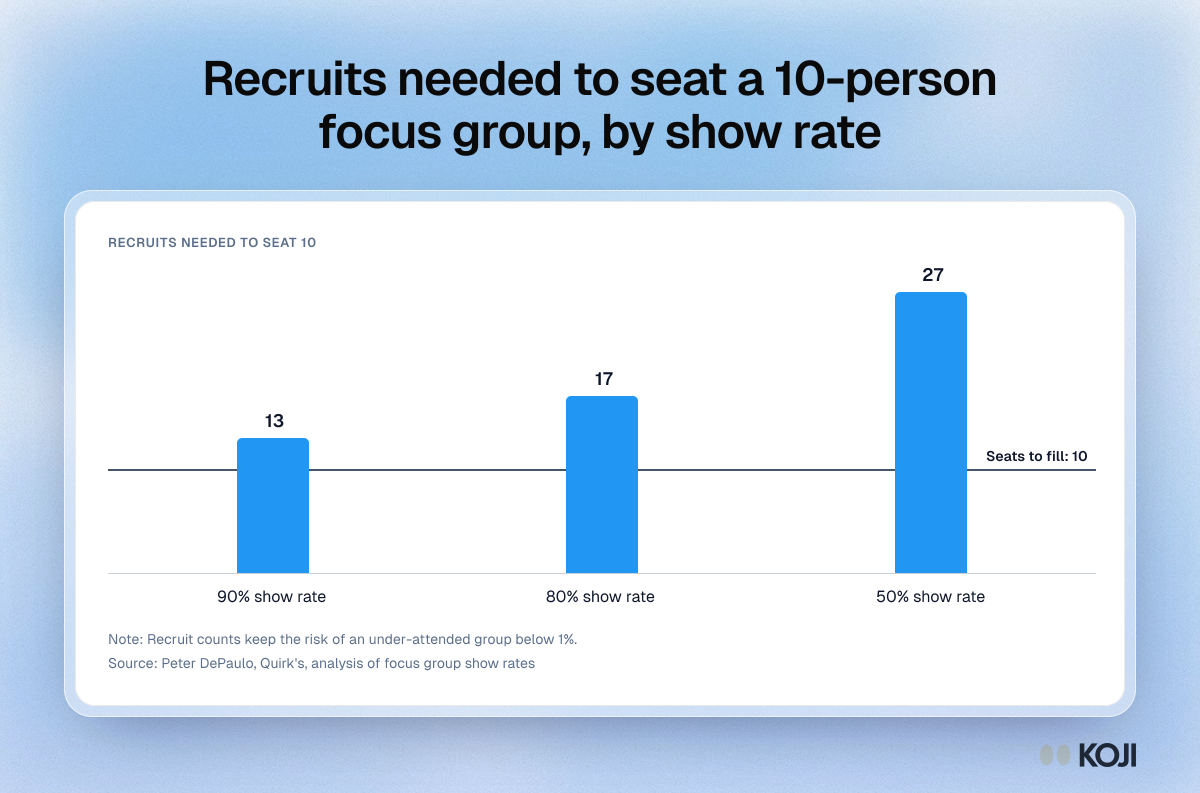
Column chart of recruits needed to seat a 10-person focus group: 13 at a 90% show rate, 17 at 80% and 27 at 50%.

Column chart

Recruits needed to seat a 10-person focus group, by show rate
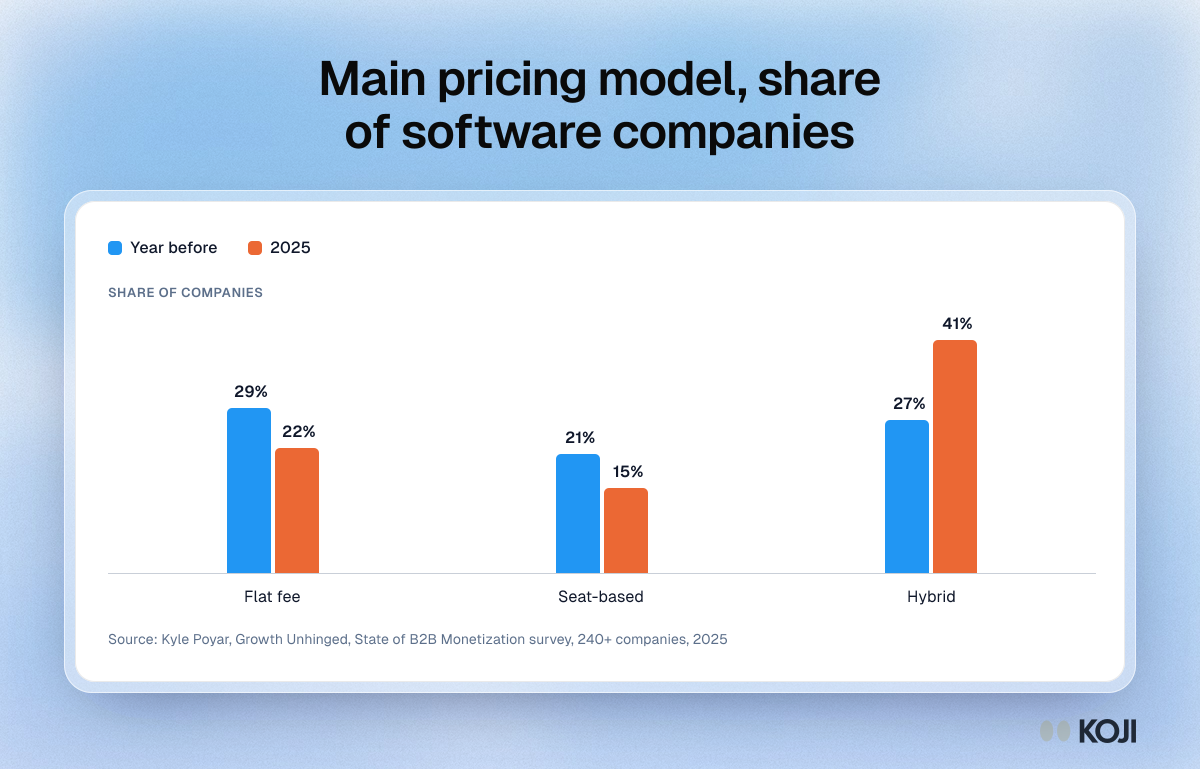
Column chart of the main pricing model at software companies: flat fee fell from 29% to 22%, seat-based from 21% to 15%, hybrid rose from 27% to 41%.

Column chart

Main pricing model, share of software companies
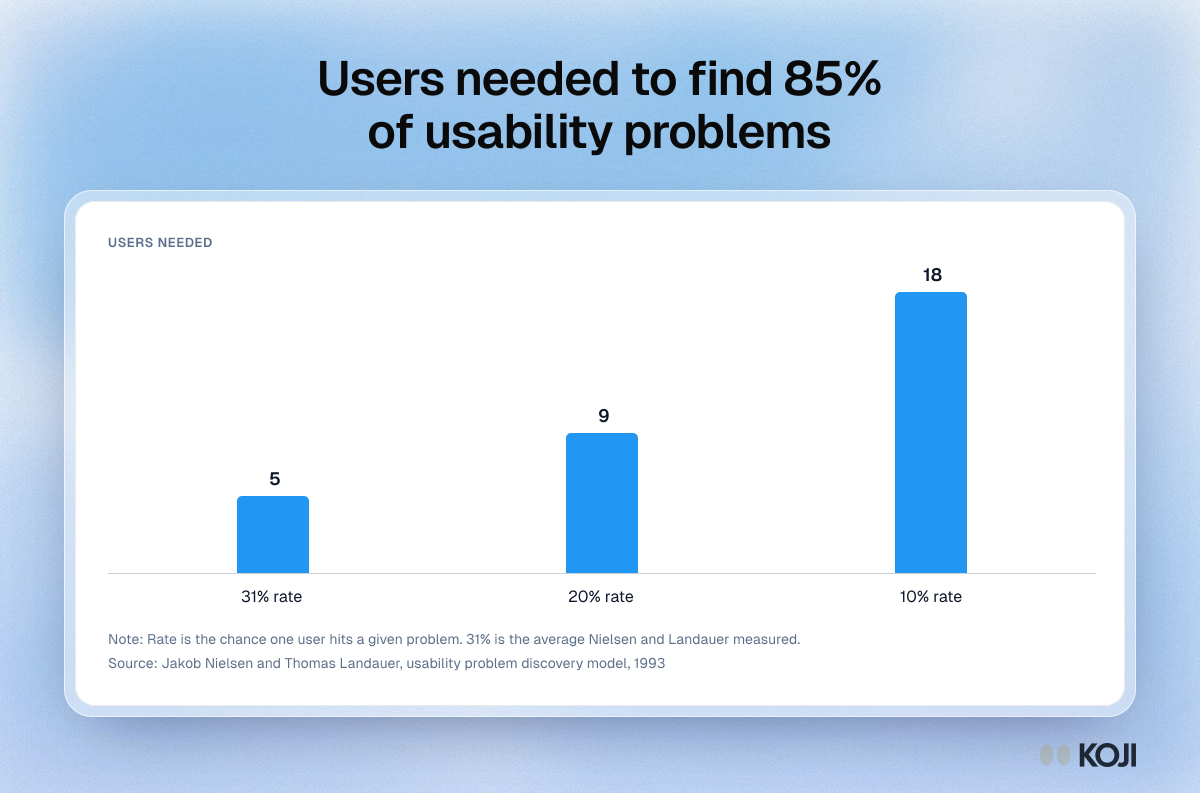
Column chart of the users needed to find 85% of usability problems: 5 users at a 31% discovery rate, 9 at 20% and 18 at 10%.

Column chart

Users needed to find 85% of usability problems
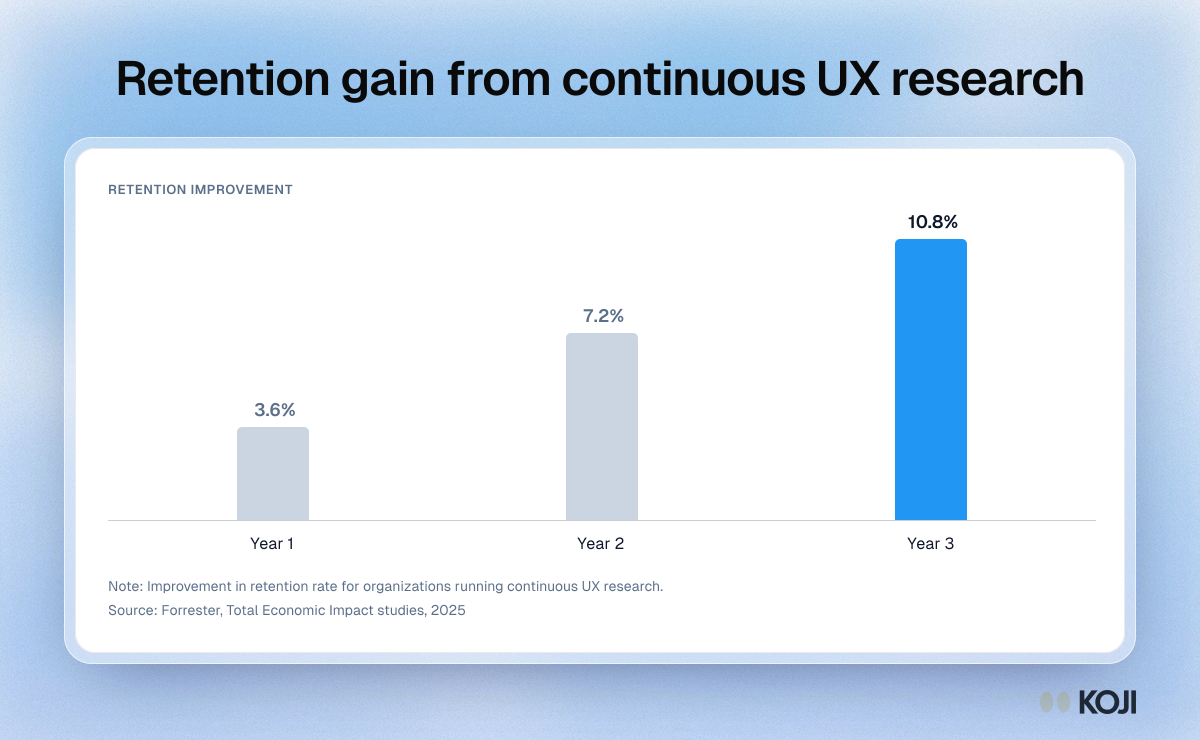
Column chart of retention improvement from continuous UX research: 3.6% in year one, 7.2% in year two and 10.8% in year three.

Column chart

Retention gain from continuous UX research