Free to save and share

Frameworks and cheat sheets for customer research

Every framework, checklist and comparison from our guides, as an image you can download, drop into a deck or share with your team.
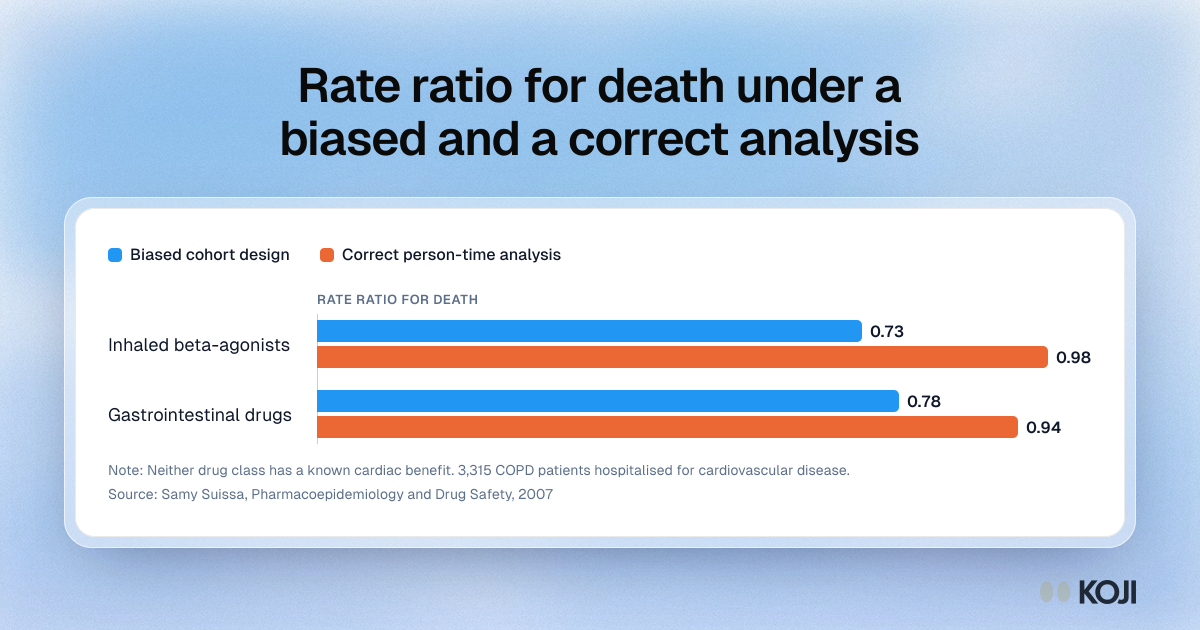
Bar chart of rate ratios for death: 0.73 and 0.78 under a biased cohort design, 0.98 and 0.94 once person-time is allocated correctly.

Bar chart

Rate ratio for death under a biased and a correct analysis
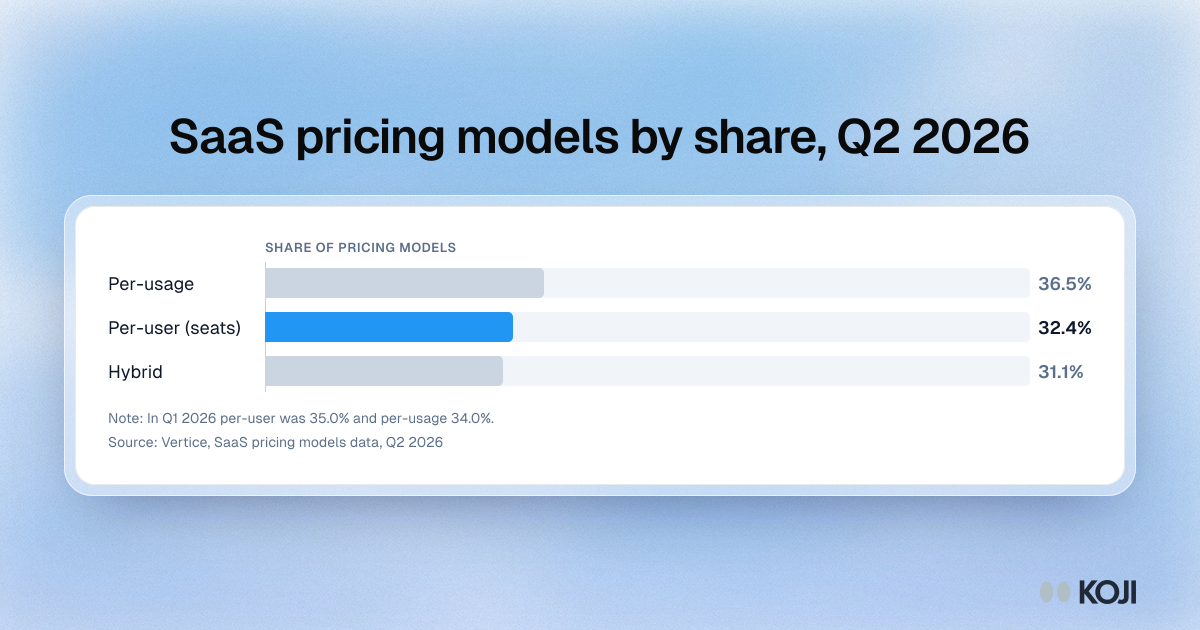
Bar chart of SaaS pricing models by share in Q2 2026: per-usage 36.5%, per-user 32.4%, hybrid 31.1%.

Bar chart

SaaS pricing models by share, Q2 2026
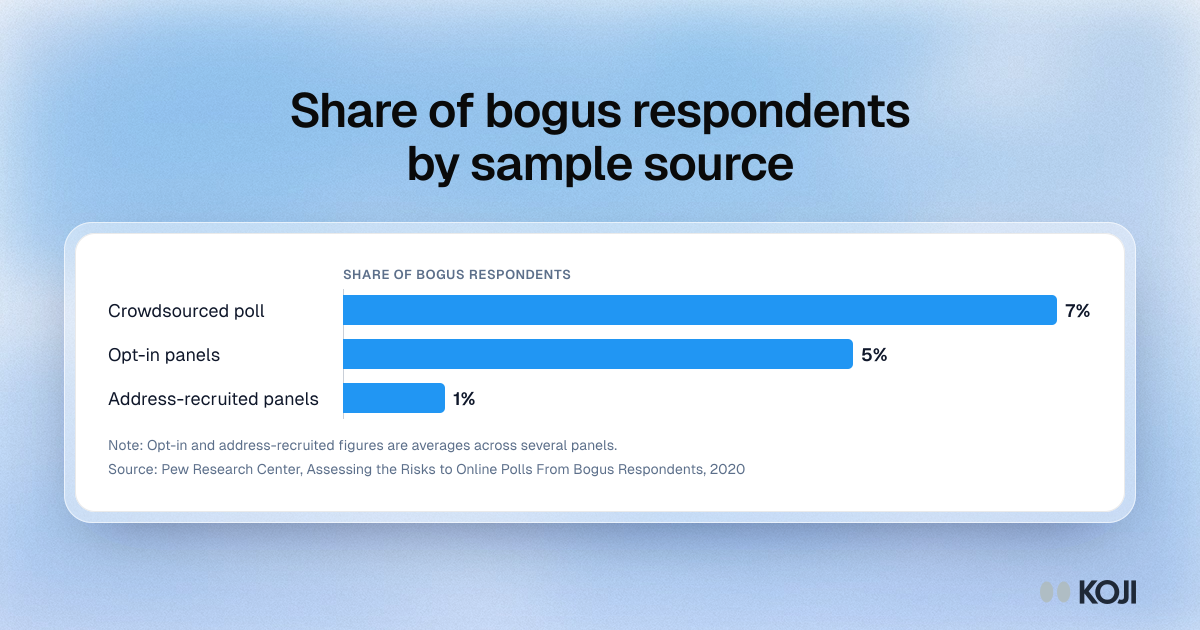
Bar chart of bogus respondents by sample source in Pew's 2020 study: 7% in a crowdsourced poll, 5% in opt-in panels, 1% in address-recruited panels.

Bar chart

Share of bogus respondents by sample source
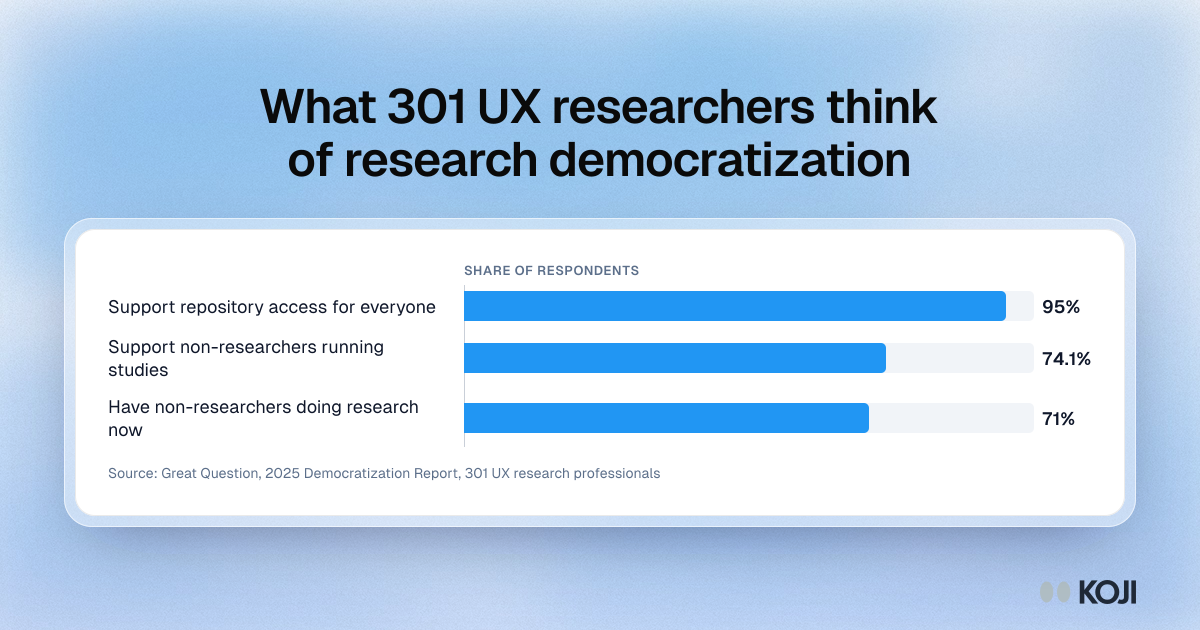
Bar chart from a 2025 survey of 301 UX researchers: 95.0% back repository access for all, 74.1% back non-researchers running studies, 71% already do it.

Bar chart

What 301 UX researchers think of research democratization
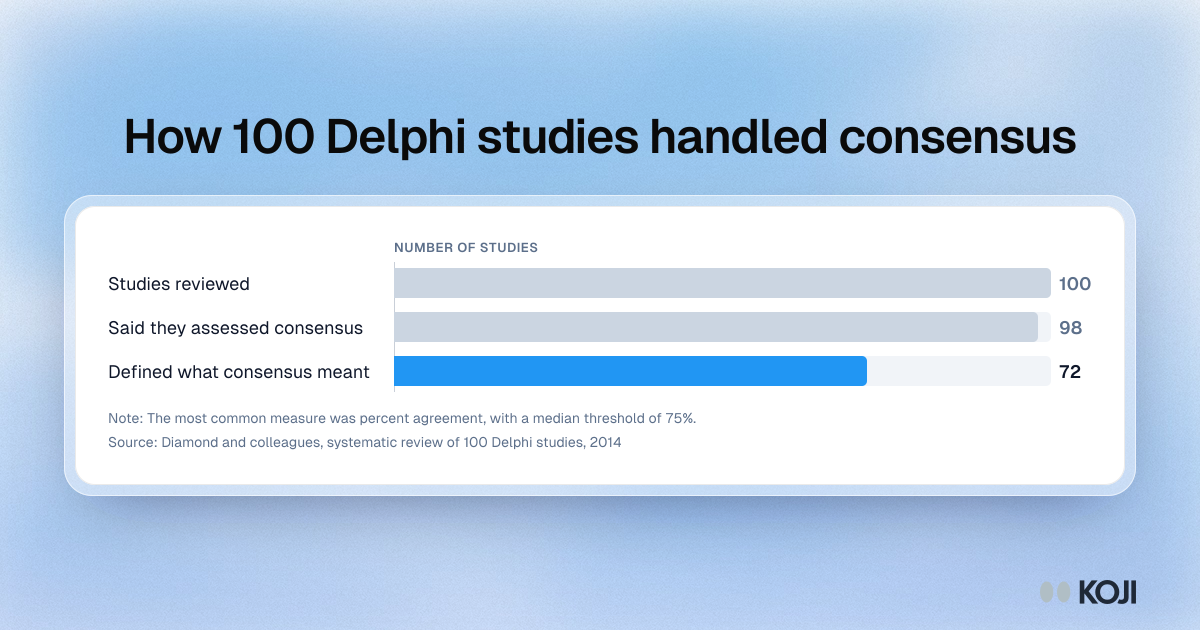
Bar chart of a review of 100 Delphi studies: 98 said they assessed consensus, but only 72 defined what consensus meant.

Bar chart

How 100 Delphi studies handled consensus
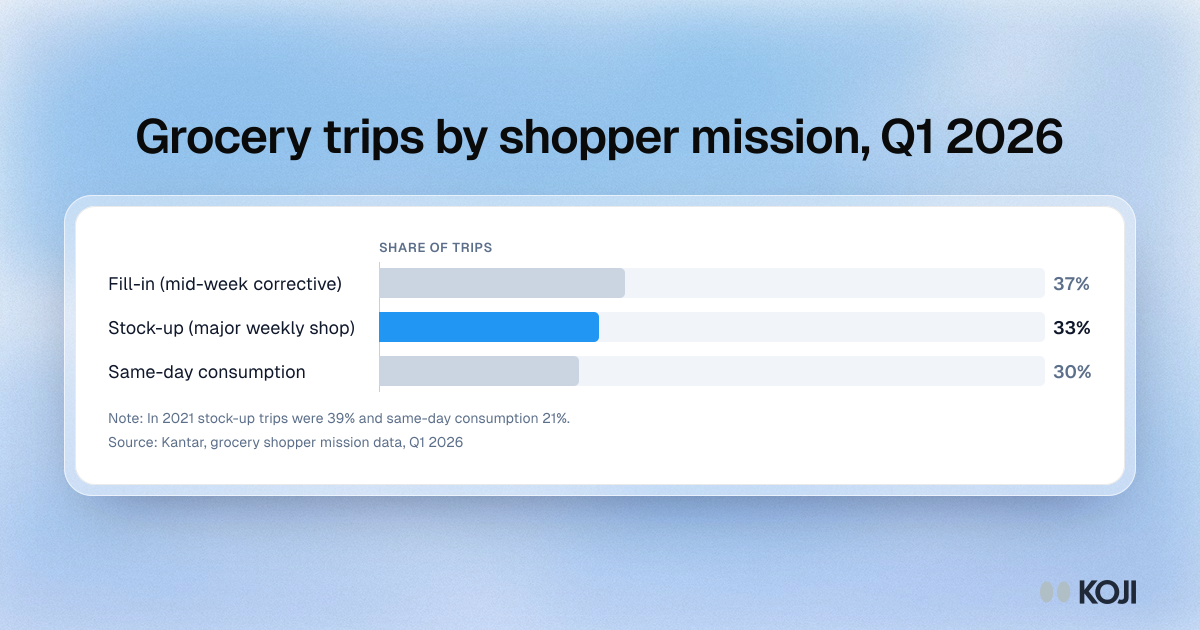
Bar chart of grocery trips by shopper mission in Q1 2026: fill-in 37%, stock-up 33% and same-day consumption 30%, per Kantar data.

Bar chart

Grocery trips by shopper mission, Q1 2026
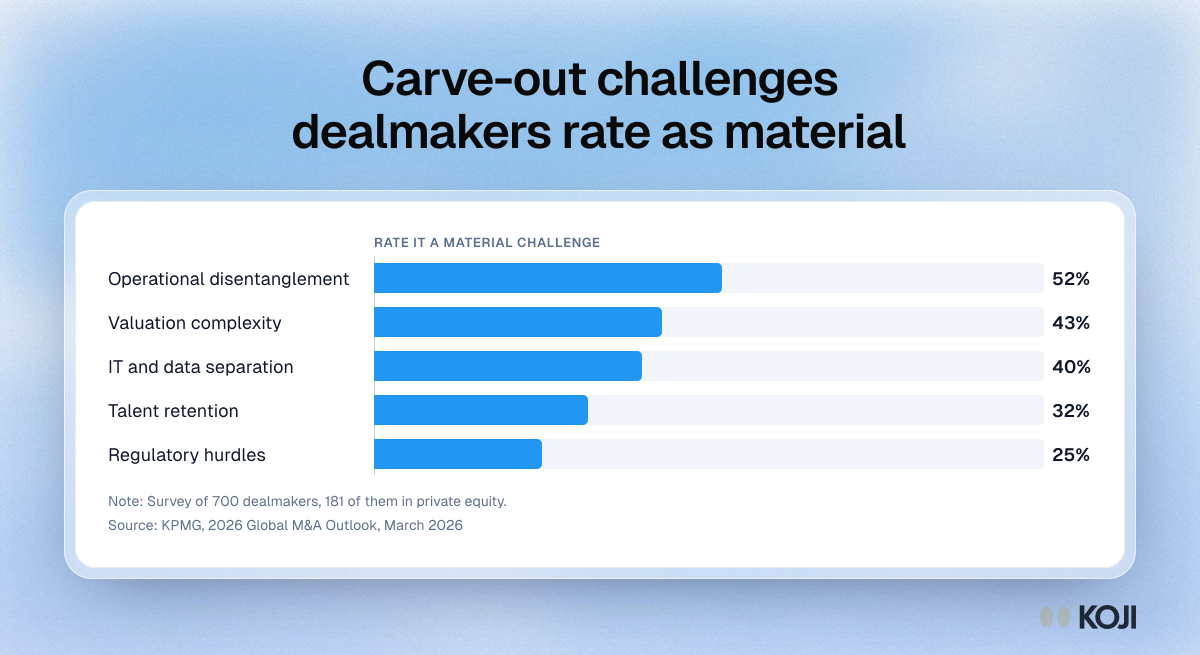
Bar chart of carve-out challenges dealmakers rate as material, led by operational disentanglement at 52%, with no customer item on the list

Bar chart

Carve-out challenges dealmakers rate as material
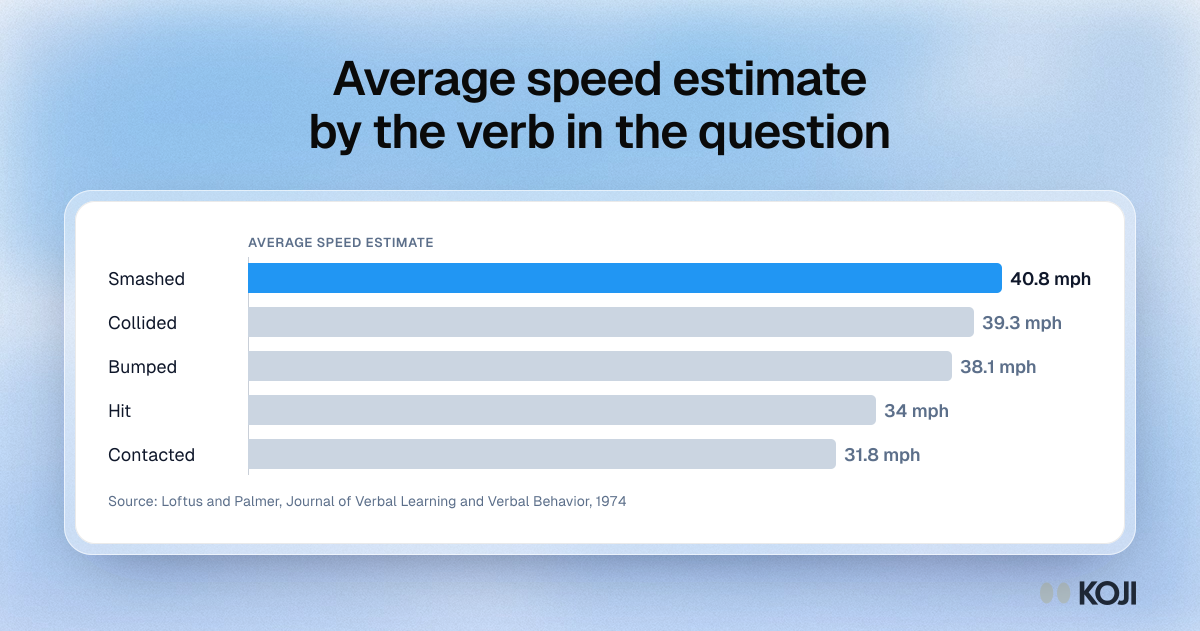
Bar chart of average speed estimates by verb in Loftus and Palmer's 1974 experiment, from 40.8 mph for smashed to 31.8 mph for contacted.

Bar chart

Average speed estimate by the verb in the question
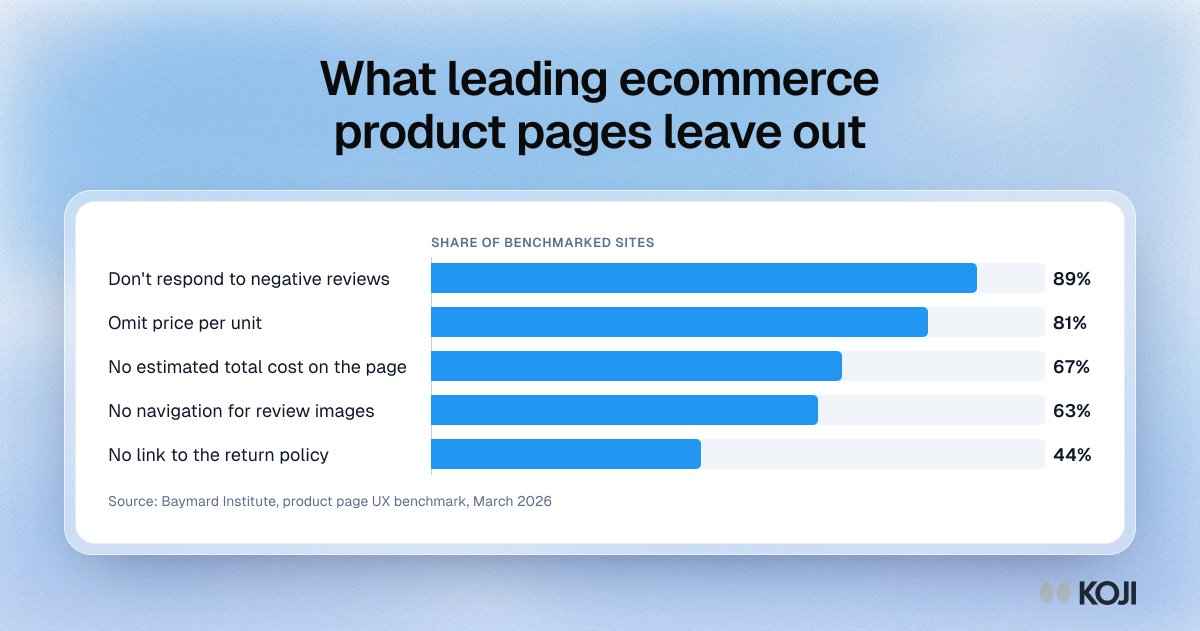
Bar chart of five gaps on leading ecommerce product pages, led by 89% of sites that ignore negative reviews and 81% that omit price per unit.

Bar chart

What leading ecommerce product pages leave out
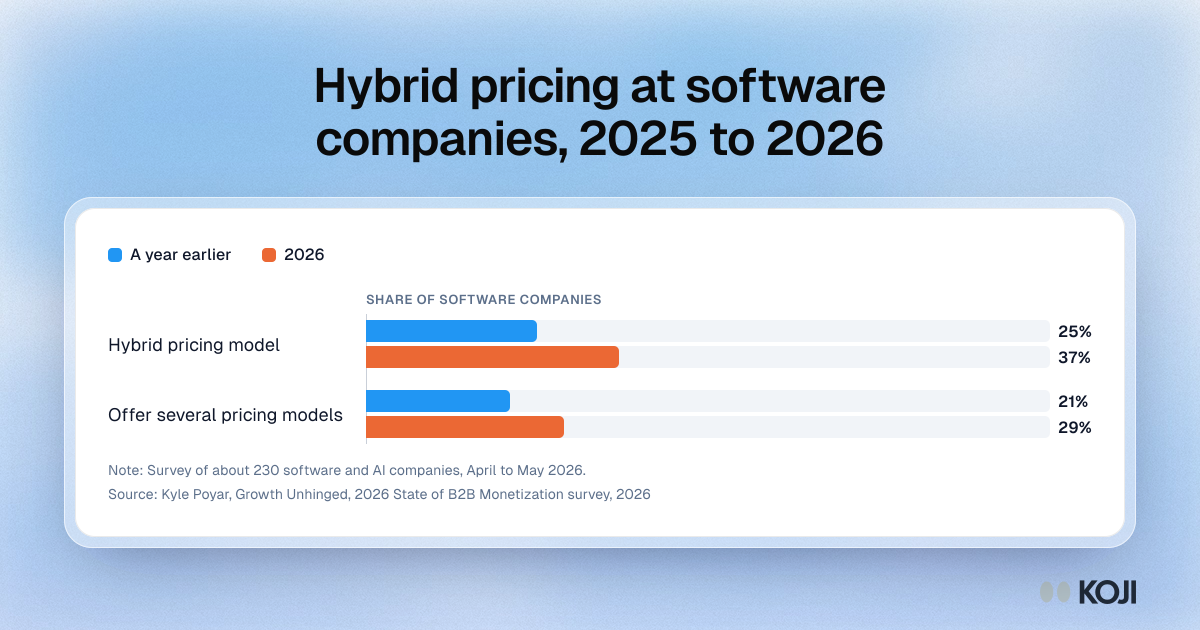
Bar chart comparing software companies a year earlier and in 2026: hybrid pricing rose from 25% to 37%, and offering several pricing models from 21% to 29%.

Bar chart

Hybrid pricing at software companies, 2025 to 2026
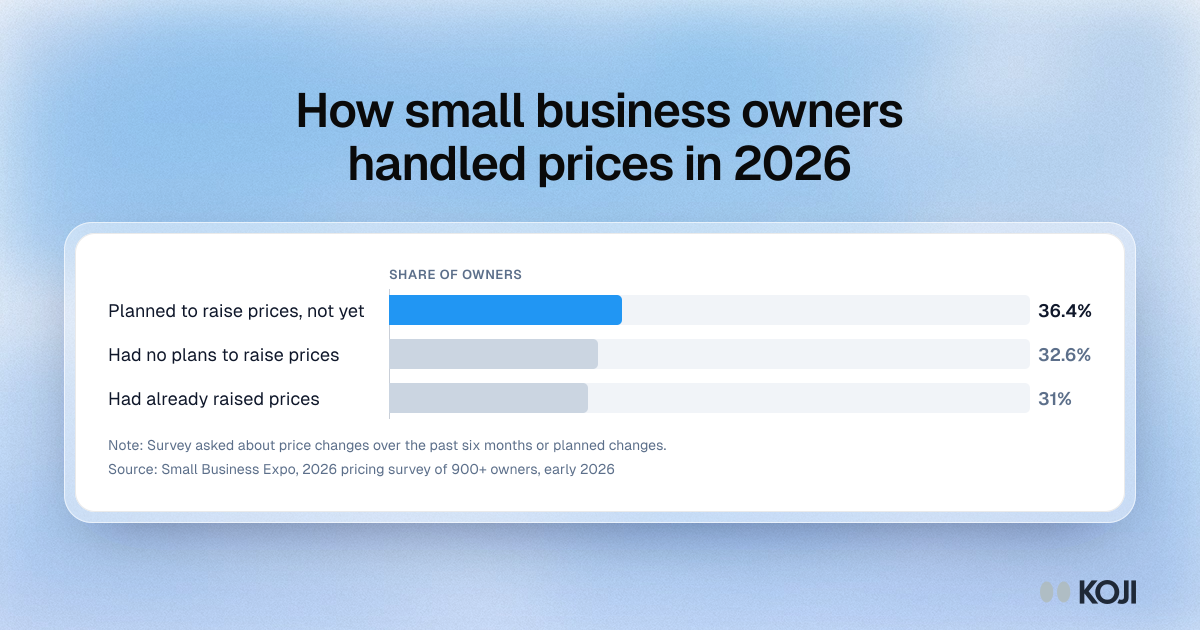
Bar chart of how more than 900 small business owners handled price rises in early 2026: 36.4% planned to raise, 32.6% had no plans and 31.0% had already raised.

Bar chart

How small business owners handled prices in 2026
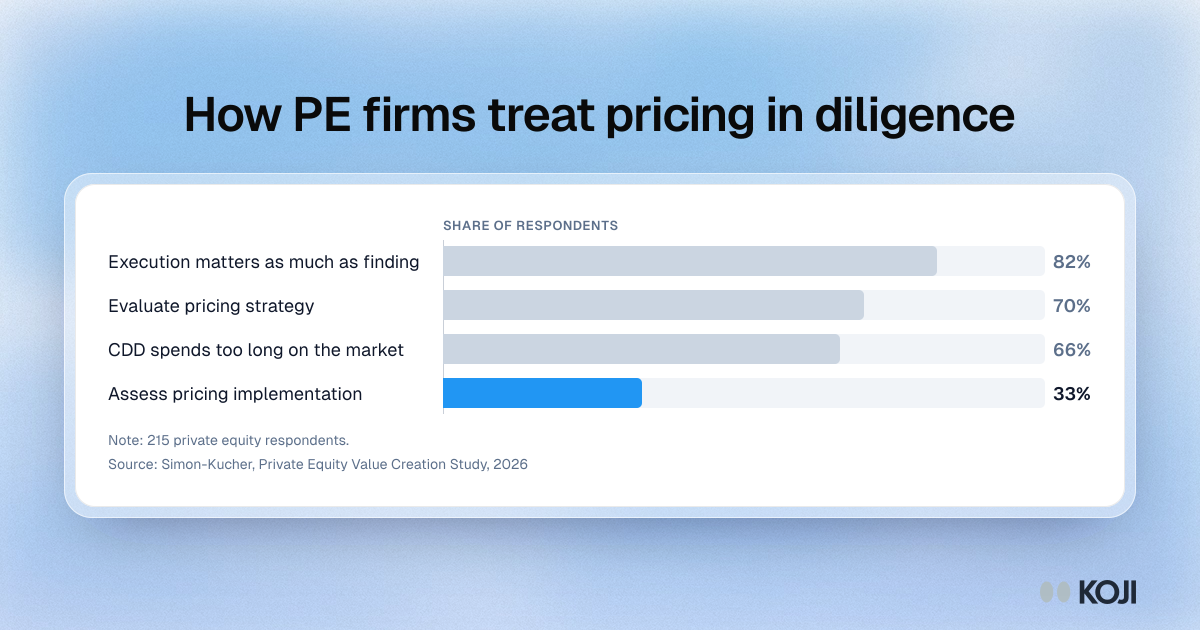
Bar chart of a 2026 PE survey: 82% value execution, 70% evaluate pricing strategy, 66% say CDD overweights the market, 33% assess pricing implementation

Bar chart

How PE firms treat pricing in diligence
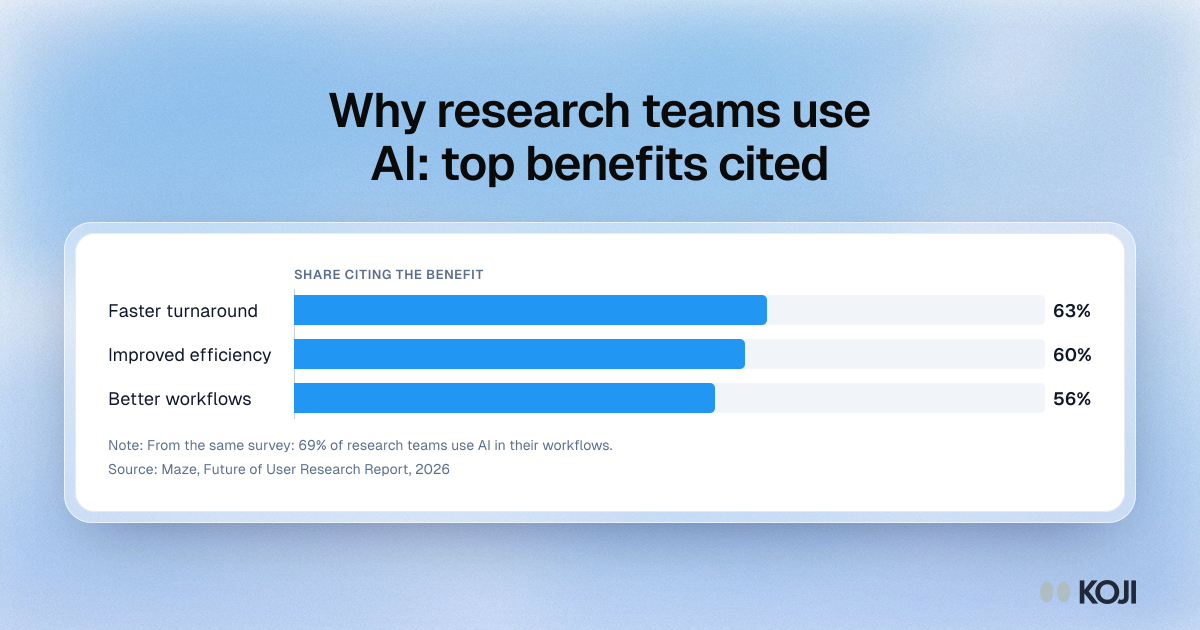
Bar chart of the top benefits research teams cite for using AI, from the Maze 2026 report: faster turnaround 63%, improved efficiency 60%, better workflows 56%.

Bar chart

Why research teams use AI: top benefits cited
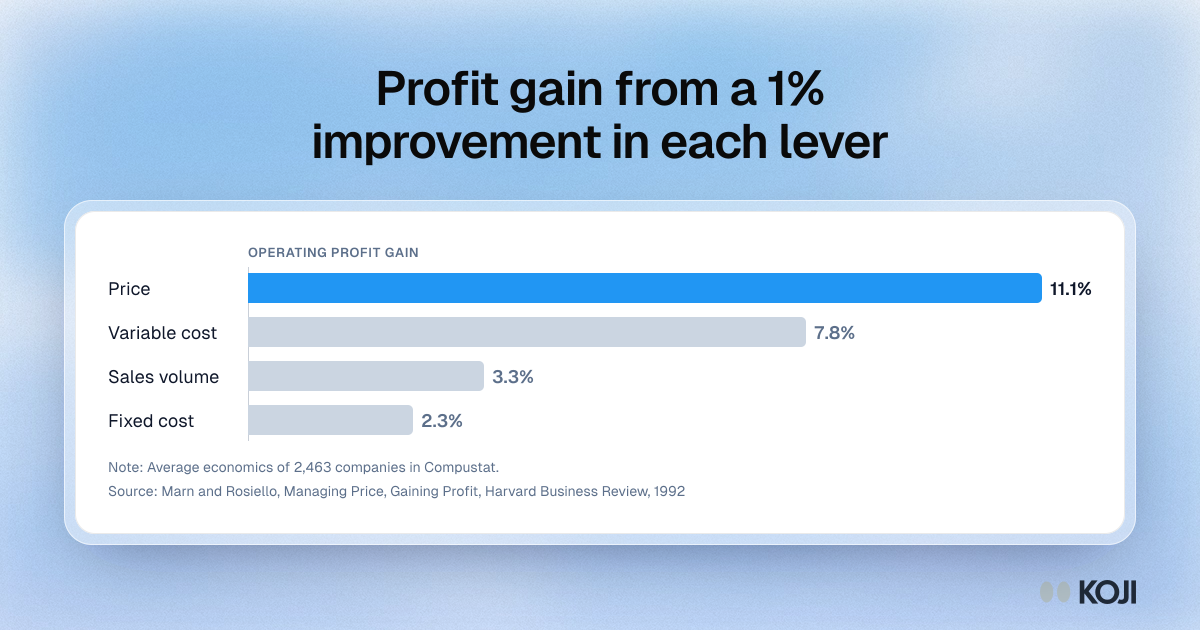
Bar chart of operating profit gain from a 1% improvement in each lever: price 11.1%, variable cost 7.8%, volume 3.3%, fixed cost 2.3%.

Bar chart

Profit gain from a 1% improvement in each lever
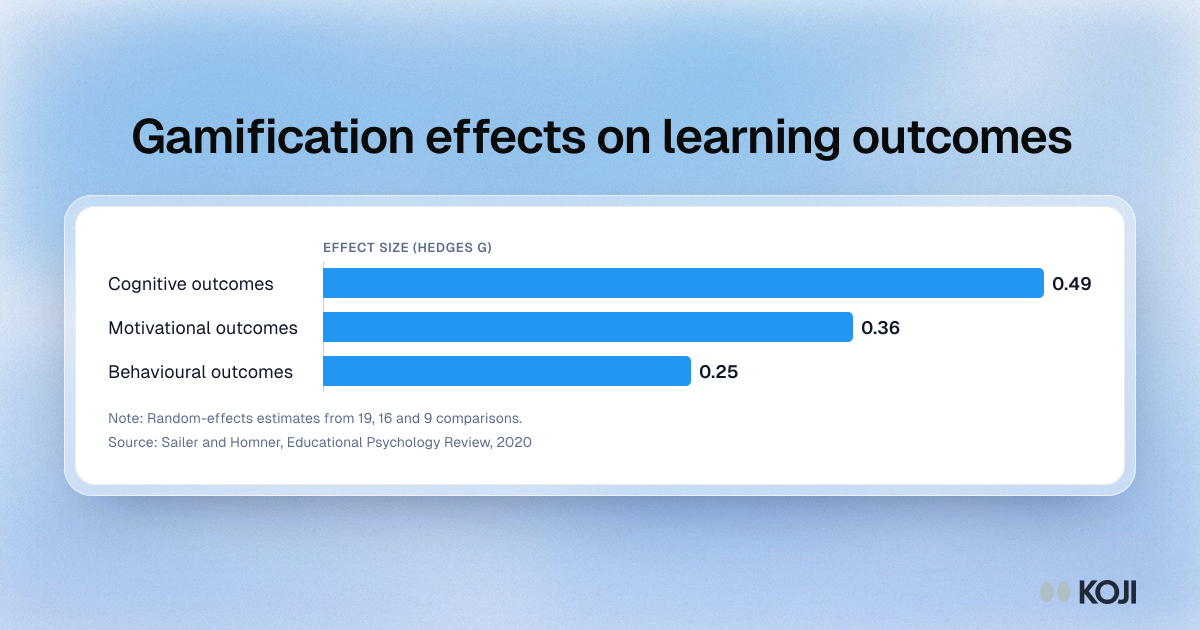
Bar chart of gamification effects on learning outcomes: cognitive g 0.49, motivational g 0.36, behavioural g 0.25.

Bar chart

Gamification effects on learning outcomes
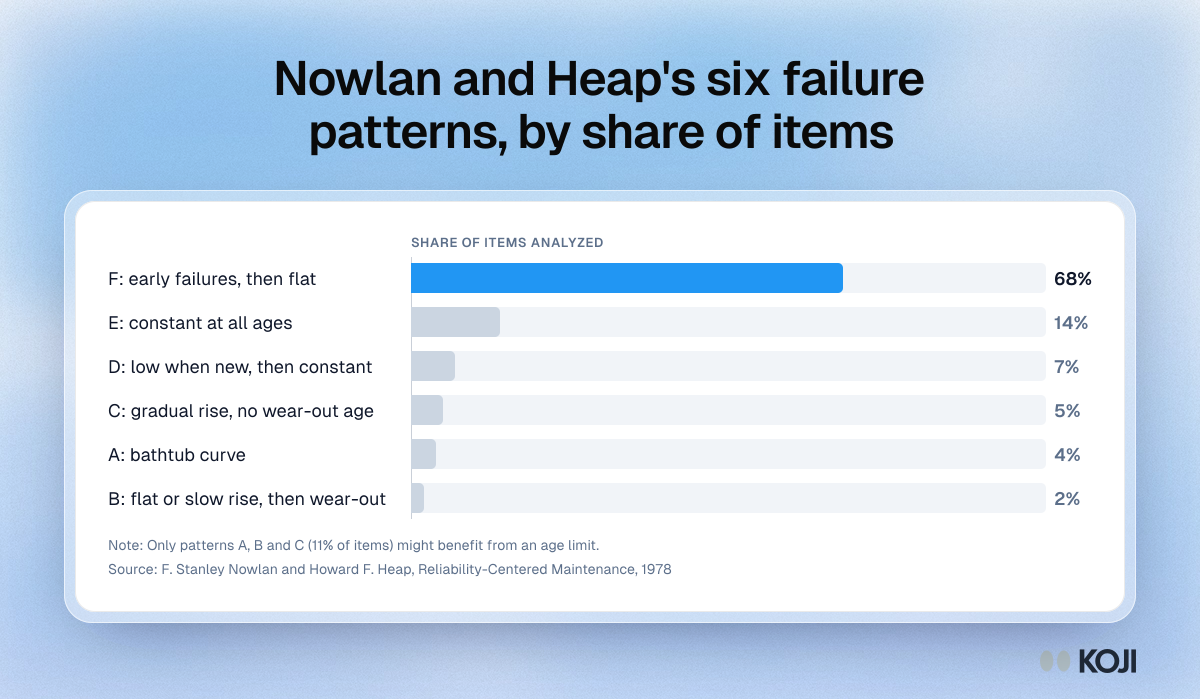
Bar chart of United Airlines components by failure pattern: F early failures then flat 68%, E constant 14%, D 7%, C 5%, A bathtub 4%, B 2%.

Bar chart

Nowlan and Heap's six failure patterns, by share of items
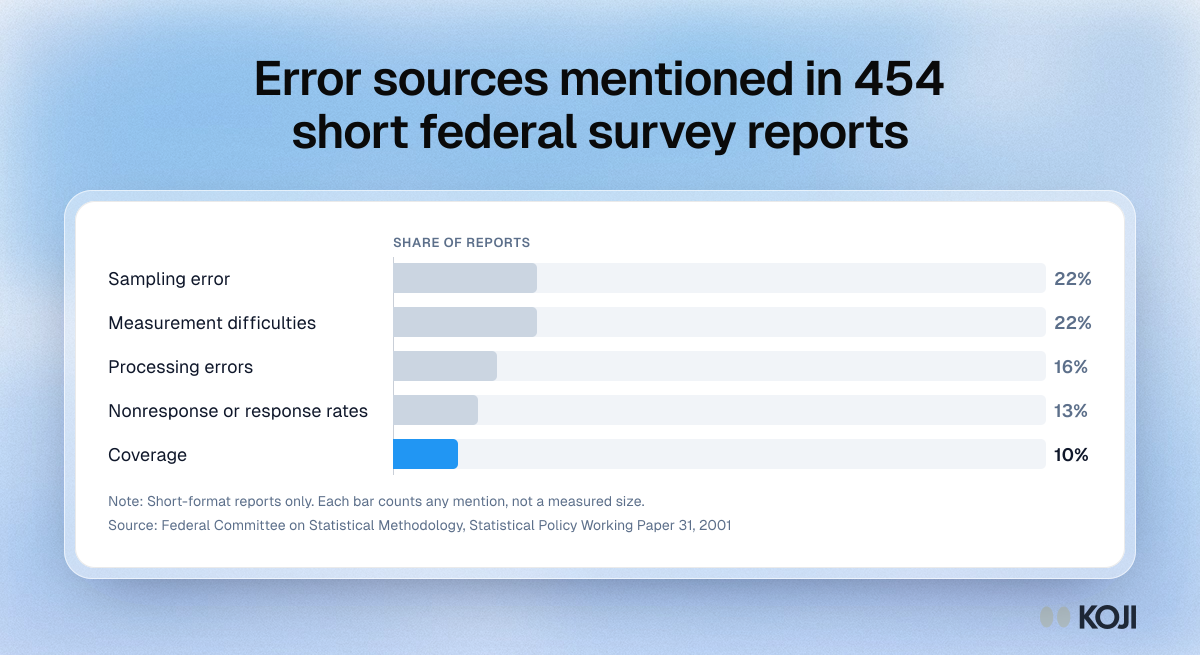
Bar chart of 454 short federal survey reports by error source mentioned: sampling 22%, measurement 22%, processing 16%, nonresponse 13%, coverage 10%.

Bar chart

Error sources mentioned in 454 short federal survey reports
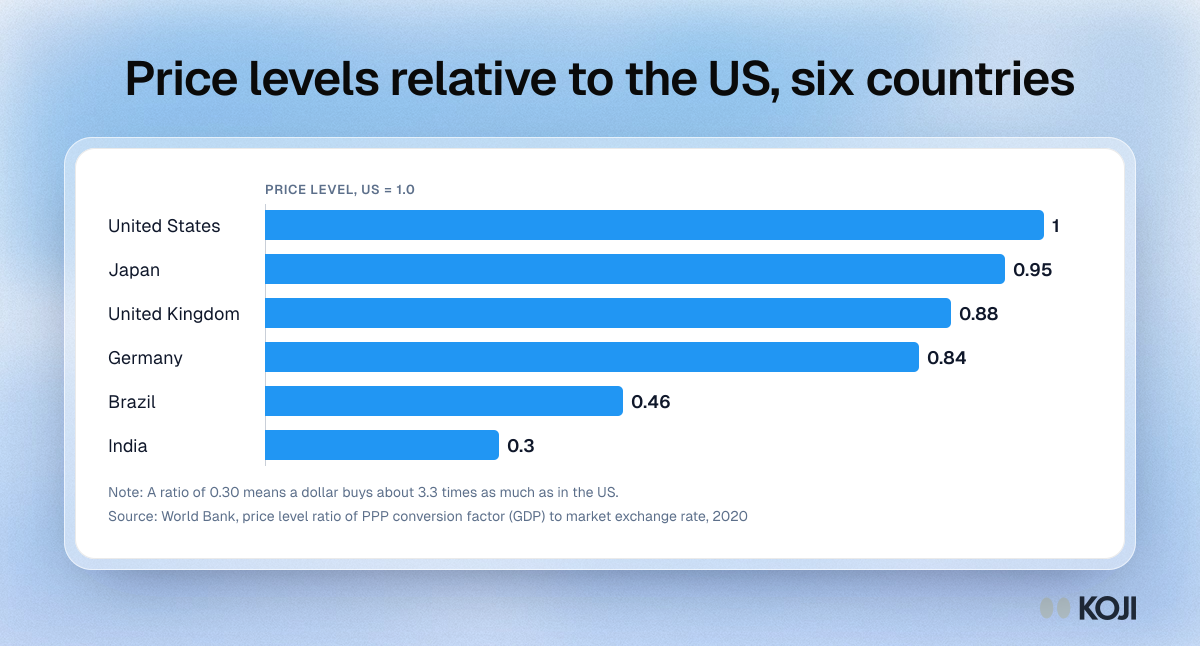
Bar chart of World Bank price level ratios relative to the United States in 2020: US 1.0, Japan 0.95, UK 0.88, Germany 0.84, Brazil 0.46, India 0.30

Bar chart

Price levels relative to the US, six countries
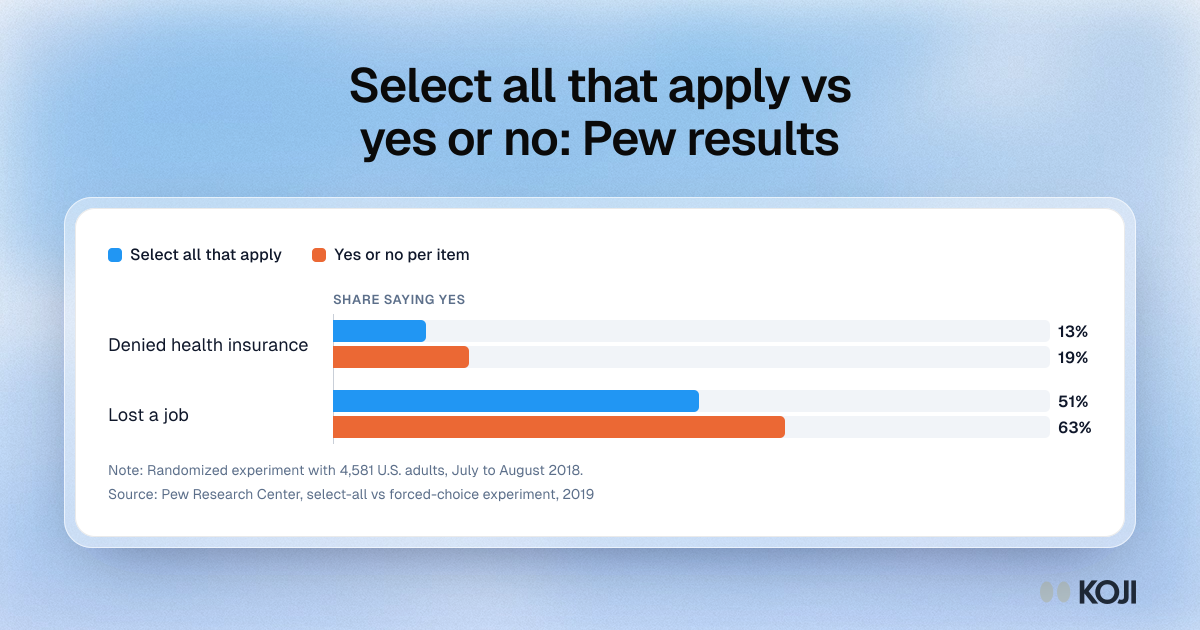
Bar chart from Pew Research Center comparing select-all and forced-choice answers: health insurance denial 13% vs 19%, job loss 51% vs 63%.

Bar chart

Select all that apply vs yes or no: Pew results
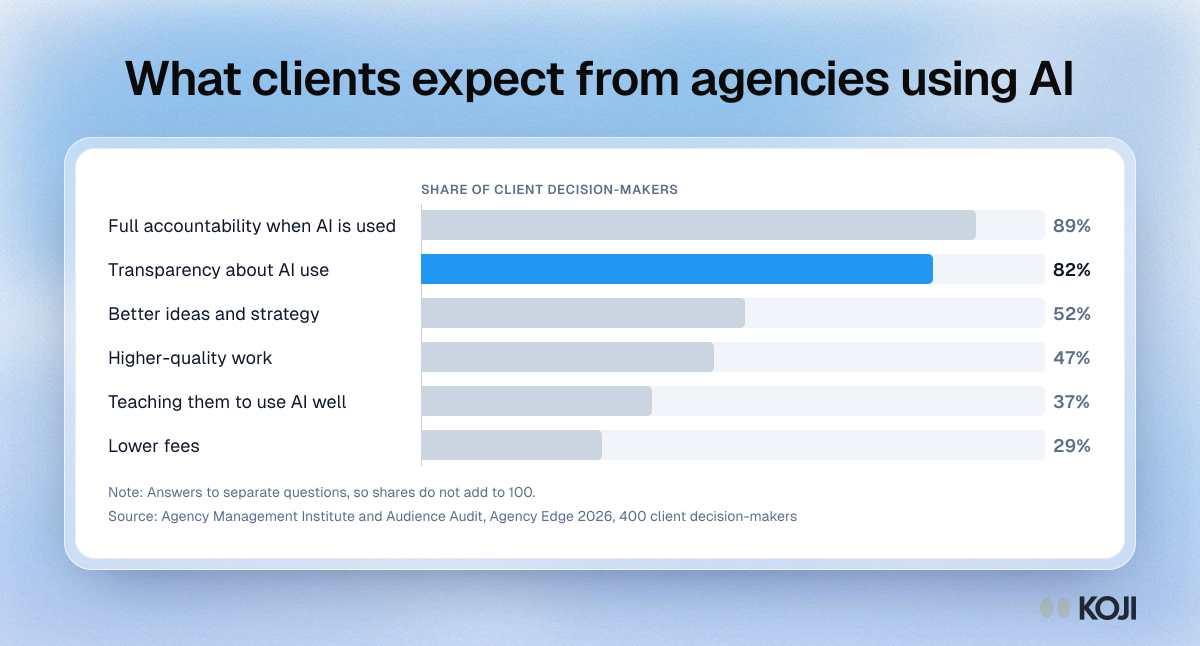
Bar chart of what 400 client decision-makers expect from agencies using AI: 89% full accountability, 82% transparency, 29% lower fees.

Bar chart

What clients expect from agencies using AI
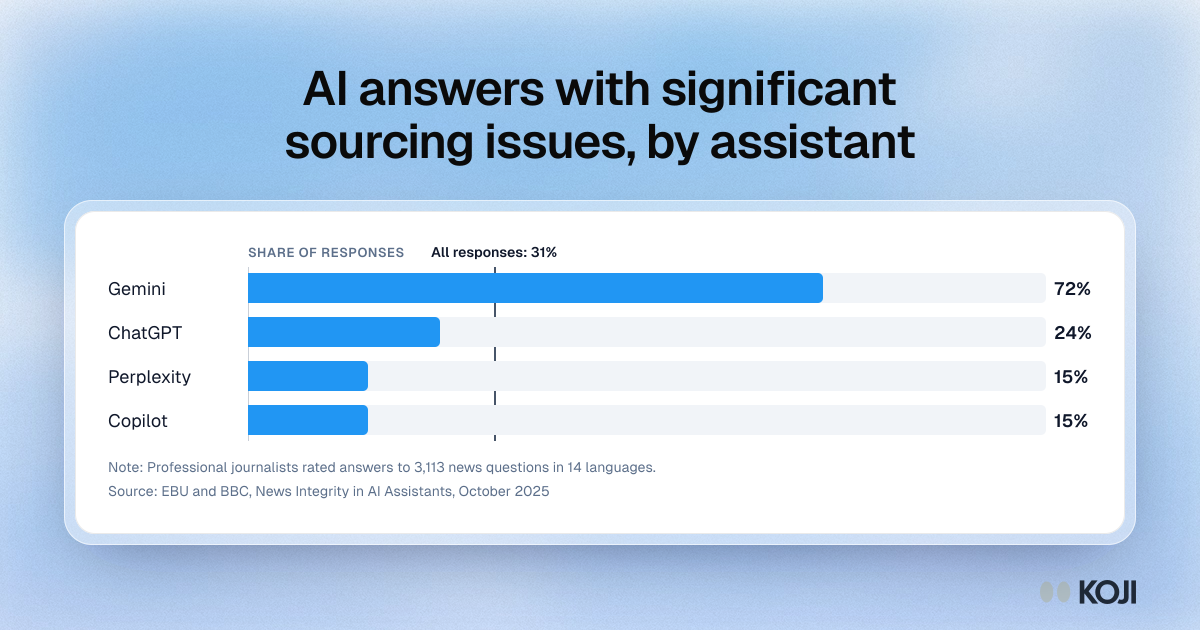
Bar chart of AI answers with significant sourcing issues: Gemini 72%, ChatGPT 24%, Perplexity 15% and Copilot 15%, against 31% across all responses.

Bar chart

AI answers with significant sourcing issues, by assistant
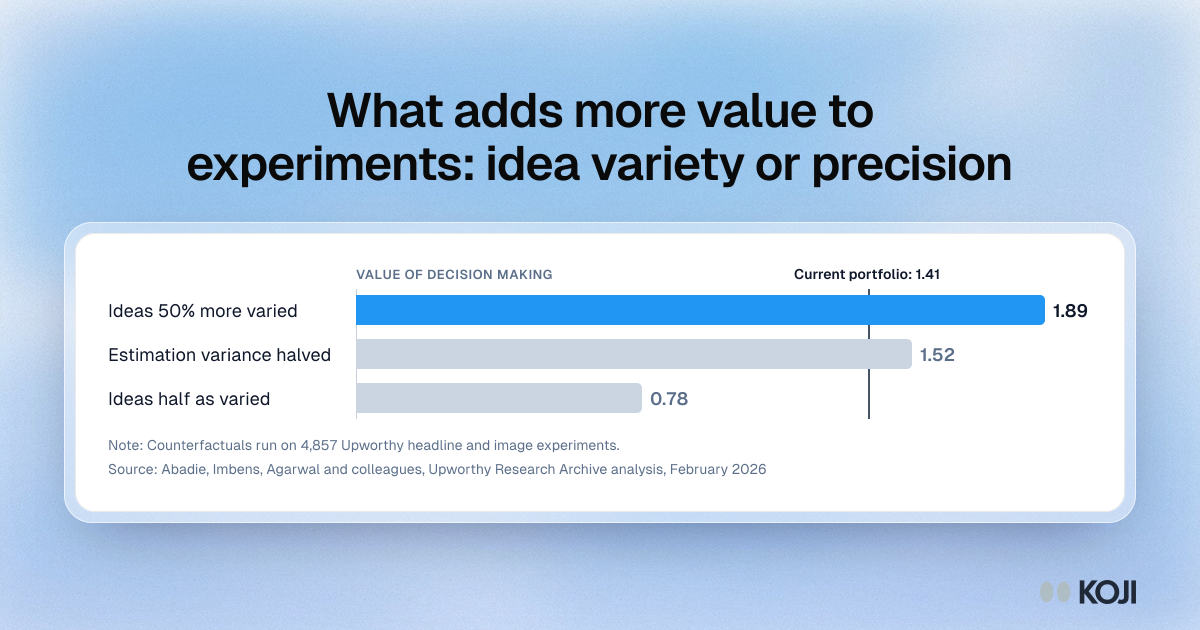
Bar chart from 4,857 Upworthy experiments: 50% more varied ideas raise decision value by 34%, halving variance adds 8%, halving variety cuts it by 44%.

Bar chart

What adds more value to experiments: idea variety or precision
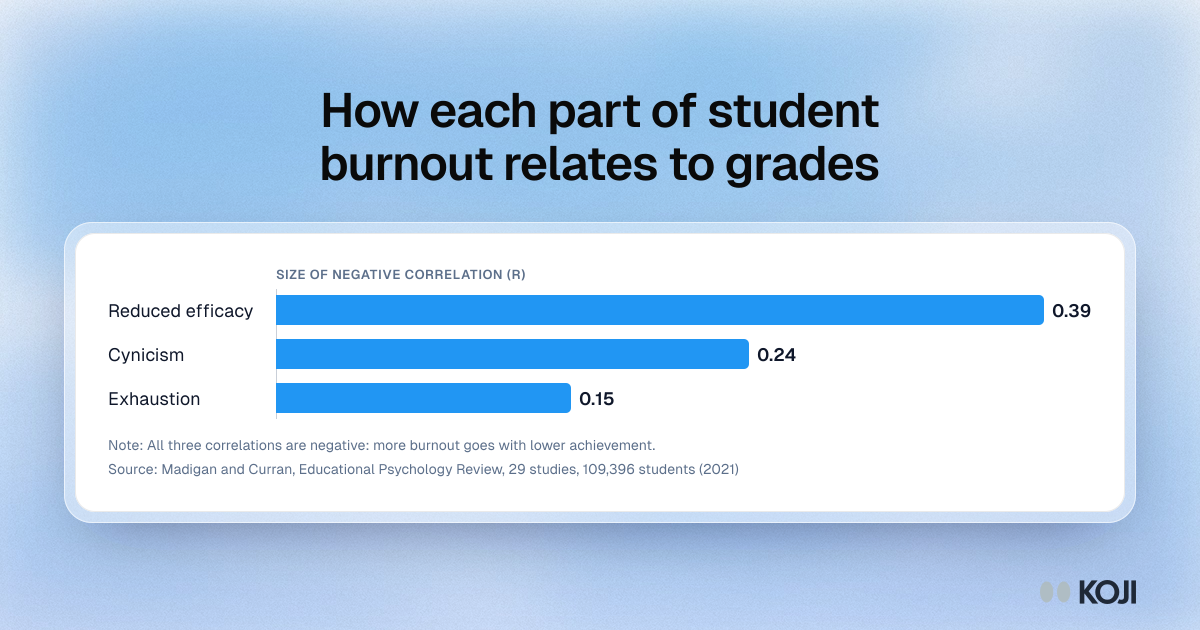
Bar chart of burnout dimensions and academic achievement: reduced efficacy r = -.39, cynicism r = -.24, exhaustion r = -.15.

Bar chart

How each part of student burnout relates to grades
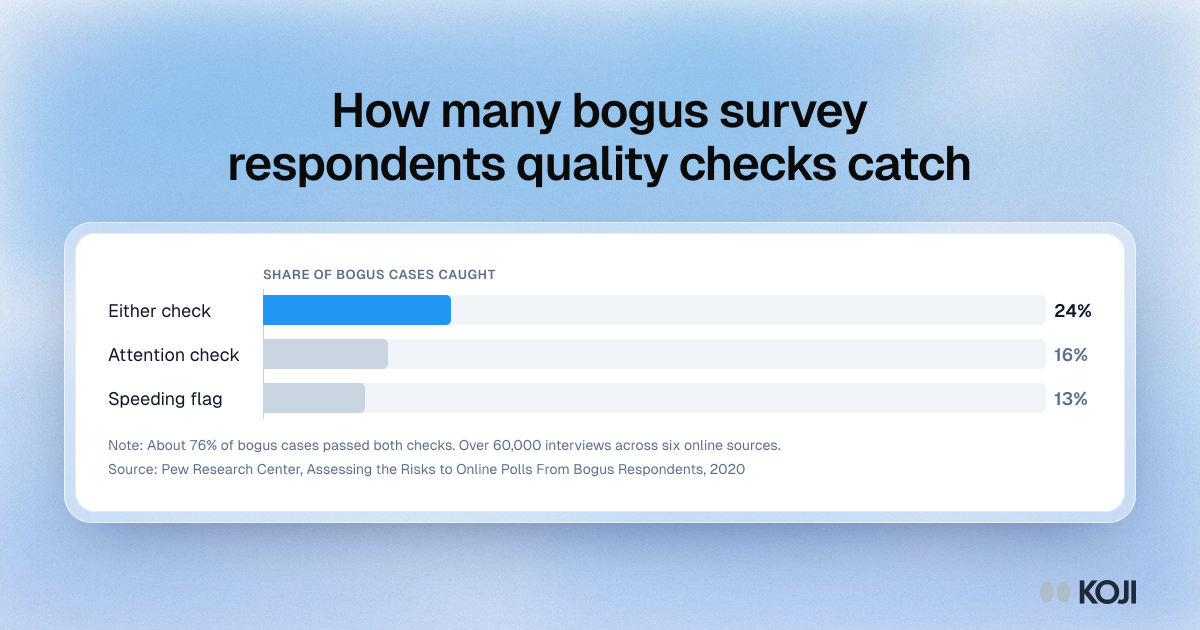
Bar chart of bogus survey respondents caught by quality checks: 16% by an attention check, 13% by a speeding flag and 24% by either one.

Bar chart

How many bogus survey respondents quality checks catch
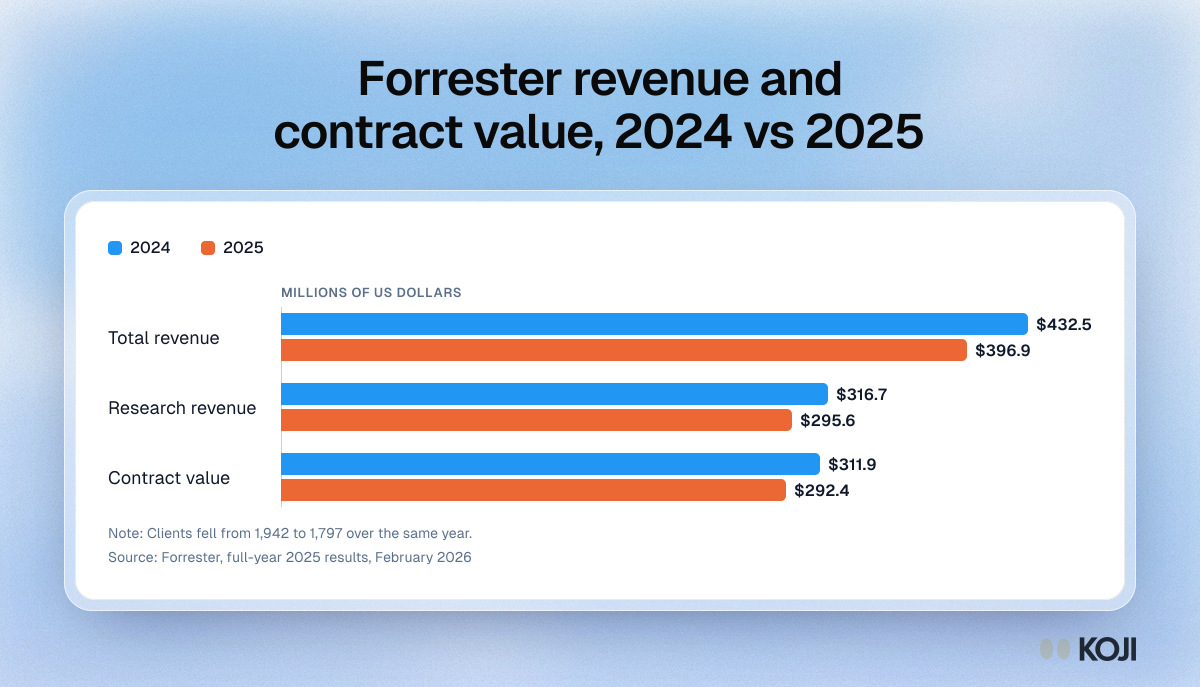
Bar chart of Forrester results in millions of dollars: revenue fell from 432.5 to 396.9, research revenue 316.7 to 295.6, contract value 311.9 to 292.4.

Bar chart

Forrester revenue and contract value, 2024 vs 2025
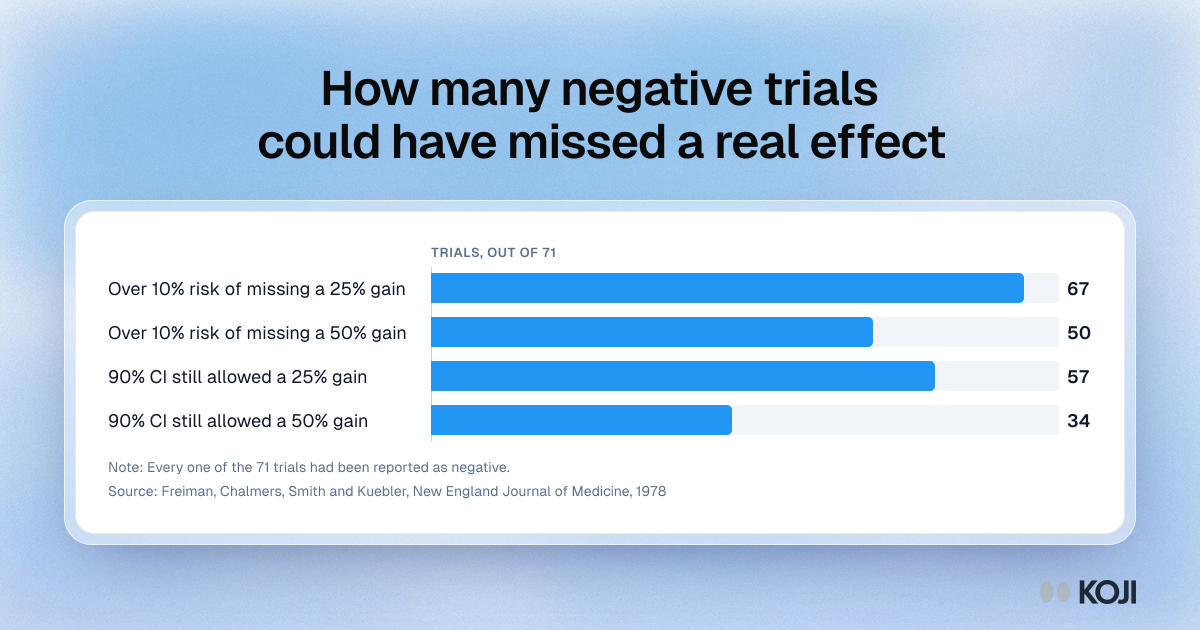
Bar chart of 71 trials reported as negative: 67 risked missing a 25% improvement, and in 34 the data still allowed a 50% improvement.

Bar chart

How many negative trials could have missed a real effect
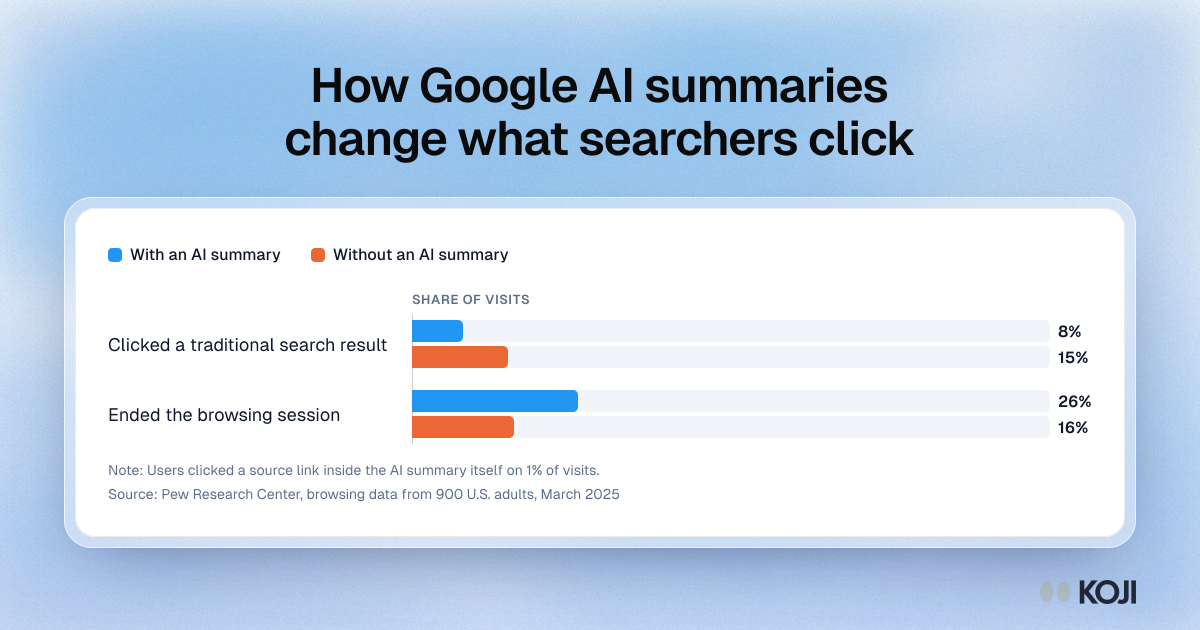
Bar chart: searchers clicked a traditional result on 8% of visits with an AI summary against 15% without, and ended the session on 26% against 16%.

Bar chart

How Google AI summaries change what searchers click
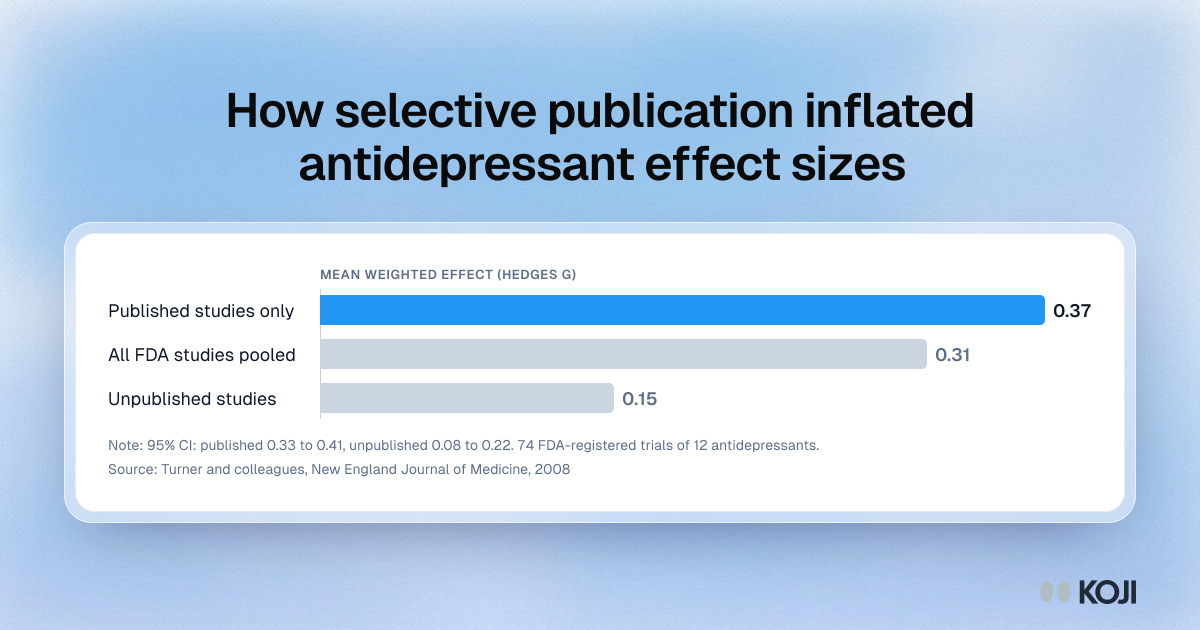
Bar chart of antidepressant trial effect sizes: 0.37 in published studies, 0.31 across all FDA studies and 0.15 in unpublished studies.

Bar chart

How selective publication inflated antidepressant effect sizes
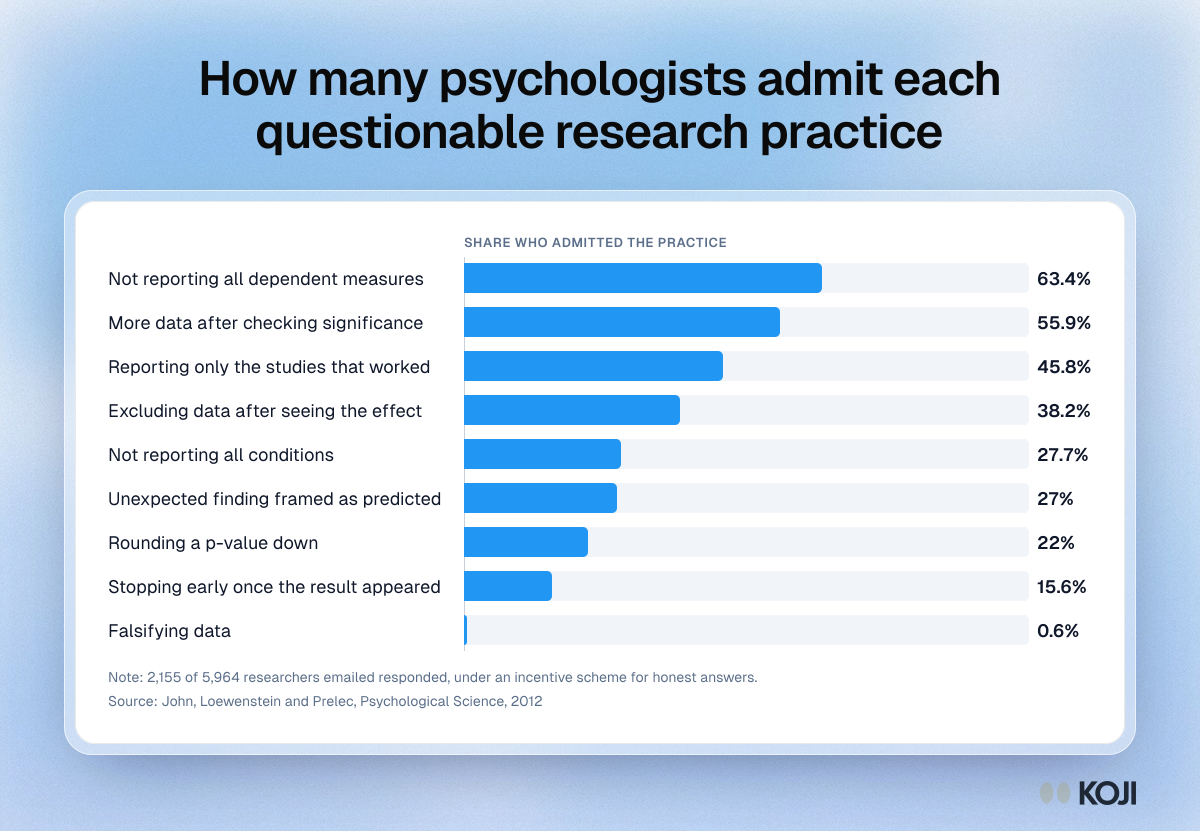
Bar chart of self-admitted research practices: 63.4% did not report all measures, 55.9% added data after checking results, 0.6% falsified data.

Bar chart

How many psychologists admit each questionable research practice
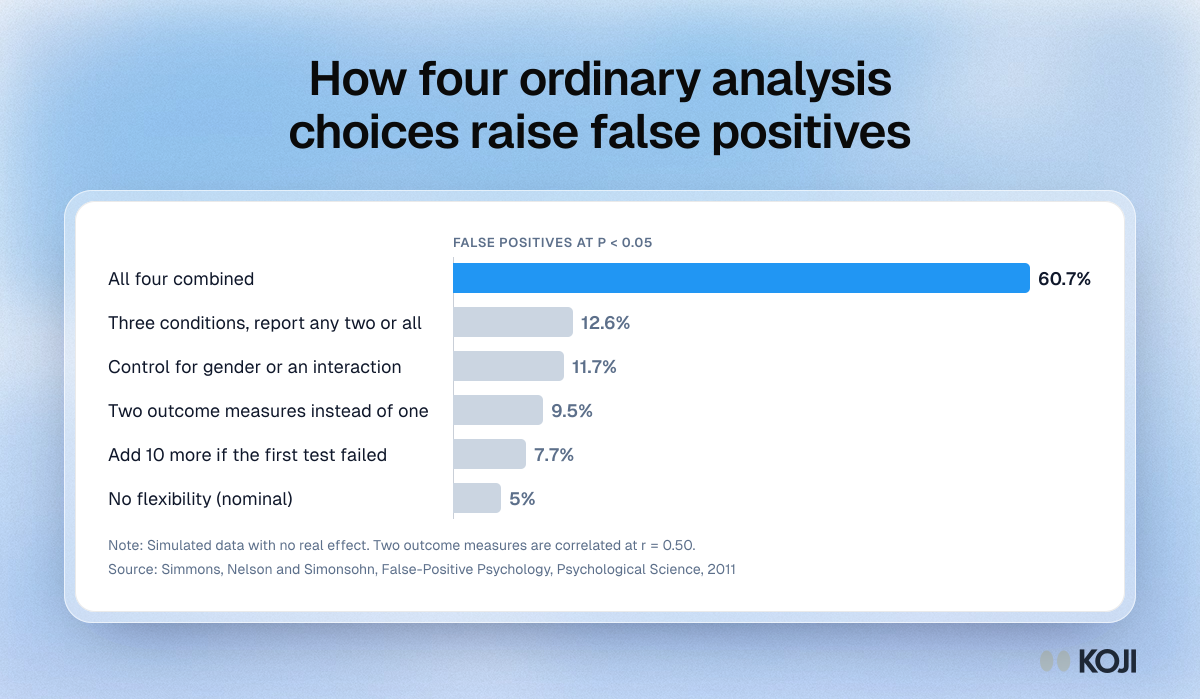
Bar chart of simulated false-positive rates: 5% with no flexibility, 7.7% to 12.6% for each single choice, and 60.7% with all four combined.

Bar chart

How four ordinary analysis choices raise false positives
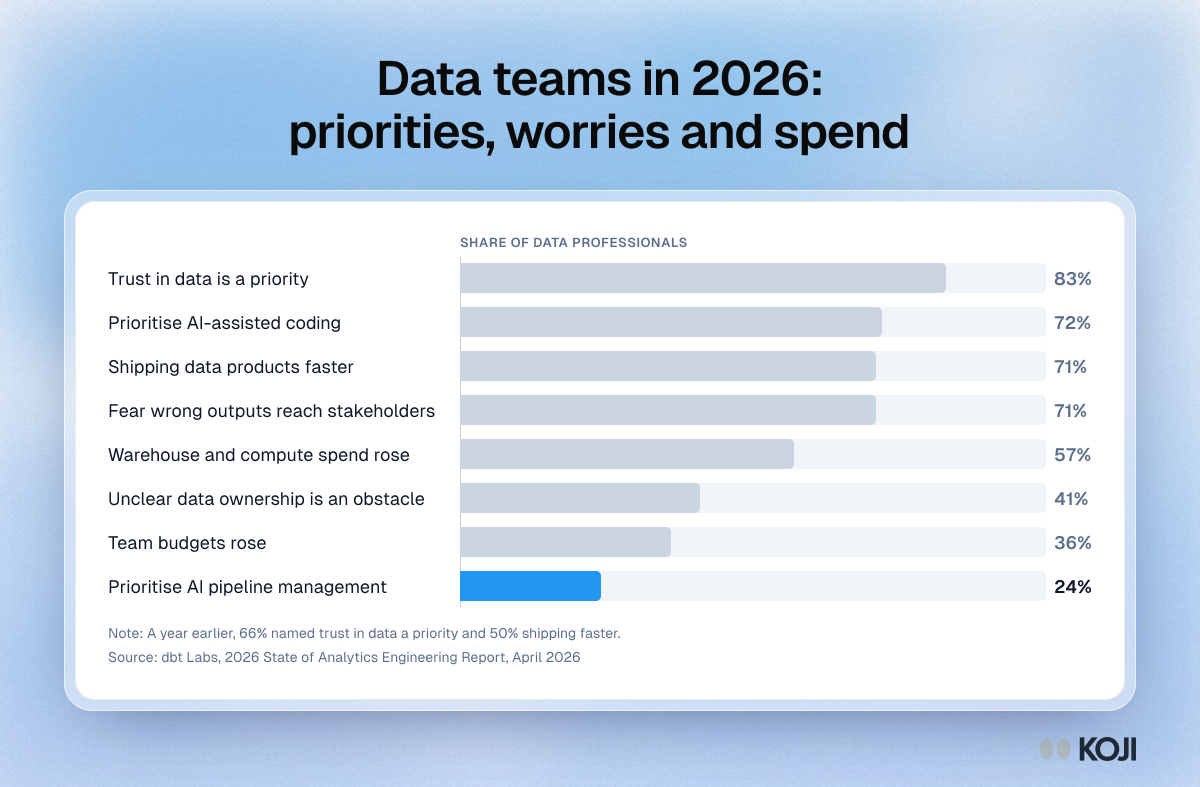
Bar chart from the 2026 State of Analytics Engineering Report: 72% prioritise AI-assisted coding, but only 24% AI pipeline management.

Bar chart

Data teams in 2026: priorities, worries and spend
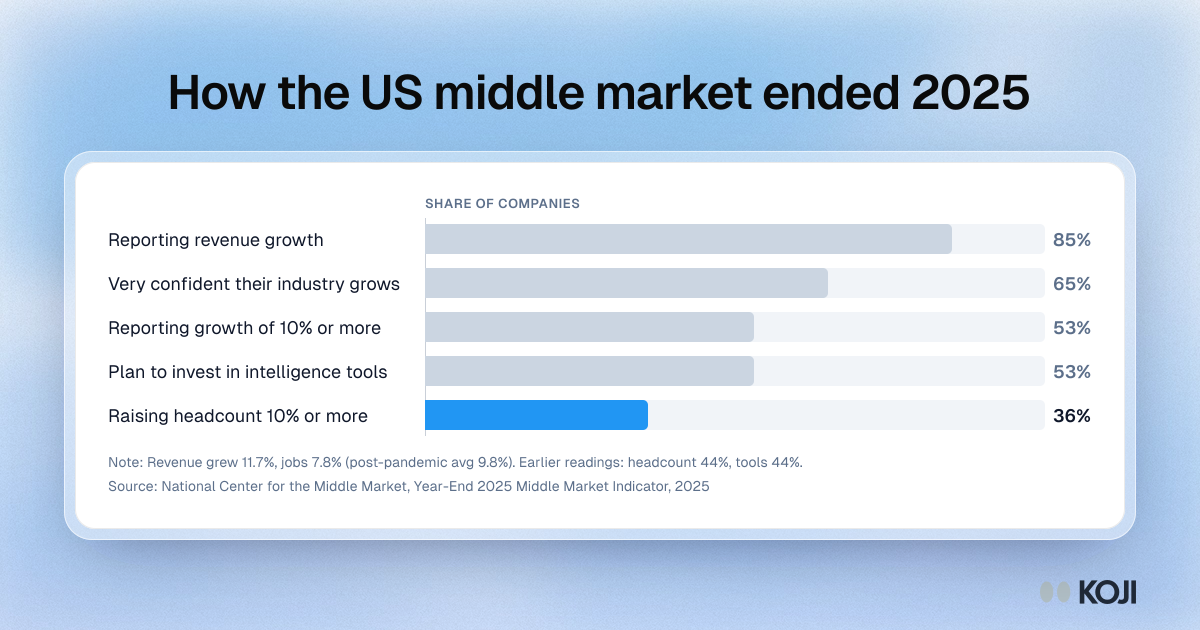
Bar chart of the Year-End 2025 Middle Market Indicator: 85% of firms grew revenue, while only 36% raised headcount by 10% or more.

Bar chart

How the US middle market ended 2025
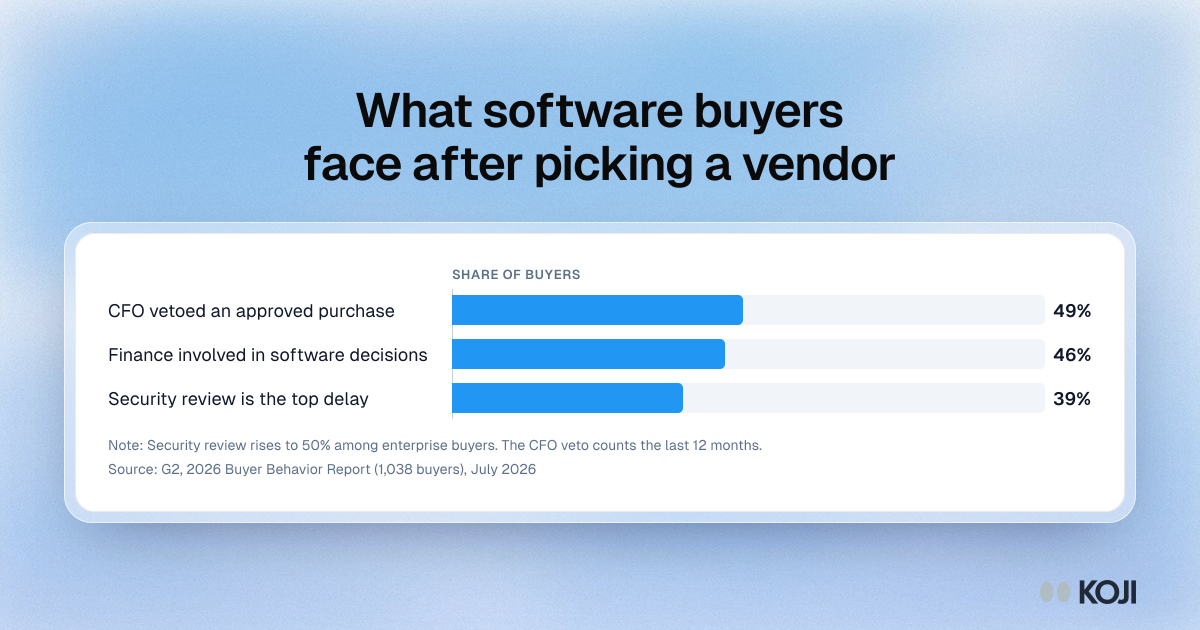
Bar chart of G2 2026 buyer survey results: 49% saw a CFO veto an approved purchase, 46% have finance involved, 39% name security review as the top delay.

Bar chart

What software buyers face after picking a vendor
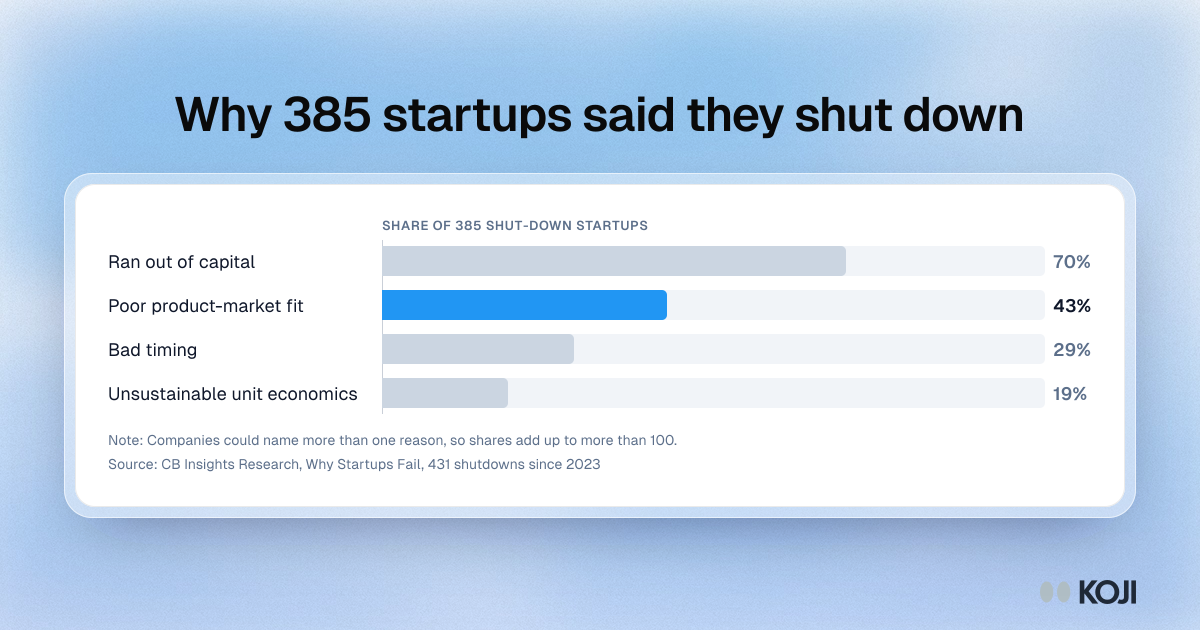
Bar chart of reasons 385 shut-down startups gave: ran out of capital 70 percent, poor product-market fit 43, bad timing 29, weak unit economics 19.

Bar chart

Why 385 startups said they shut down
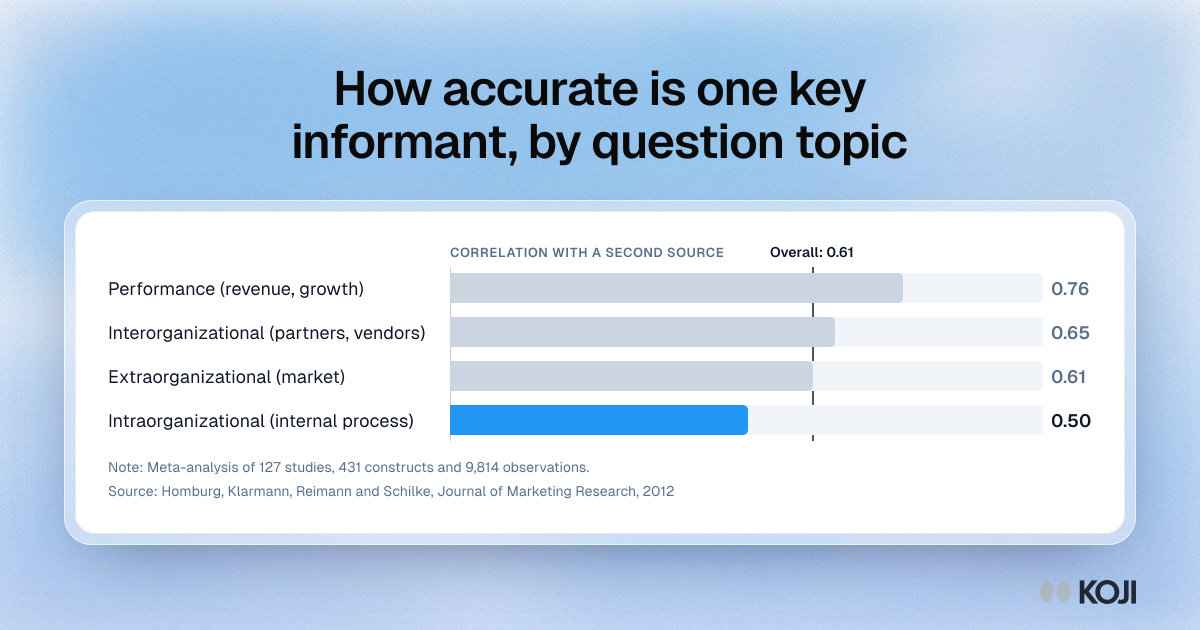
Bar chart of key informant accuracy: correlation with a second source is .764 for performance questions but only .502 for internal process questions.

Bar chart

How accurate is one key informant, by question topic
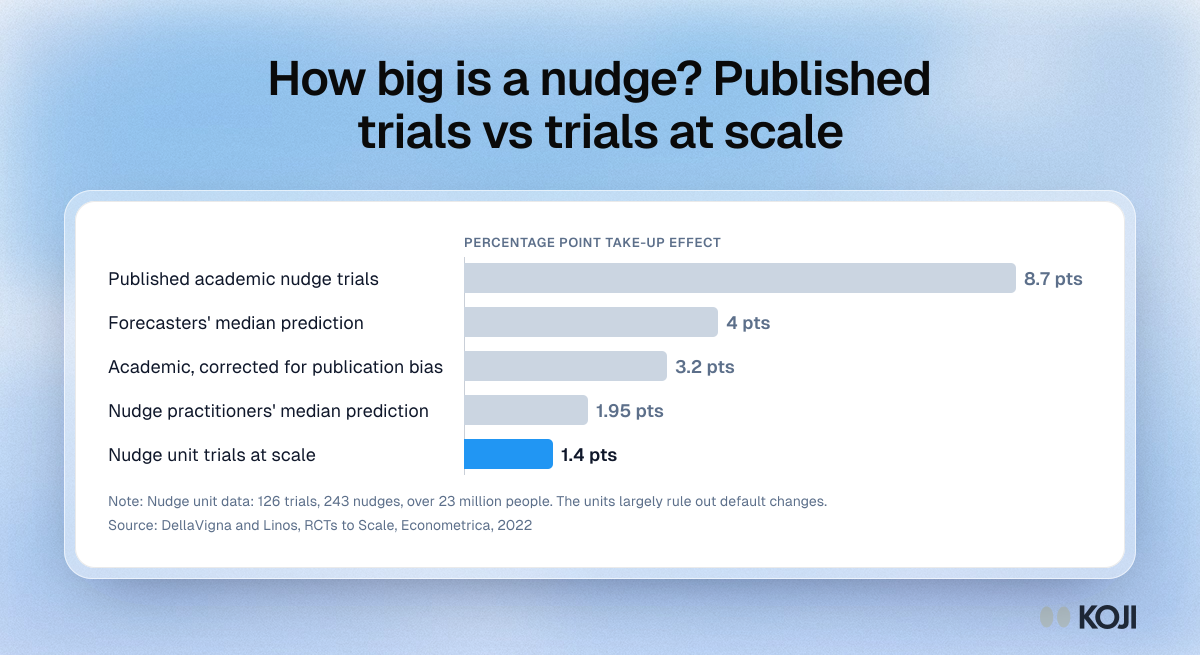
Bar chart of nudge effect sizes: 8.7 points in published academic trials against 1.4 points in 126 nudge unit trials run at scale.

Bar chart

How big is a nudge? Published trials vs trials at scale
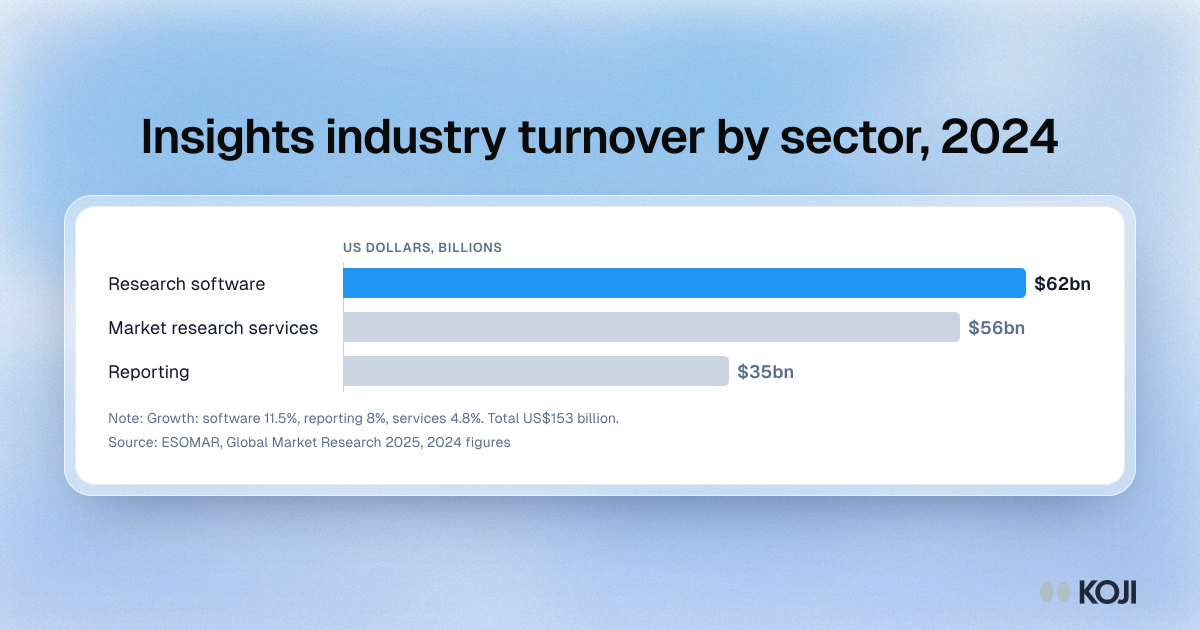
Bar chart of the 153 billion dollar insights industry: research software 62 billion, market research services 56 billion, reporting 35 billion.

Bar chart

Insights industry turnover by sector, 2024
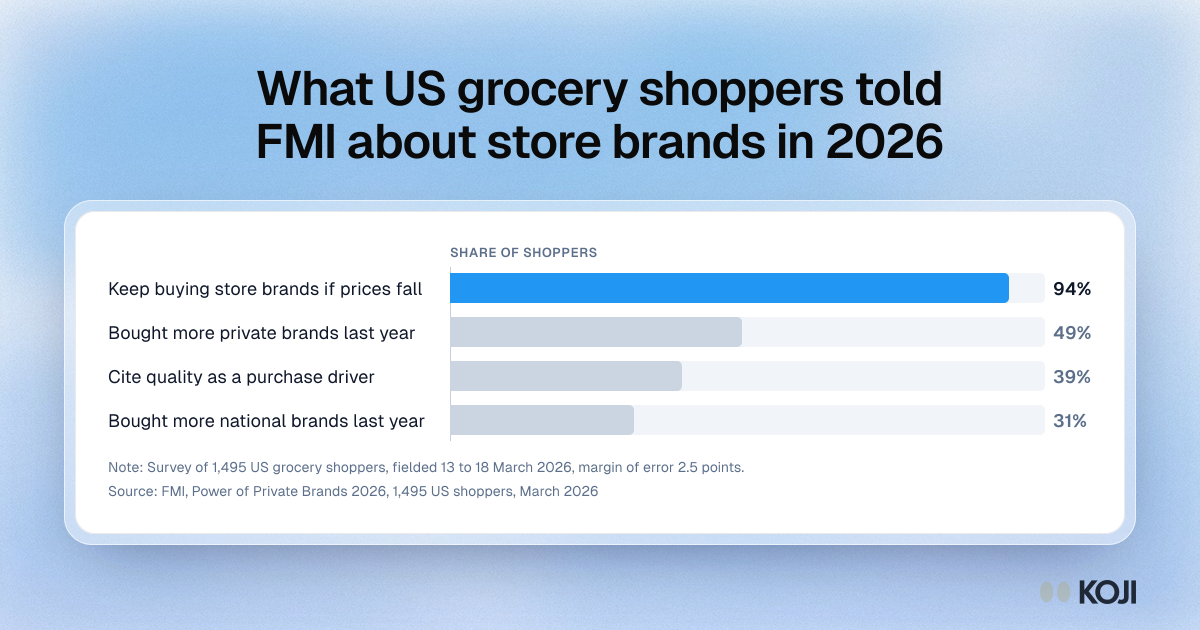
Bar chart of FMI 2026 survey results: 94% of shoppers will keep buying store brands if prices fall, 49% bought more private brands last year.

Bar chart

What US grocery shoppers told FMI about store brands in 2026
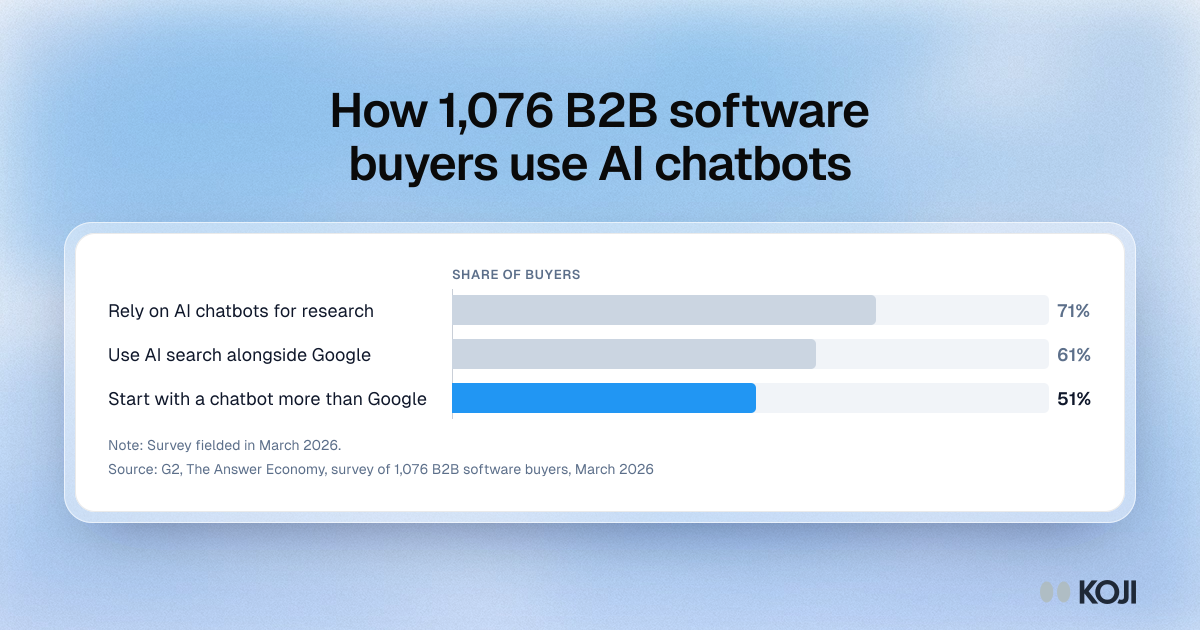
Bar chart of G2's 2026 survey of 1,076 software buyers: 71% rely on AI chatbots, 61% pair AI search with Google, 51% start with a chatbot.

Bar chart

How 1,076 B2B software buyers use AI chatbots
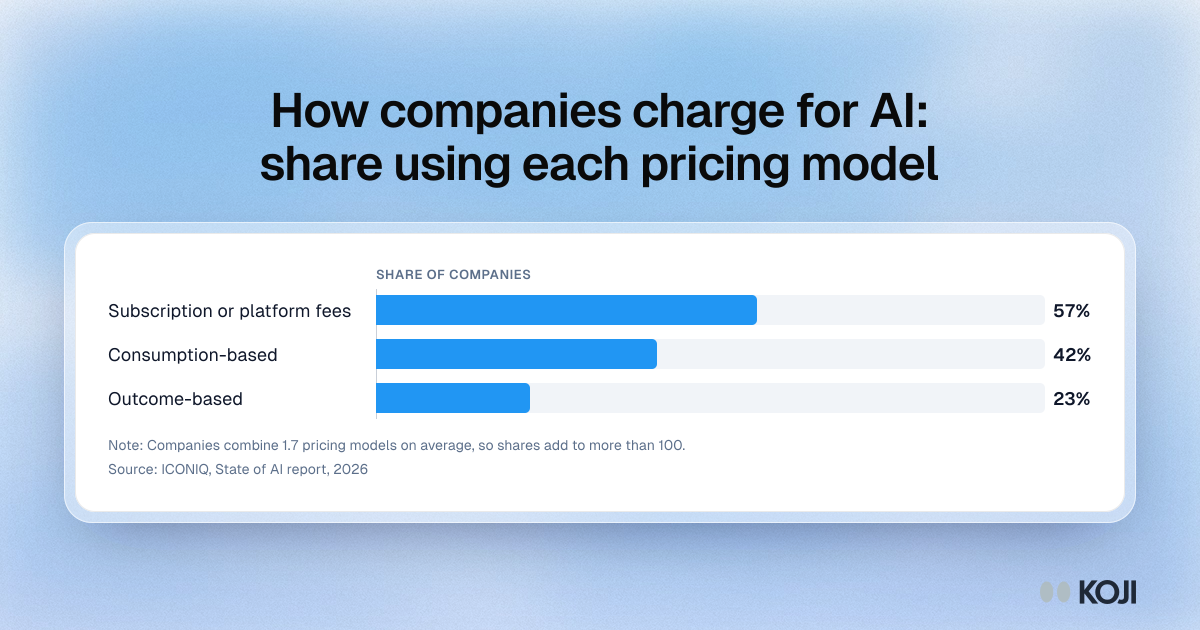
Bar chart of AI pricing models in 2026: 57% of companies use subscription or platform fees, 42% consumption-based and 23% outcome-based pricing.

Bar chart

How companies charge for AI: share using each pricing model
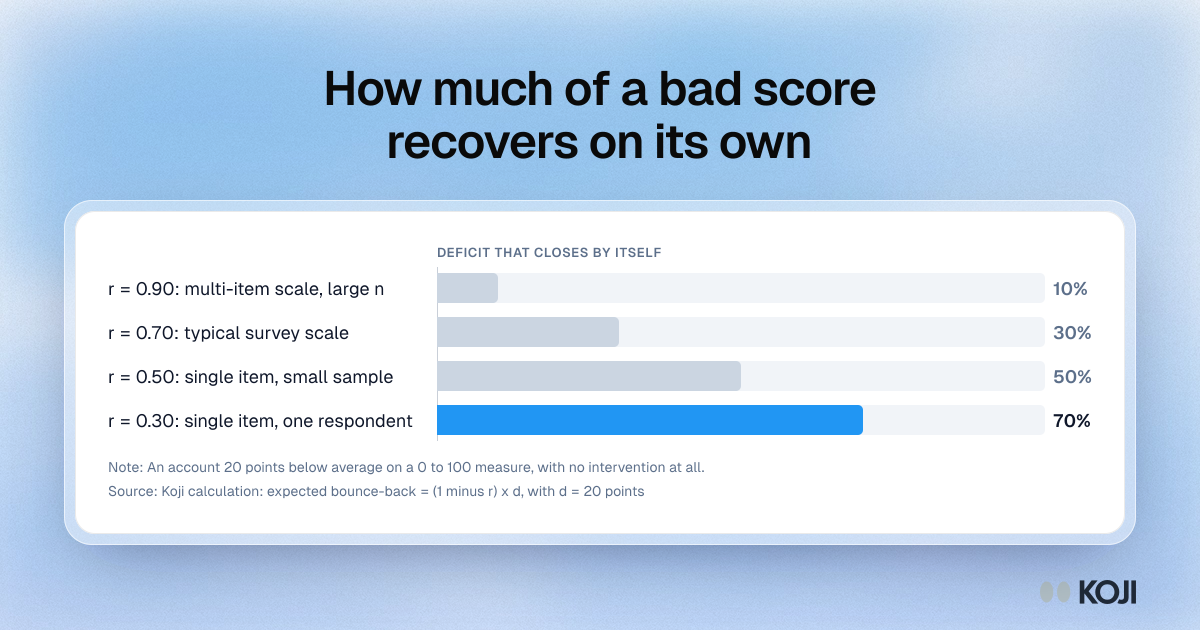
Bar chart of how much of a 20-point deficit closes with no intervention: 10% at reliability 0.90, 30% at 0.70, 50% at 0.50 and 70% at 0.30

Bar chart

How much of a bad score recovers on its own
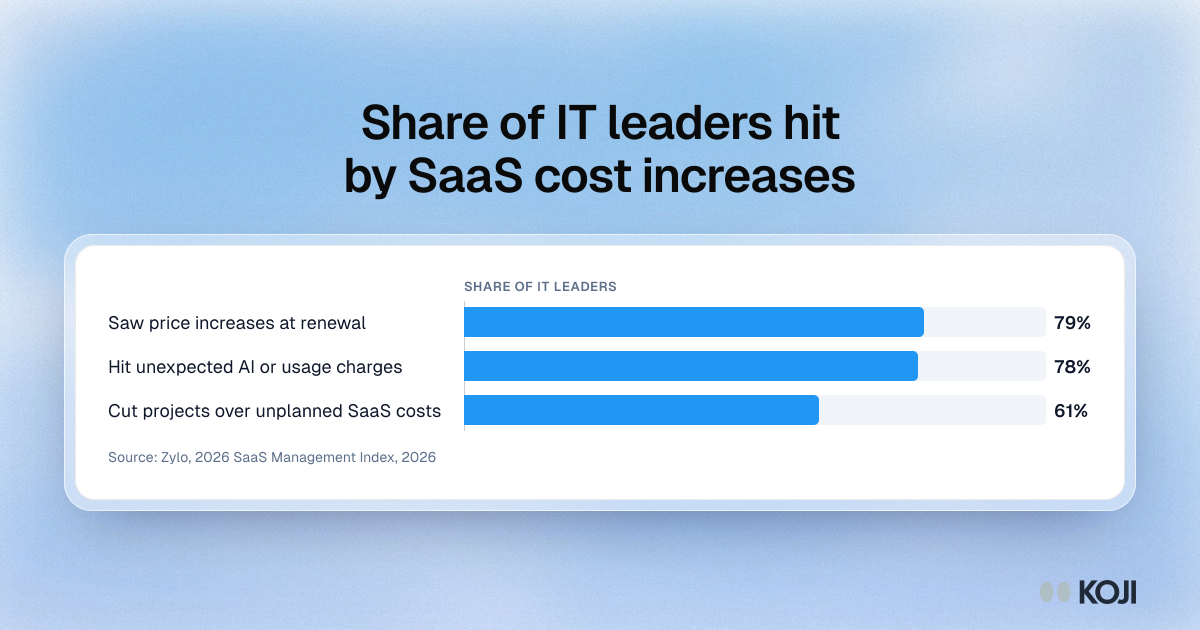
Bar chart of IT leaders hit by SaaS cost increases in the past year: 79% saw renewal price rises, 78% unexpected AI or usage charges, 61% cut projects.
Bar chart

Share of IT leaders hit by SaaS cost increases

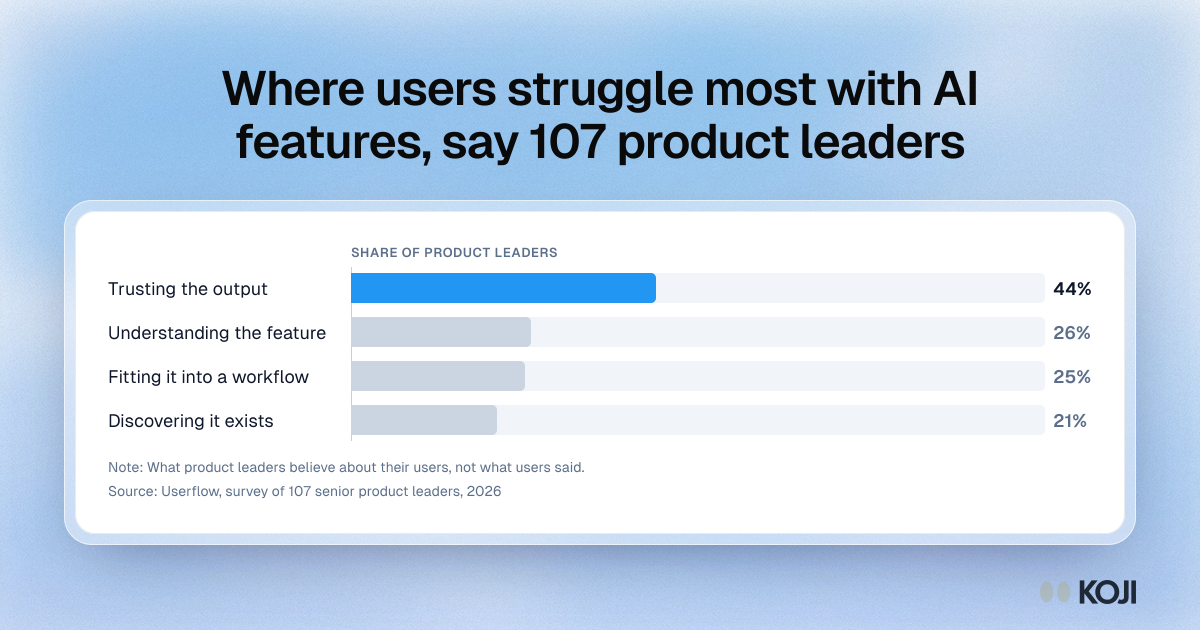
Bar chart of where product leaders say users struggle with AI features: trusting the output 44%, understanding it 26%, workflow fit 25%, discovery 21%.

Bar chart

Where users struggle most with AI features, say 107 product leaders
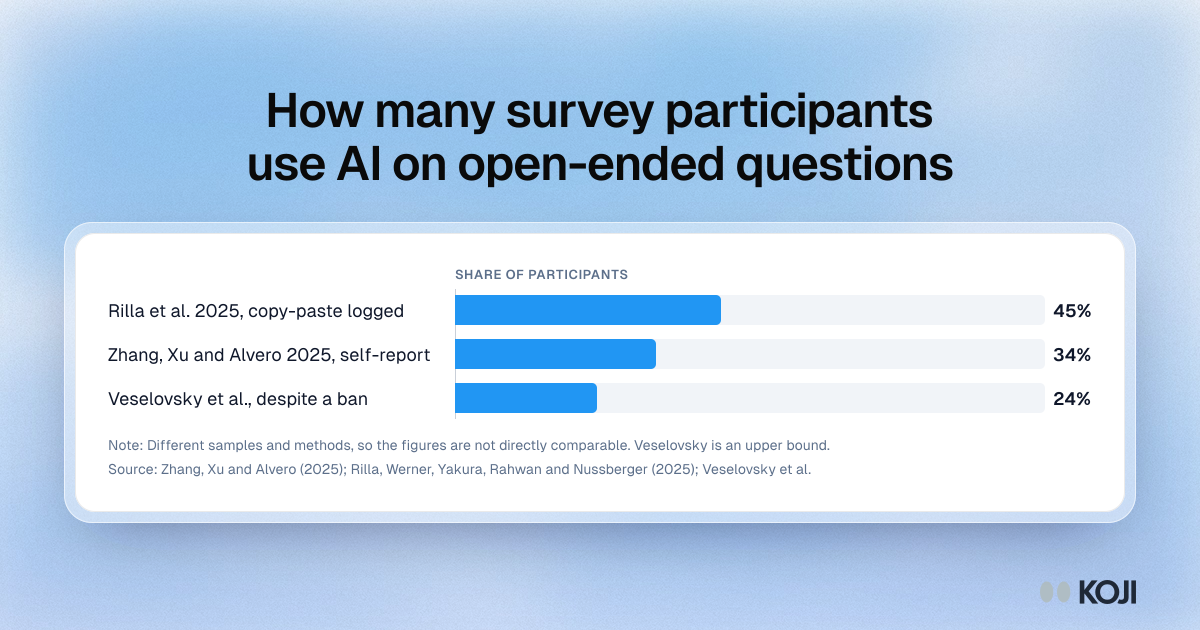
Bar chart of survey participants using AI on open-ended questions: 45% copy and paste logged, 34% self-reported, up to 24% despite a ban.

Bar chart

How many survey participants use AI on open-ended questions
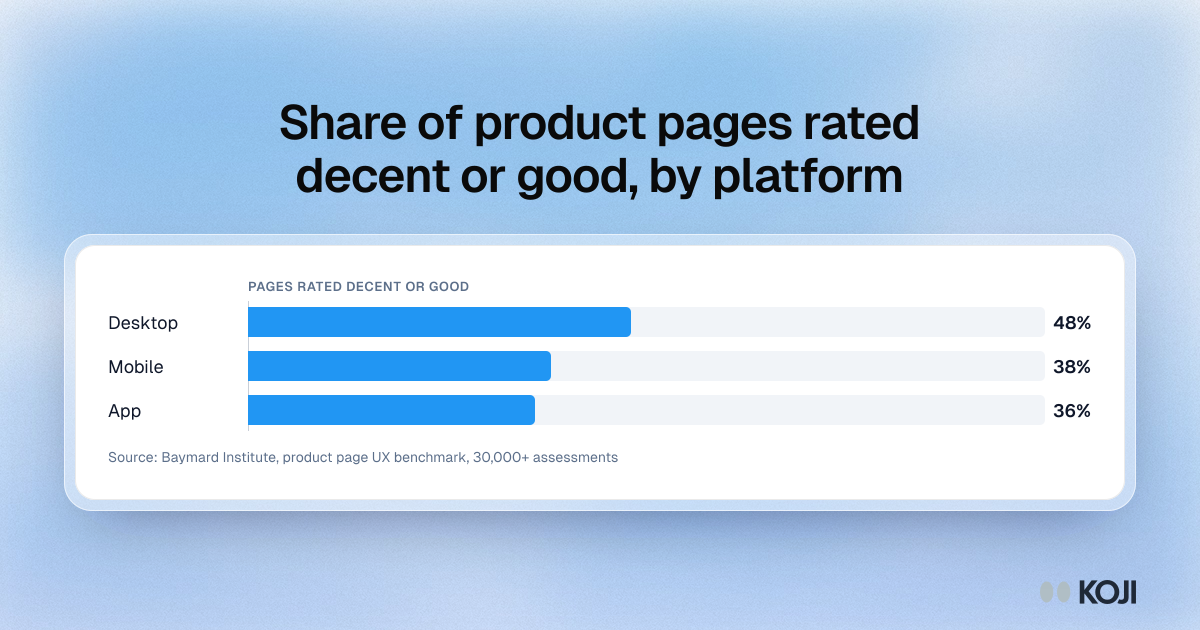
Bar chart of product pages Baymard Institute rated decent or good: 48% on desktop, 38% on mobile and 36% in apps.

Bar chart

Share of product pages rated decent or good, by platform
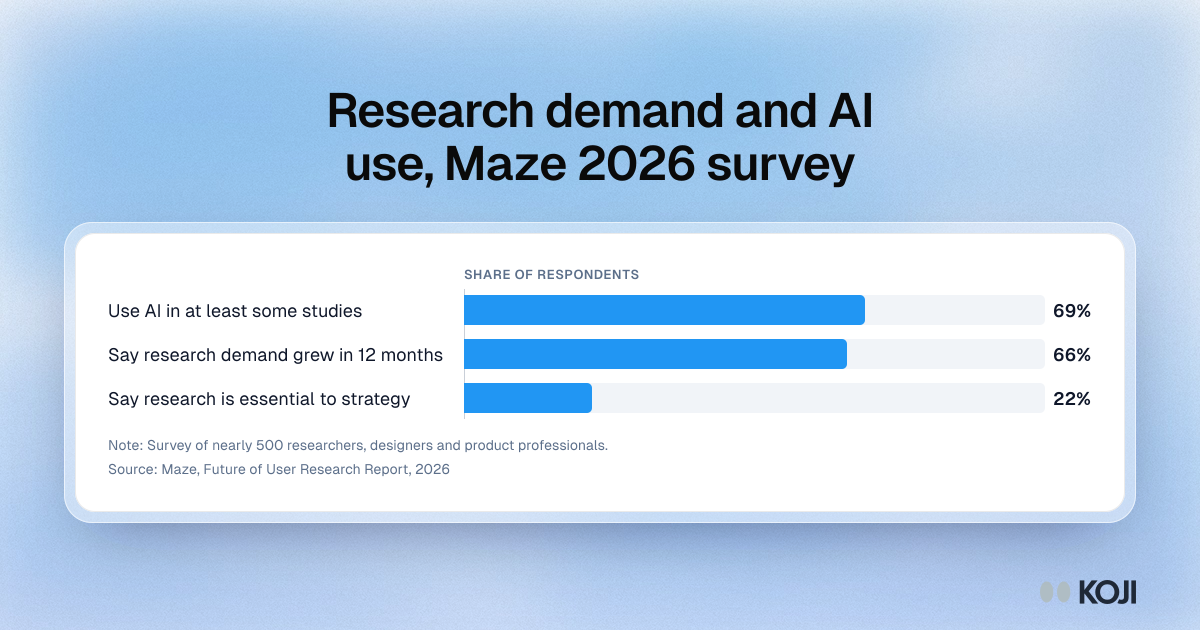
Bar chart of three findings from Maze's 2026 survey: 69% use AI in some studies, 66% saw research demand grow and 22% say research is essential to strategy.

Bar chart

Research demand and AI use, Maze 2026 survey
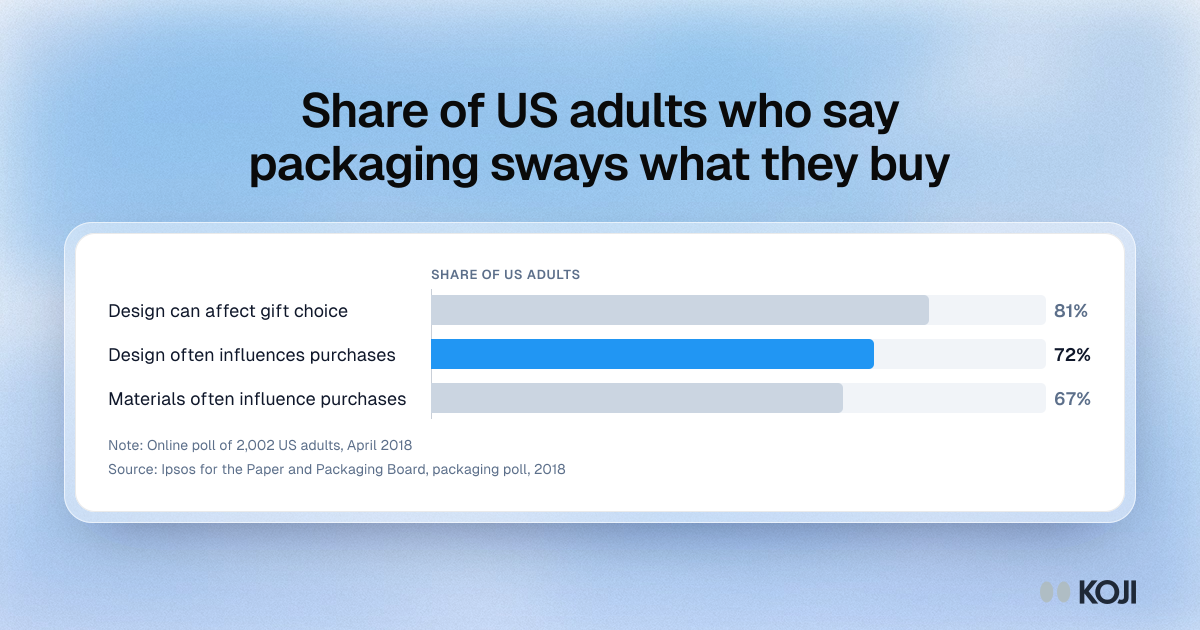
Bar chart: 81% of US adults say design can affect gift choice, 72% say packaging design often sways purchases, 67% say materials do.

Bar chart

Share of US adults who say packaging sways what they buy
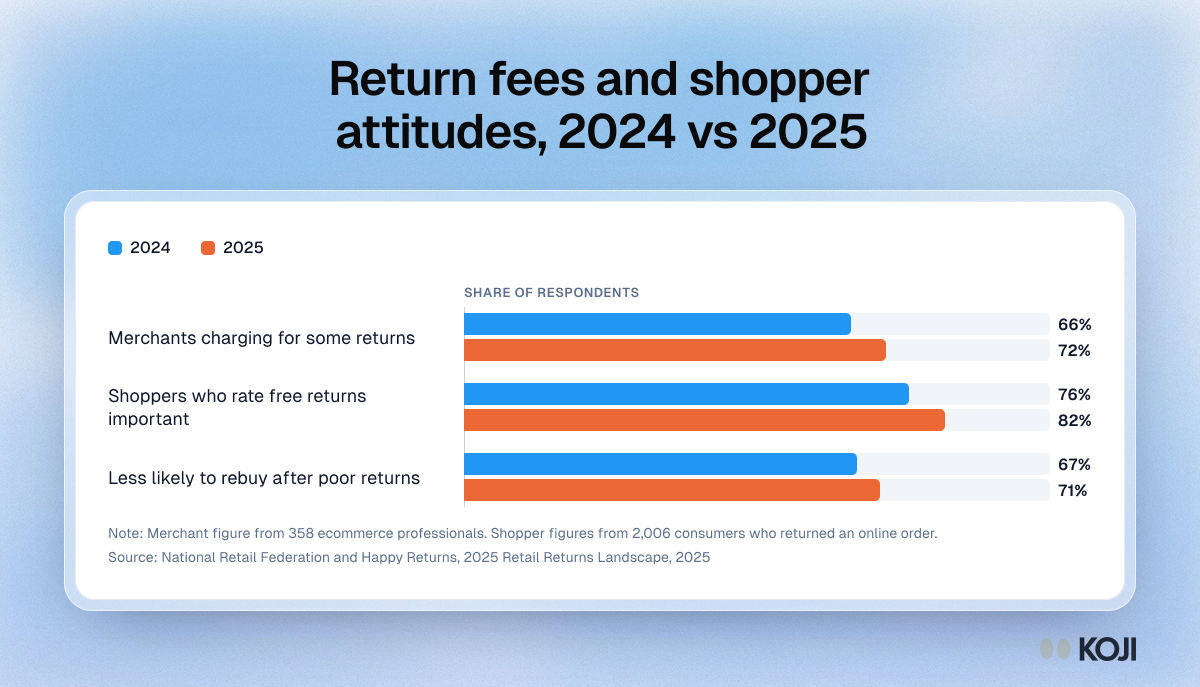
Bar chart of NRF returns data: merchants charging for some returns rose from 66% to 72%, and 82% of shoppers now call free returns important.

Bar chart

Return fees and shopper attitudes, 2024 vs 2025
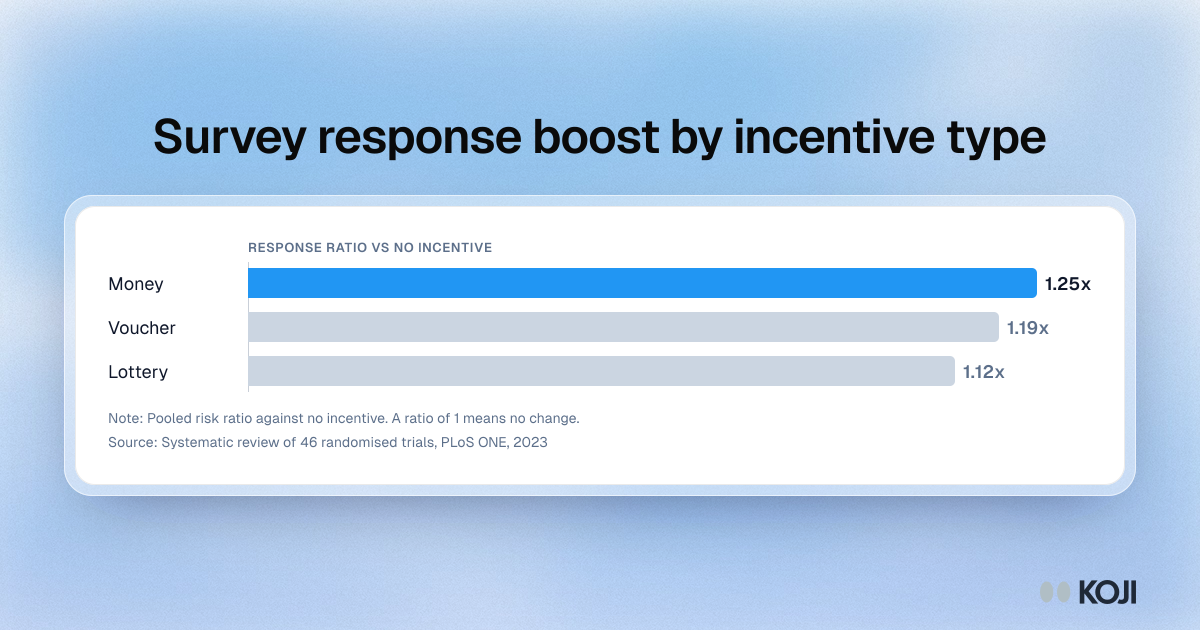
Bar chart of how much three incentive types raise survey response compared with no incentive: money 1.25, voucher 1.19, lottery 1.12.

Bar chart

Survey response boost by incentive type
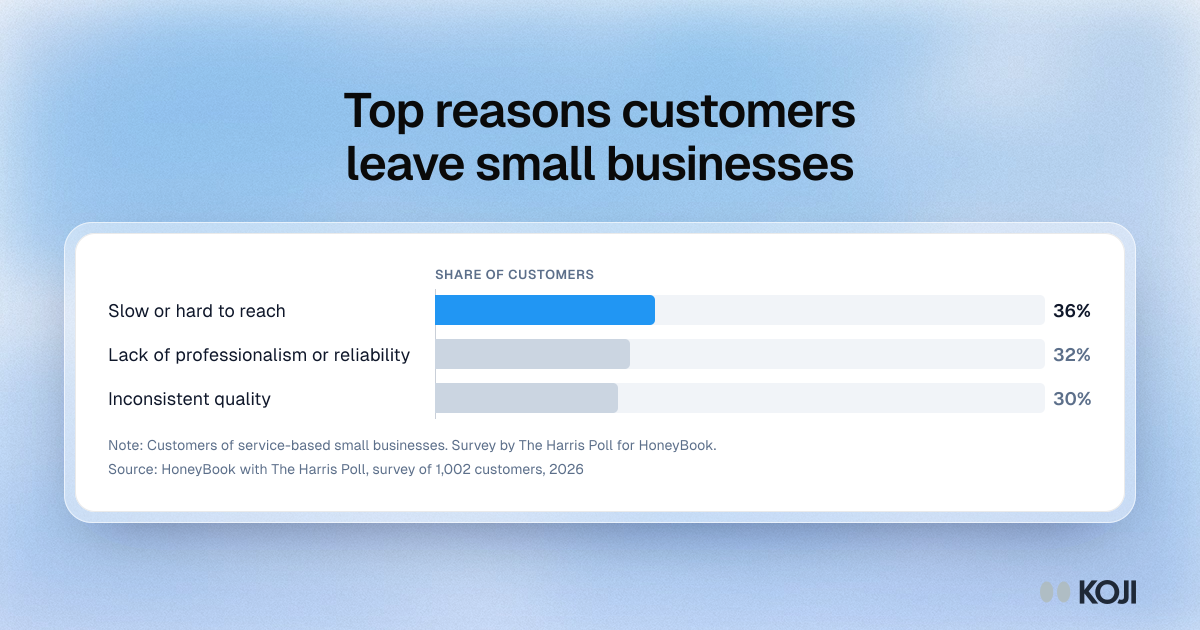
Bar chart of the top reasons customers leave service-based small businesses: slow or hard to reach 36%, lack of professionalism 32%, inconsistent quality 30%.

Bar chart

Top reasons customers leave small businesses
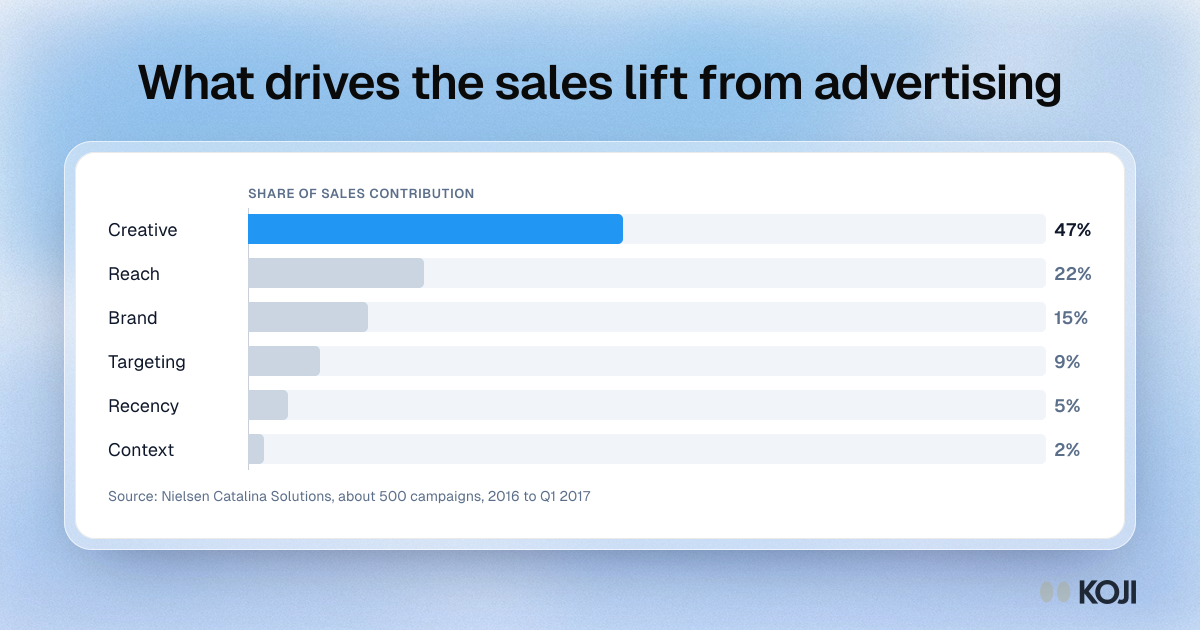
Bar chart of ad sales contribution by factor across about 500 campaigns: creative 47%, reach 22%, brand 15%, targeting 9%, recency 5%, context 2%.

Bar chart

What drives the sales lift from advertising
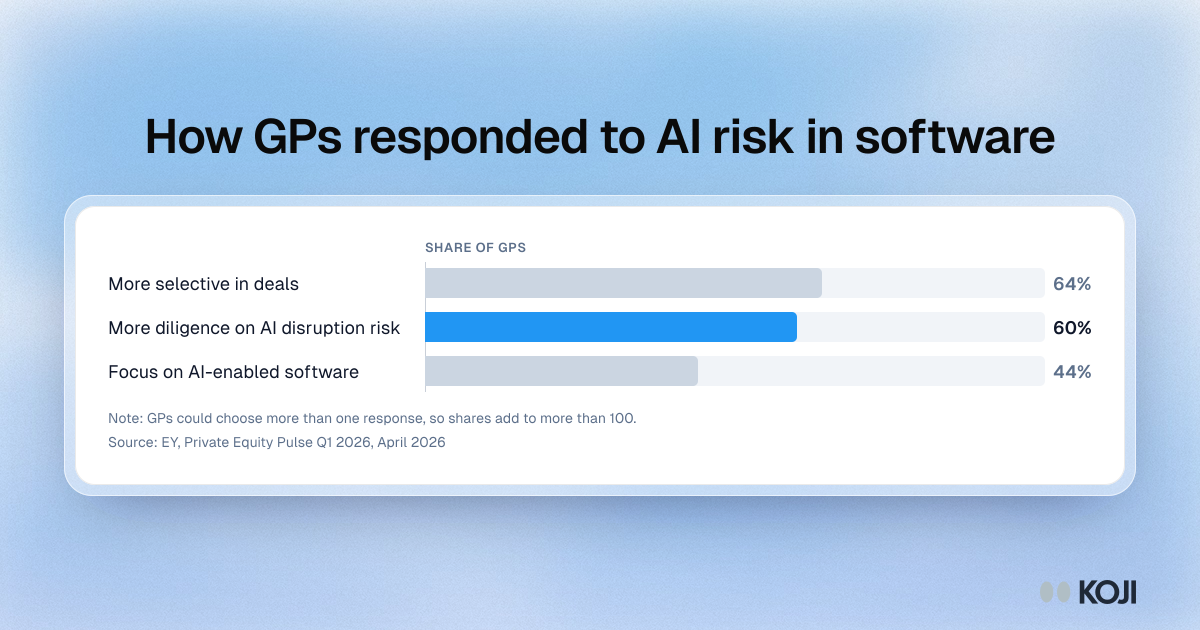
Bar chart of GP responses to AI risk in software: 64% more selective, 60% more diligence on AI disruption risk, 44% focused on AI-enabled software.

Bar chart

How GPs responded to AI risk in software
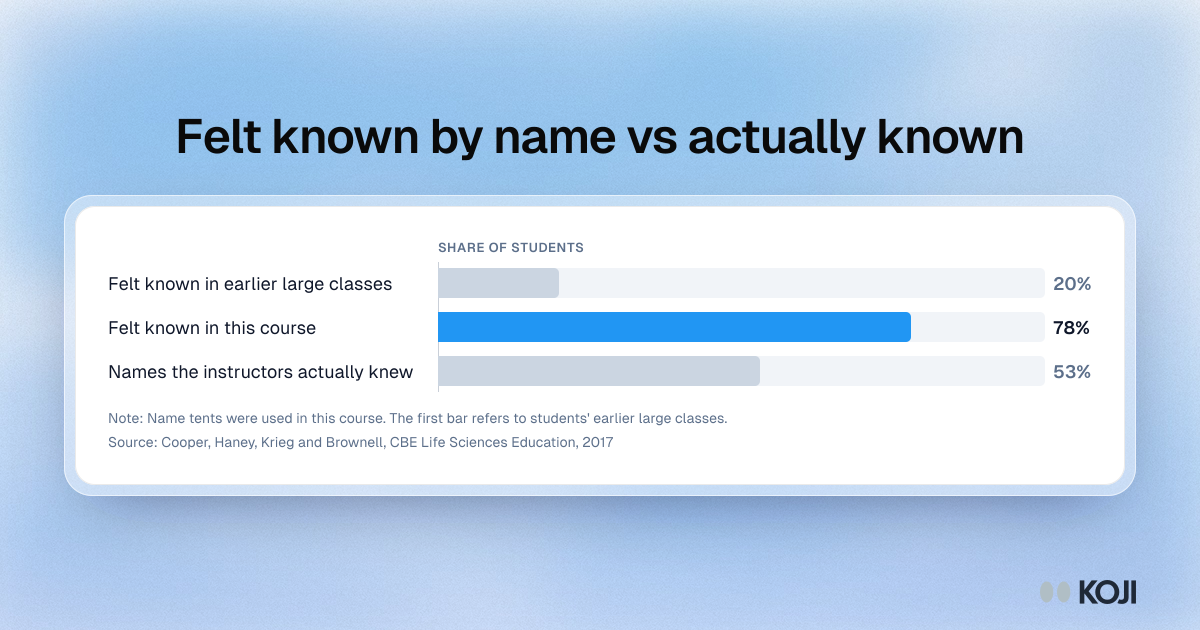
Bar chart: 20% of students felt known by name in earlier large classes, 78% in a course using name tents, though instructors knew 53% of names.

Bar chart

Felt known by name vs actually known
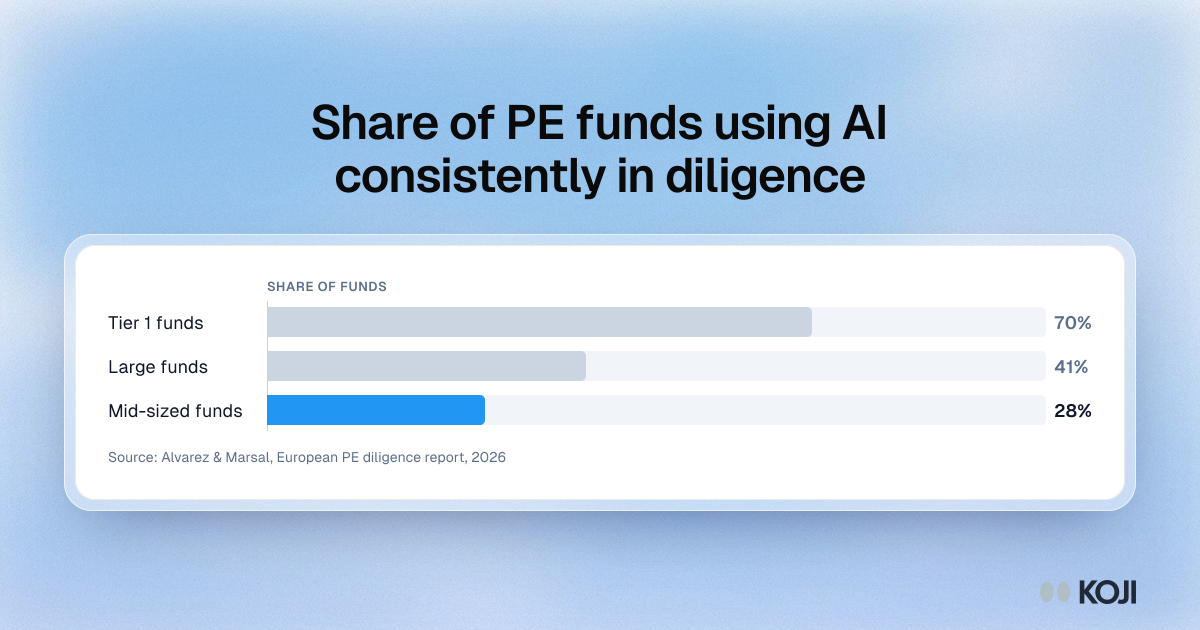
Bar chart of the share of private equity funds using AI consistently in diligence: 70% of Tier 1 funds, 41% of large funds and 28% of mid-sized funds.

Bar chart

Share of PE funds using AI consistently in diligence
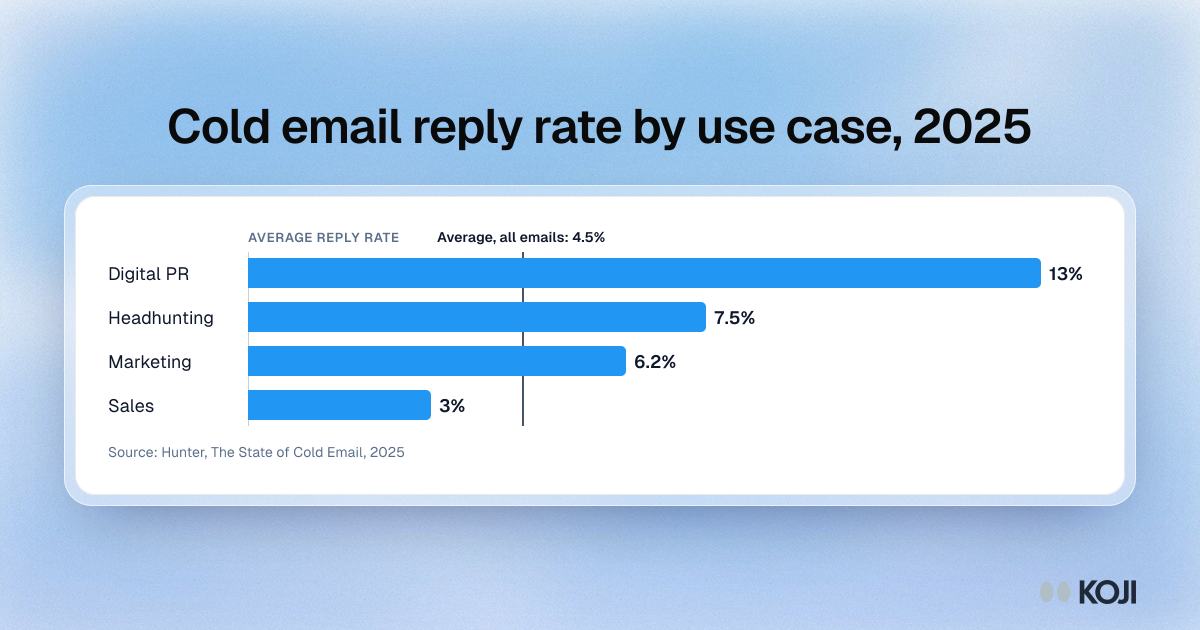
Bar chart of average cold email reply rates by use case in 2025: digital PR 13%, headhunting 7.5%, marketing 6.2% and sales 3%, against a 4.5% average.

Bar chart

Cold email reply rate by use case, 2025
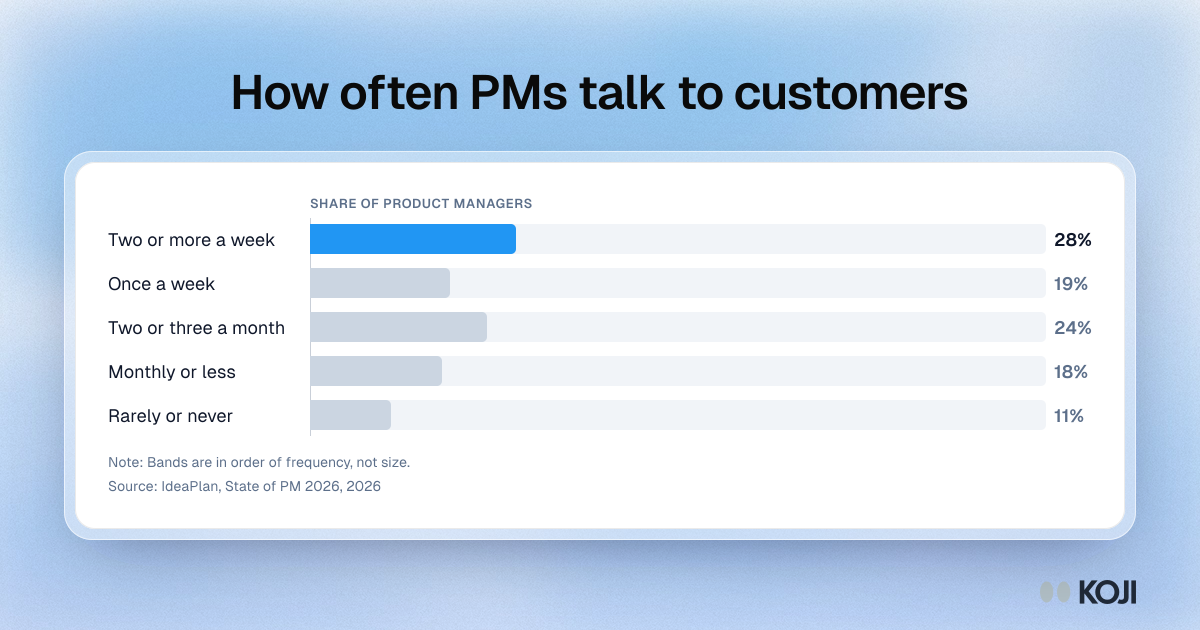
Bar chart of how often PMs talk to customers: 28% twice a week or more, 19% weekly, 24% two or three a month, 18% monthly or less, 11% rarely or never.

Bar chart

How often PMs talk to customers