Free to save and share

Frameworks and cheat sheets for customer research

Every framework, checklist and comparison from our guides, as an image you can download, drop into a deck or share with your team.
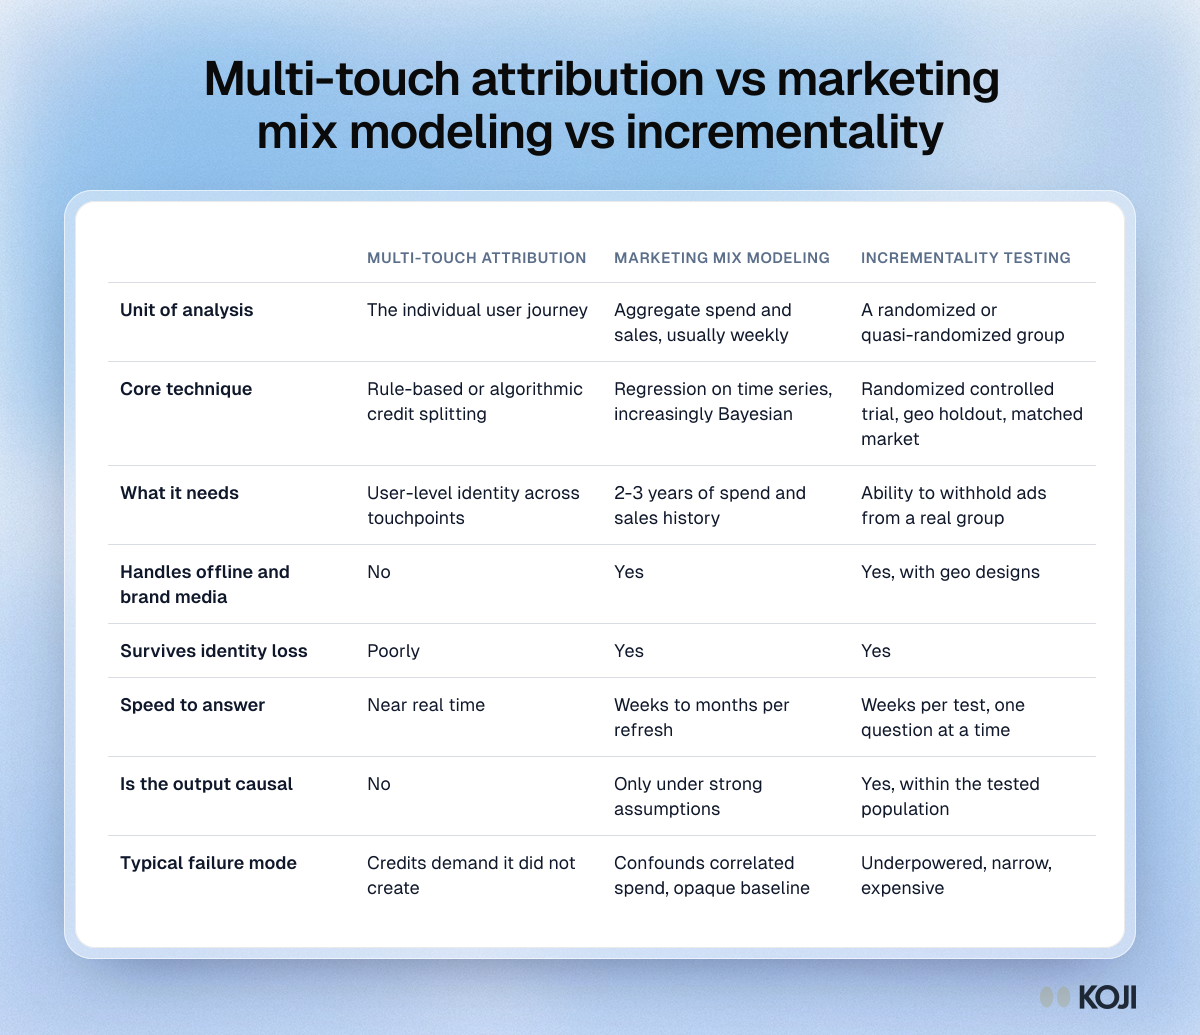
Table comparing multi-touch attribution, marketing mix modeling and incrementality testing on data needs, offline media, identity loss, speed and causality.

Reference table

Multi-touch attribution vs marketing mix modeling vs incrementality
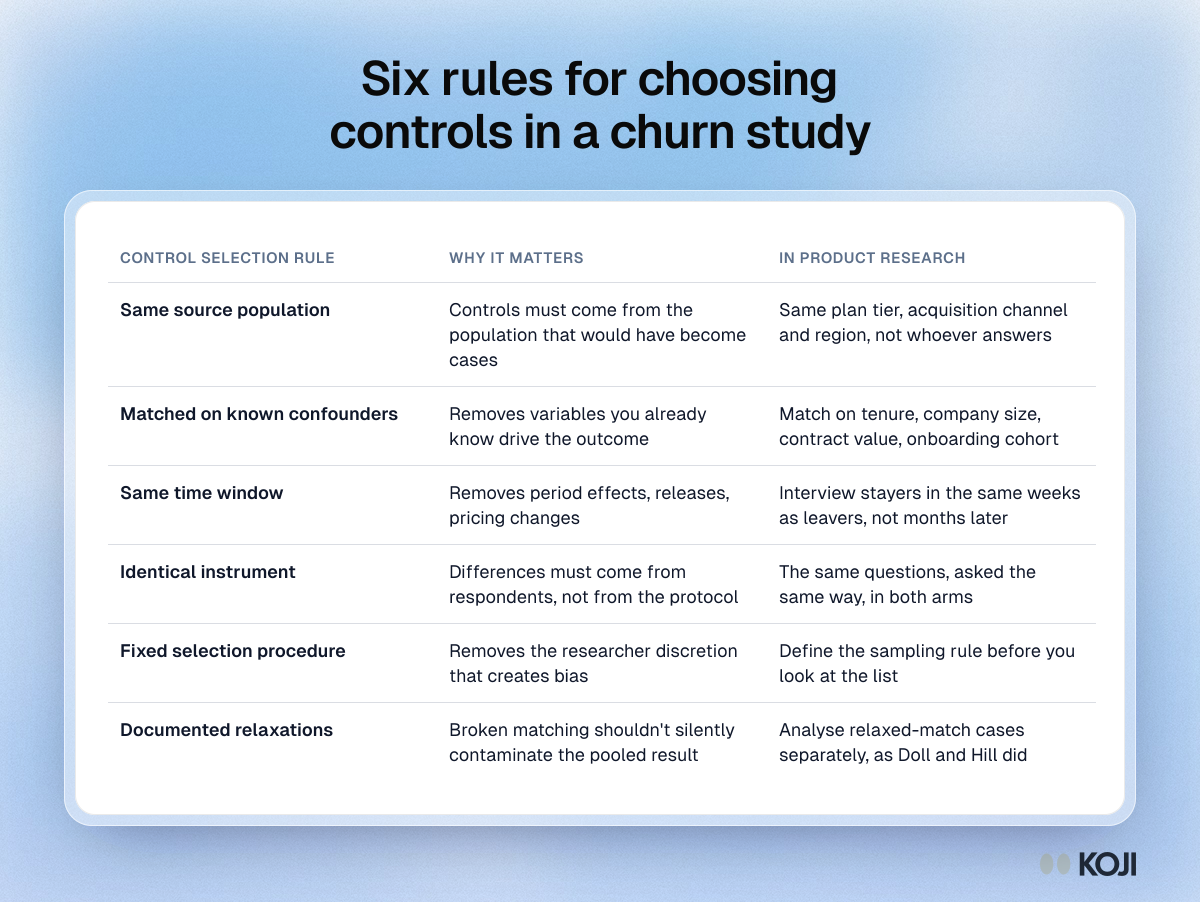
Table of six rules for choosing a control group in churn research, from same source population and matching on tenure to an identical interview instrument.

Reference table

Six rules for choosing controls in a churn study
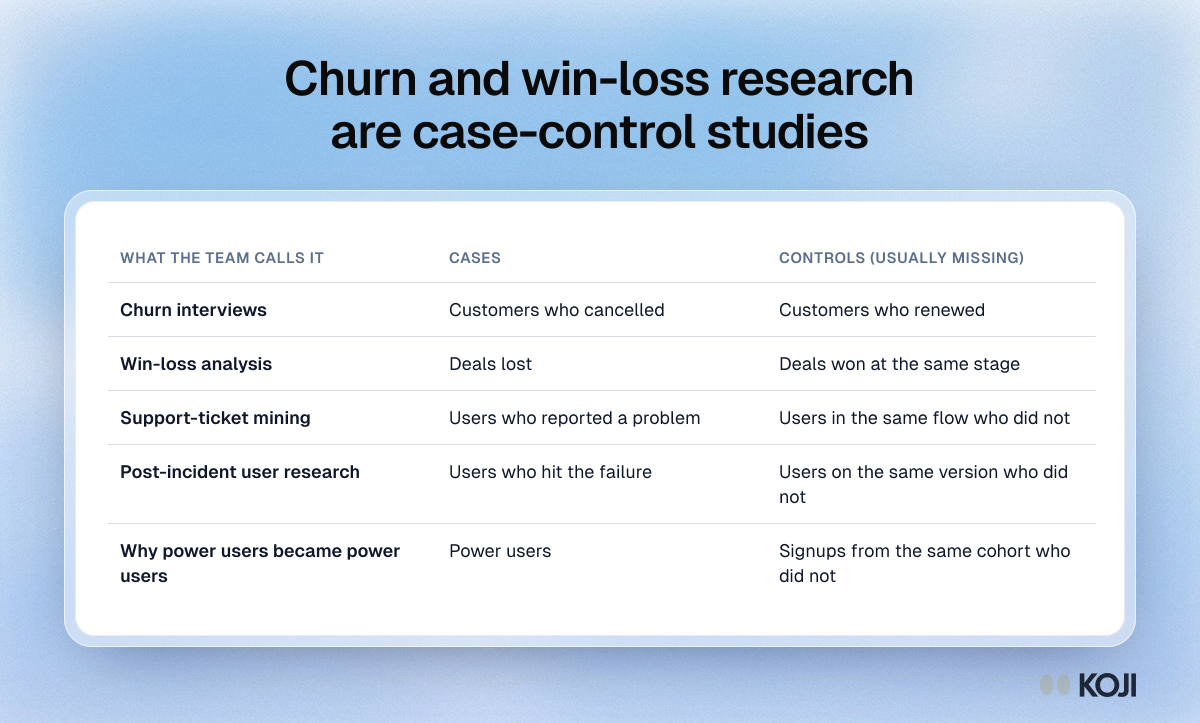
Table of five product research studies as case-control designs, such as churn interviews, with cancelled customers as cases and renewed ones as controls.

Reference table

Churn and win-loss research are case-control studies
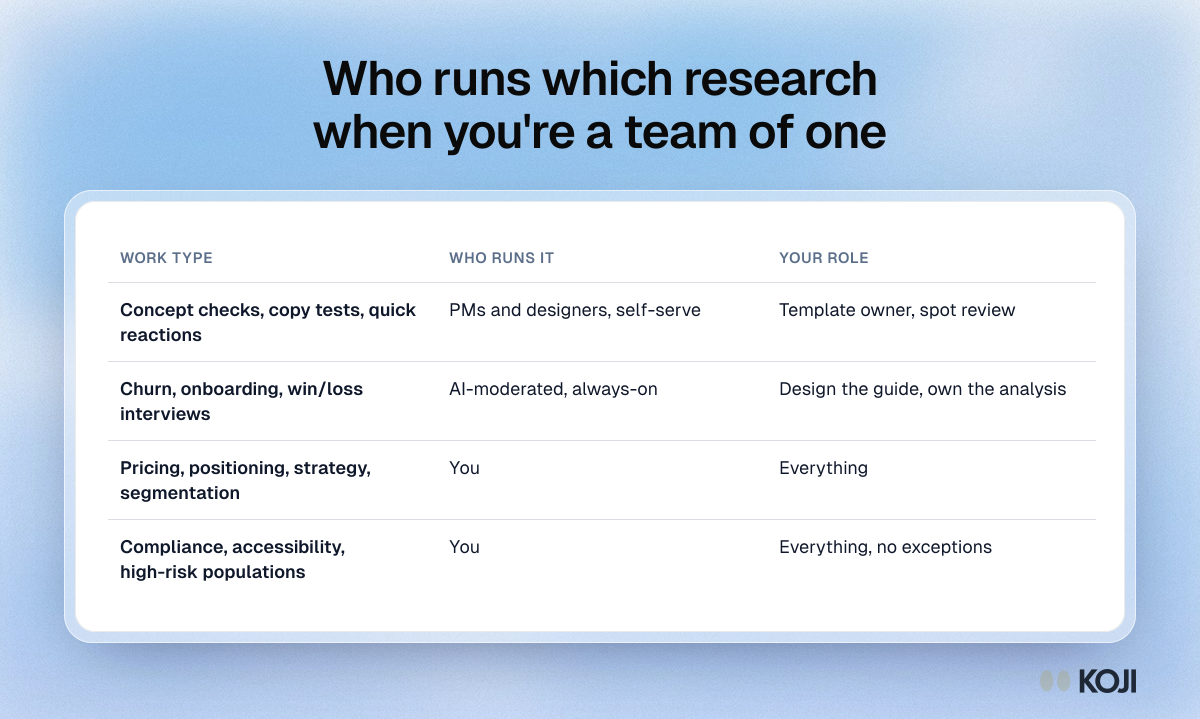
Table for a solo researcher: PMs and designers self-serve quick tests, AI runs always-on churn interviews, and you keep pricing, strategy and high-risk work.

Reference table

Who runs which research when you're a team of one
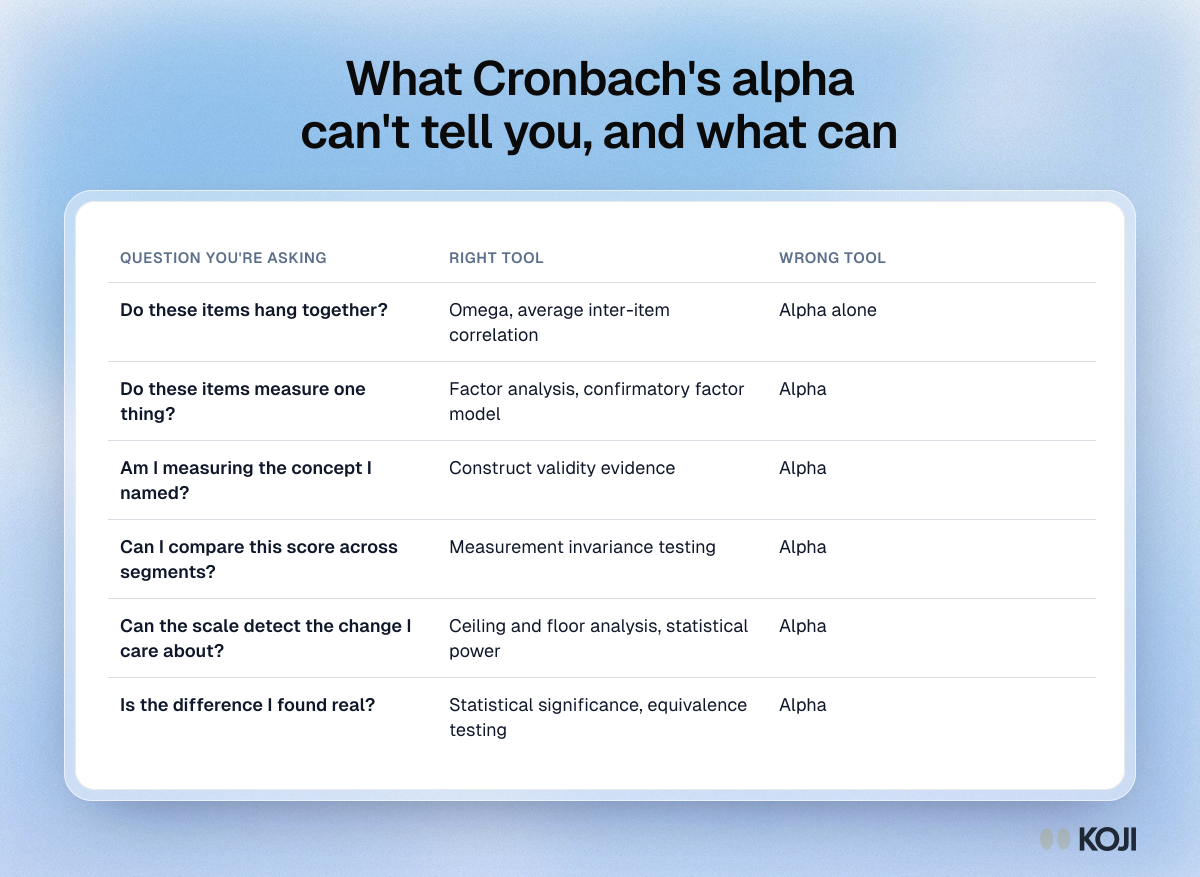
Table matching six questions about a survey scale to the right tool, such as omega, factor analysis or invariance testing, with alpha as the wrong tool.

Reference table

What Cronbach's alpha can't tell you, and what can
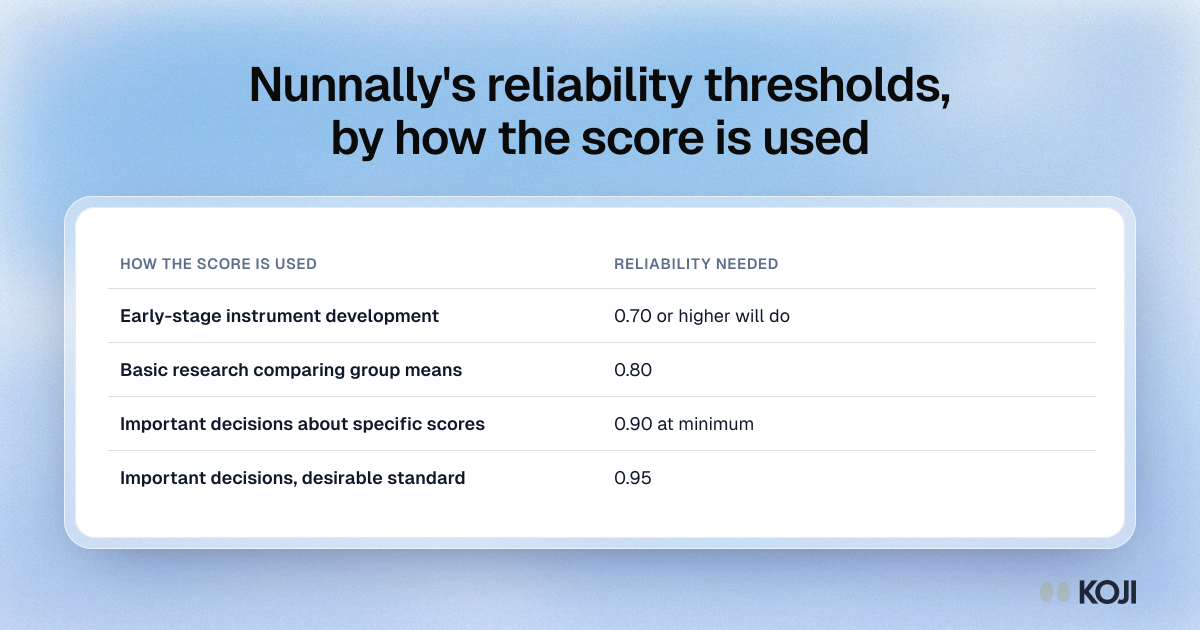
Table of Nunnally's reliability thresholds: 0.70 for early-stage work, 0.80 for basic research, 0.90 minimum and 0.95 desirable when decisions rest on scores.

Reference table

Nunnally's reliability thresholds, by how the score is used
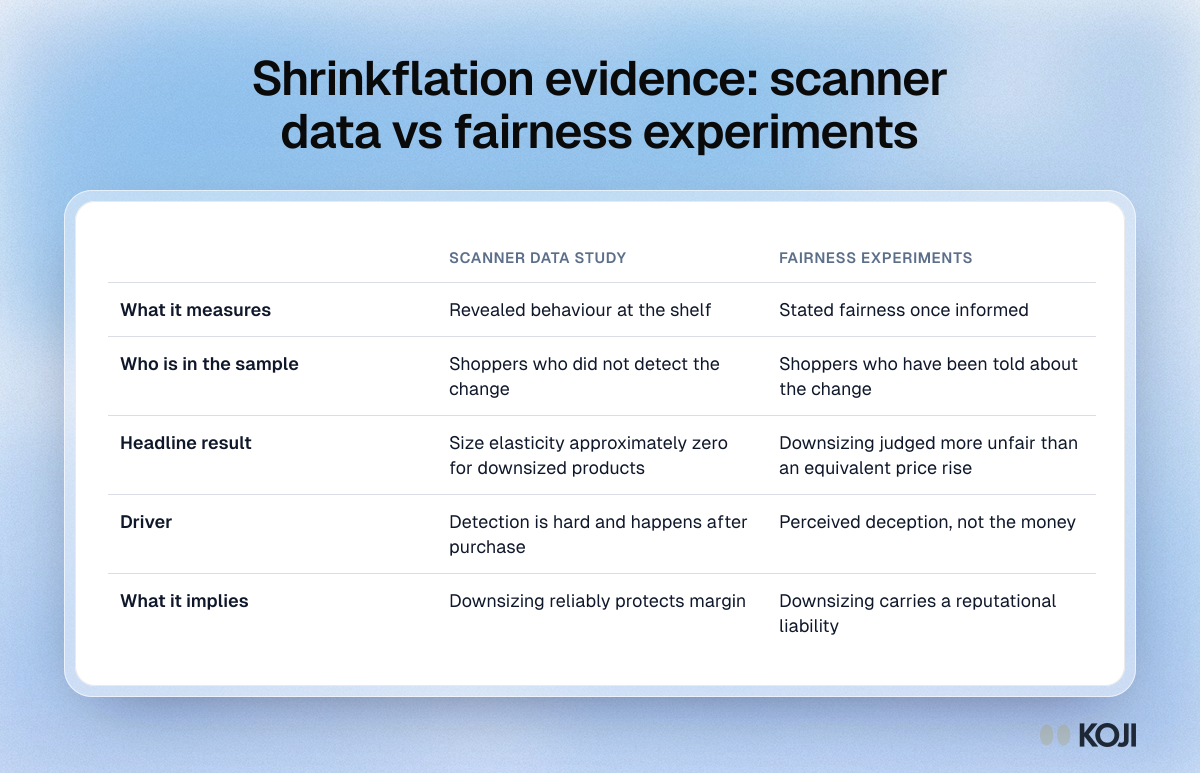
Table comparing shrinkflation evidence: scanner data shows shoppers who didn't notice barely react, while experiments show informed shoppers call it unfair.

Reference table

Shrinkflation evidence: scanner data vs fairness experiments
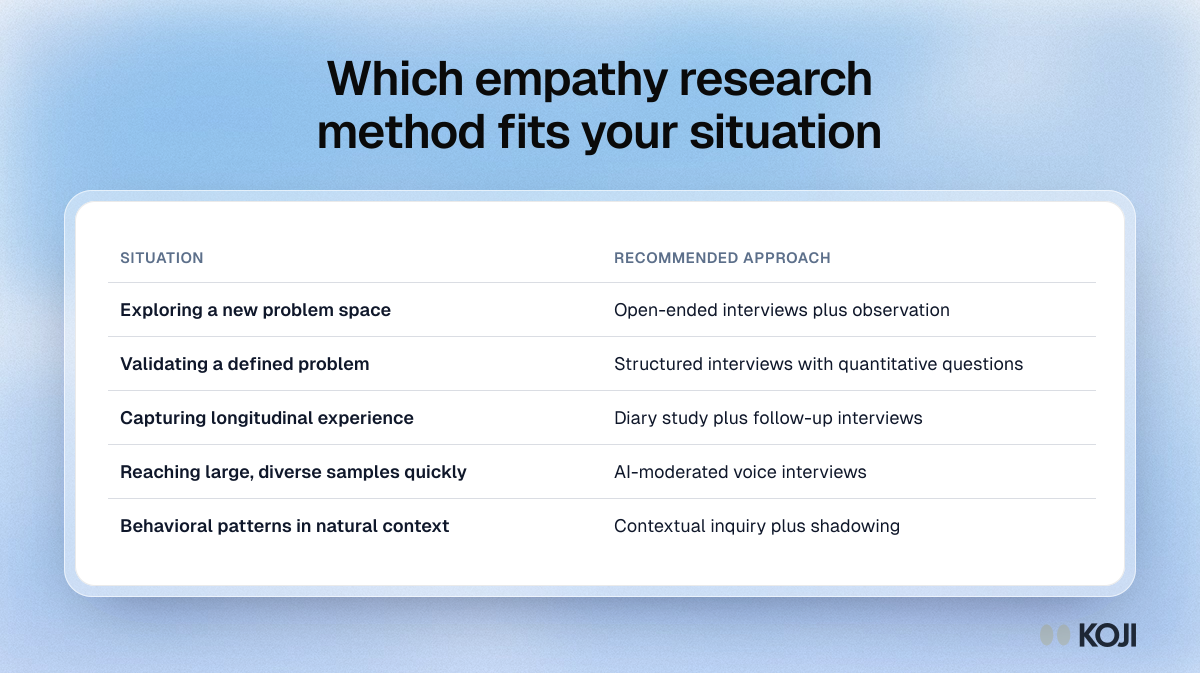
Table matching five empathy research situations to methods, from open-ended interviews and observation to diary studies, AI voice interviews and shadowing.

Reference table

Which empathy research method fits your situation
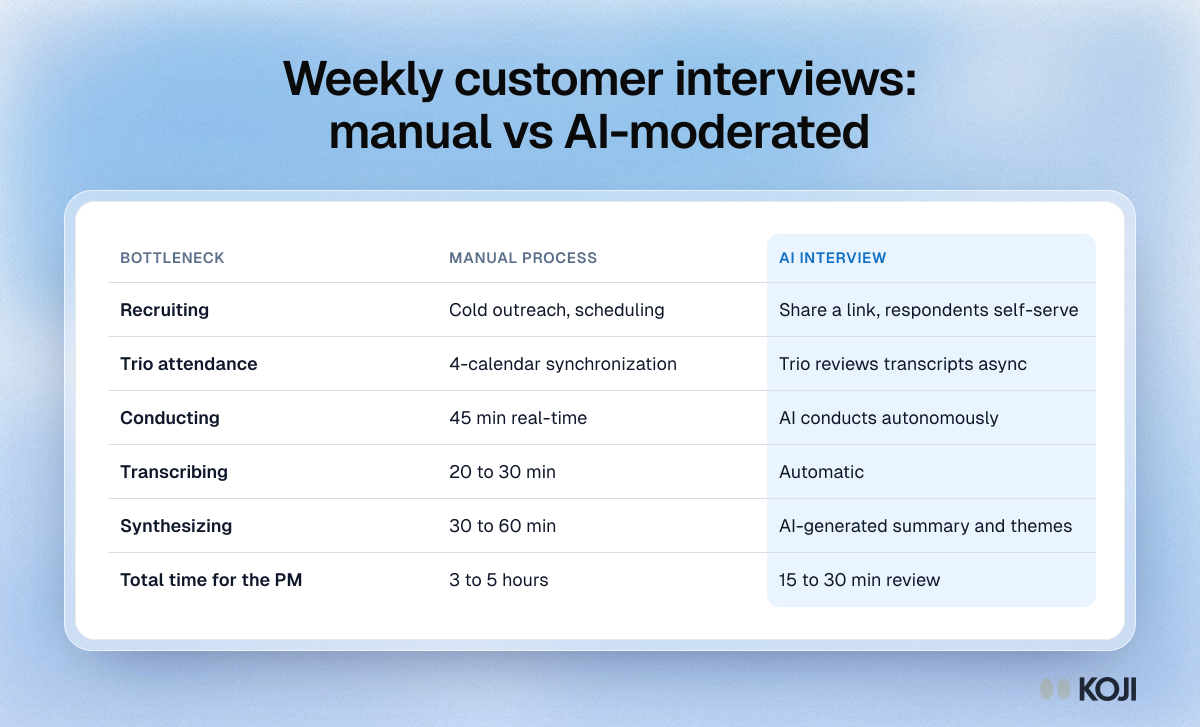
Table comparing manual and AI-moderated weekly interviews from recruiting to synthesis: 3 to 5 hours of PM time against 15 to 30 minutes of review

Reference table

Weekly customer interviews: manual vs AI-moderated
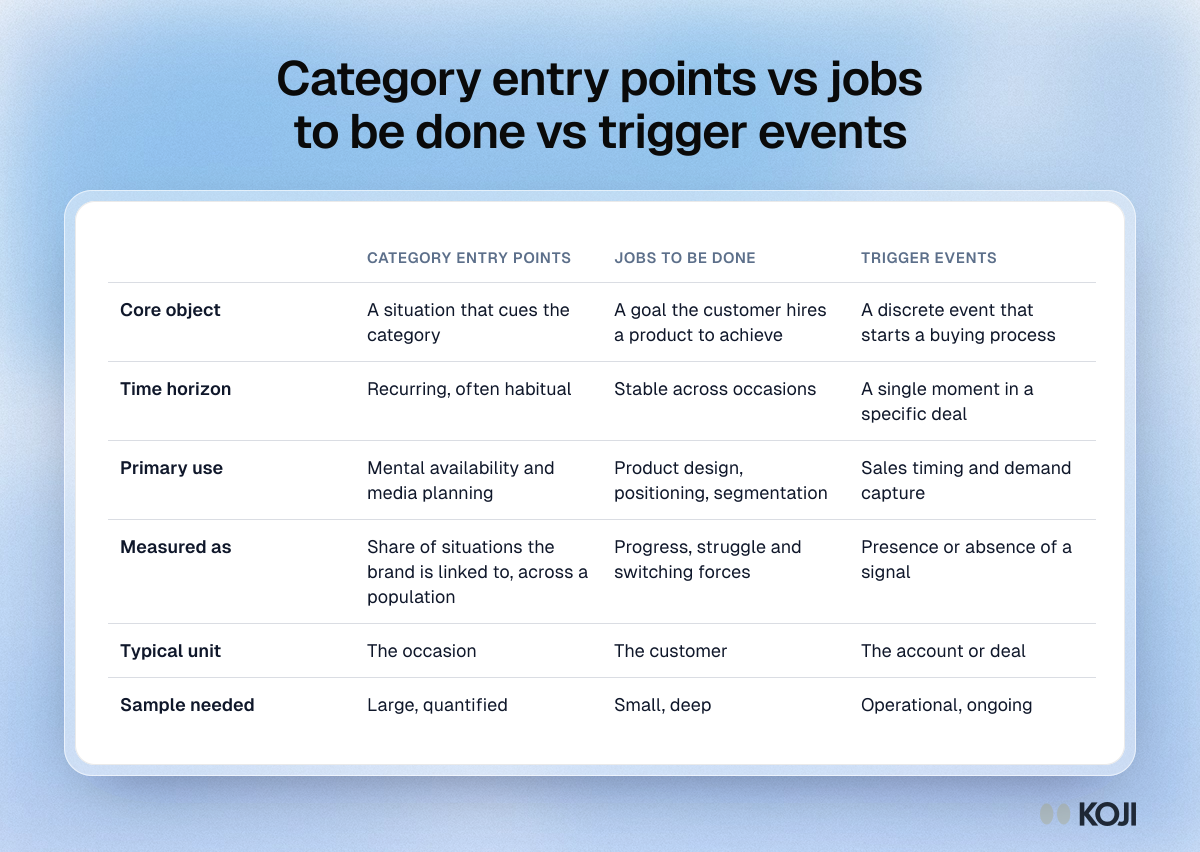
Table comparing category entry points, jobs to be done and trigger events by core object, time horizon, use, measure, unit and sample needed

Reference table

Category entry points vs jobs to be done vs trigger events
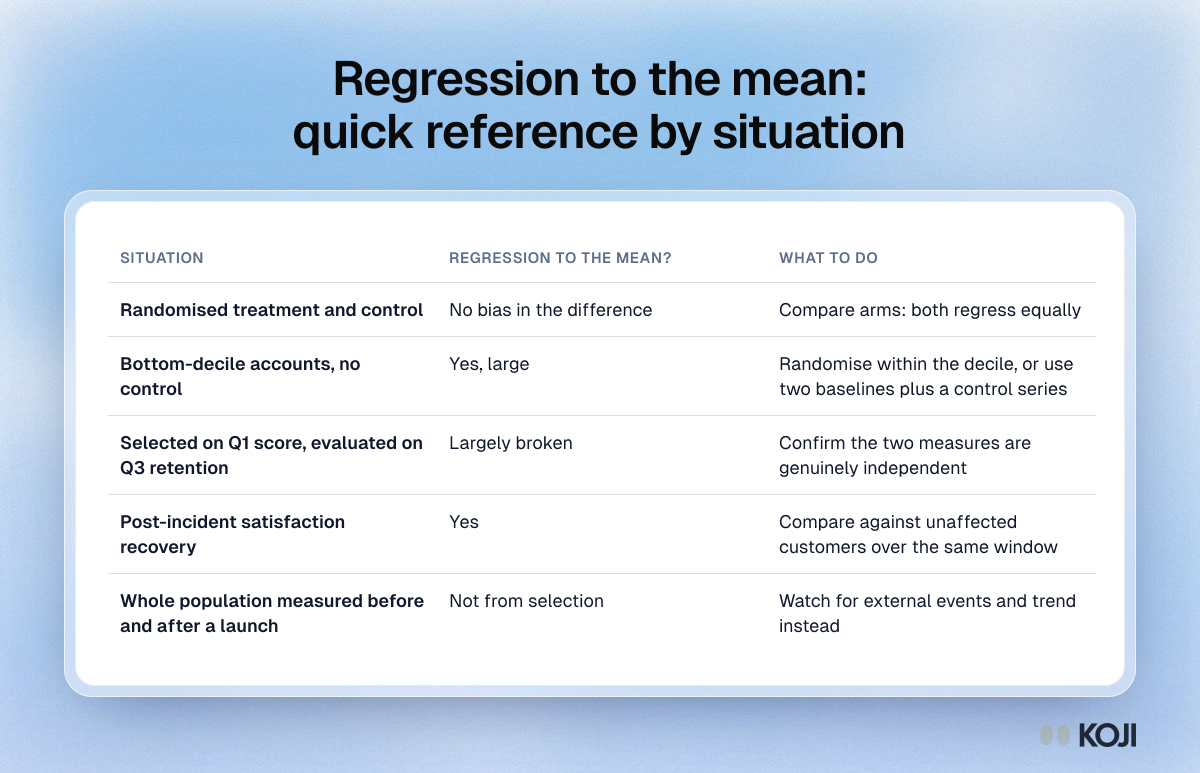
Table of five research situations, whether regression to the mean is present in each, and what to do, from randomised tests to bottom-decile rescues

Reference table

Regression to the mean: quick reference by situation
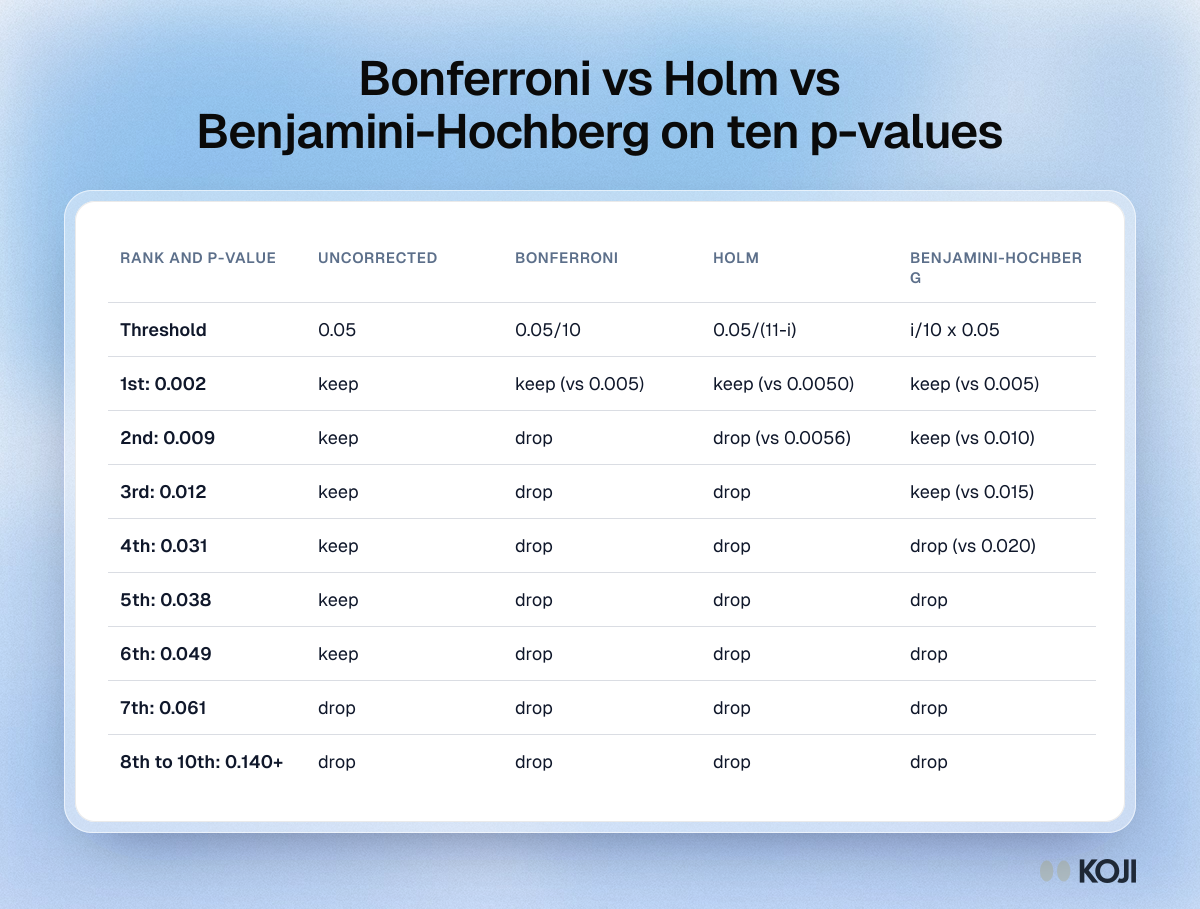
Table applying no correction, Bonferroni, Holm and Benjamini-Hochberg to ten sorted p-values: six kept uncorrected, one by Bonferroni and Holm, three by BH

Reference table

Bonferroni vs Holm vs Benjamini-Hochberg on ten p-values
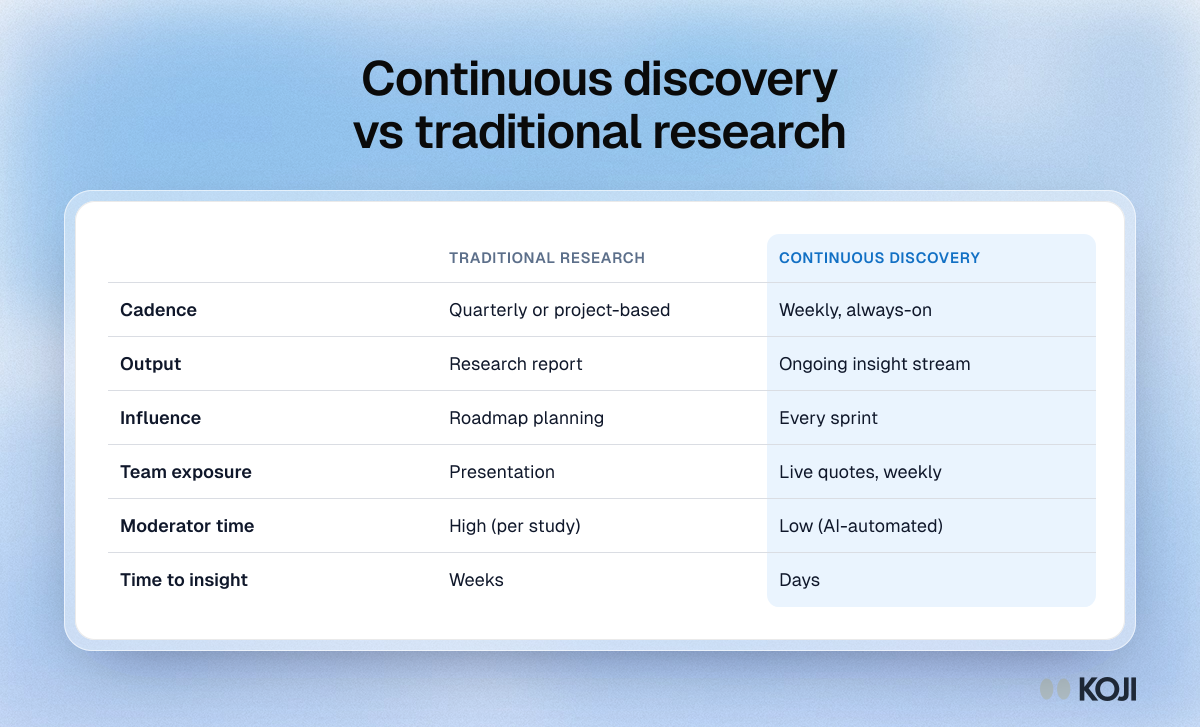
Table comparing traditional research and continuous discovery on cadence, output, influence, team exposure, moderator time and time to insight

Reference table

Continuous discovery vs traditional research
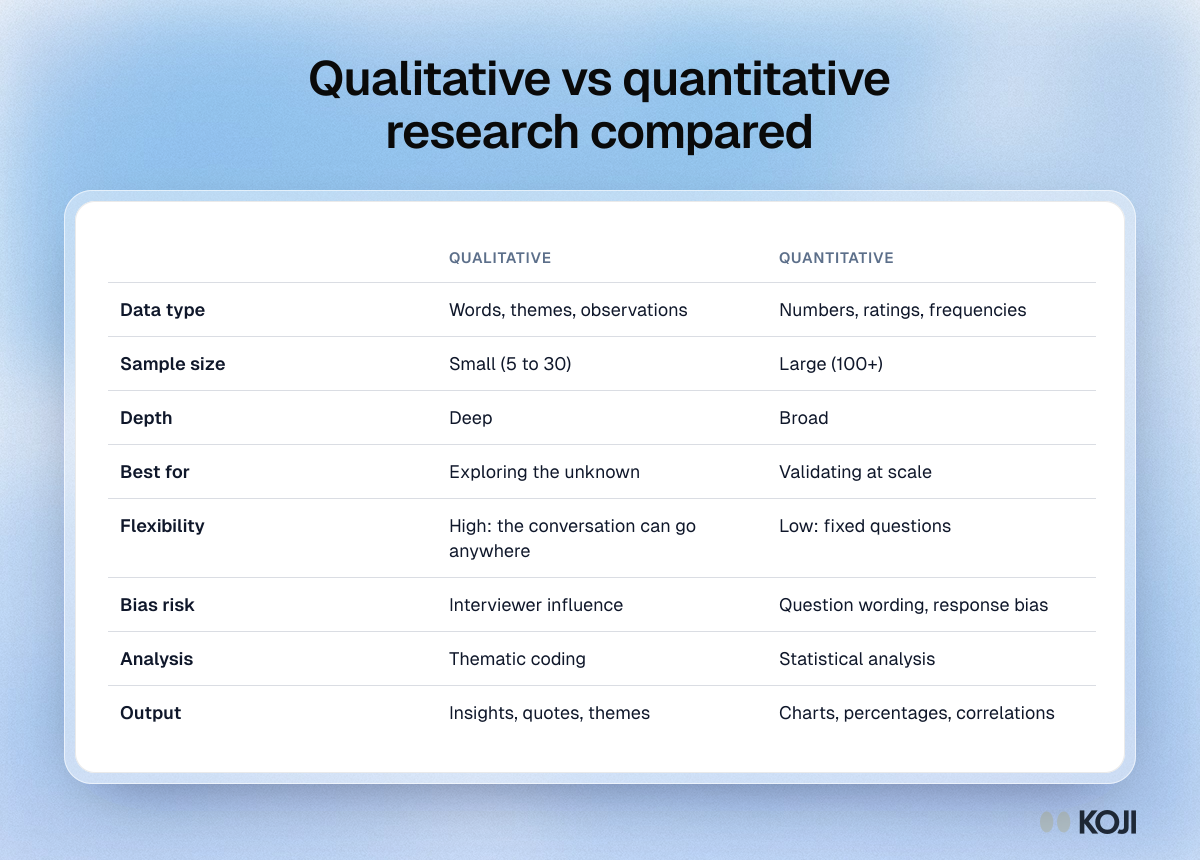
Table comparing qualitative and quantitative research on data type, sample size, depth, best use, flexibility, bias risk, analysis and output

Reference table

Qualitative vs quantitative research compared
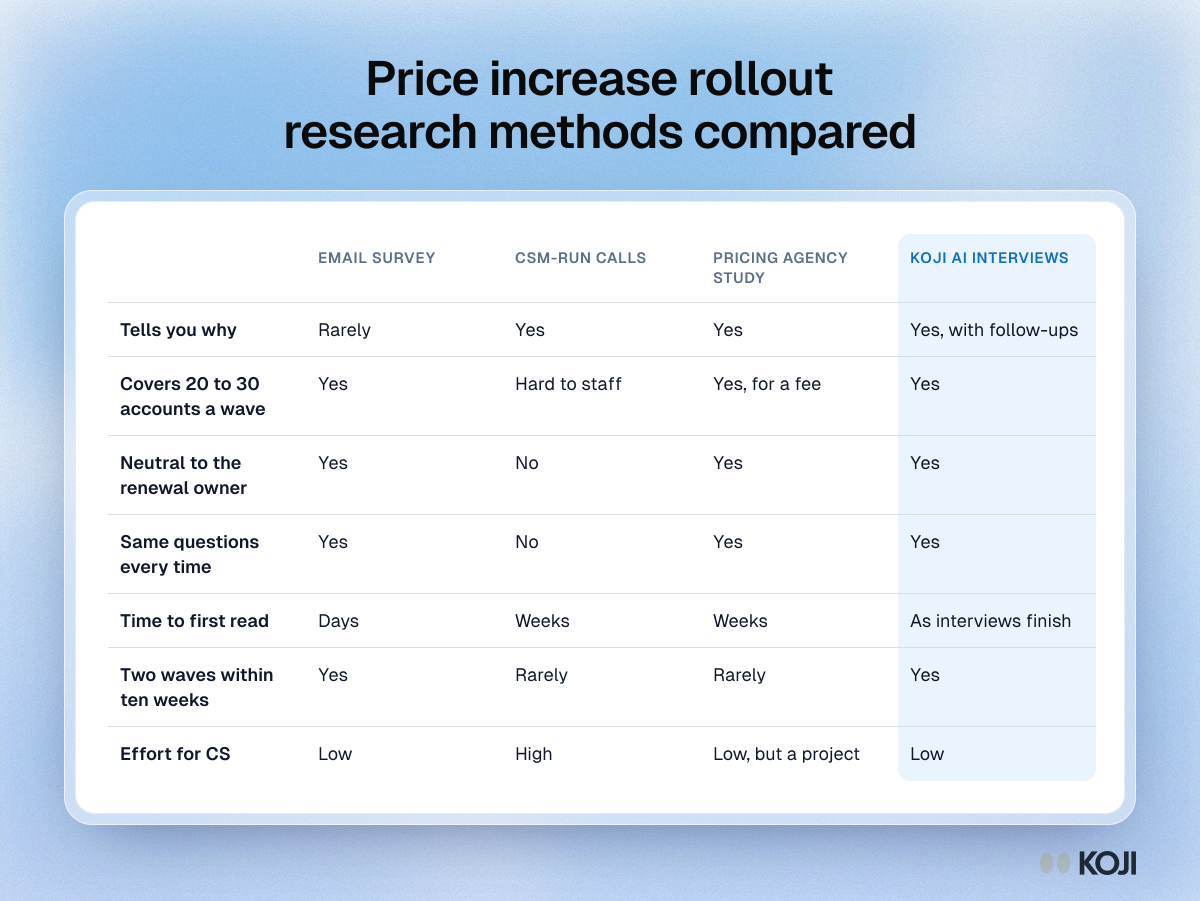
Table comparing an email survey, CSM-run calls, a pricing agency study and Koji AI interviews on depth, coverage, neutrality, speed and effort.

Reference table

Price increase rollout research methods compared
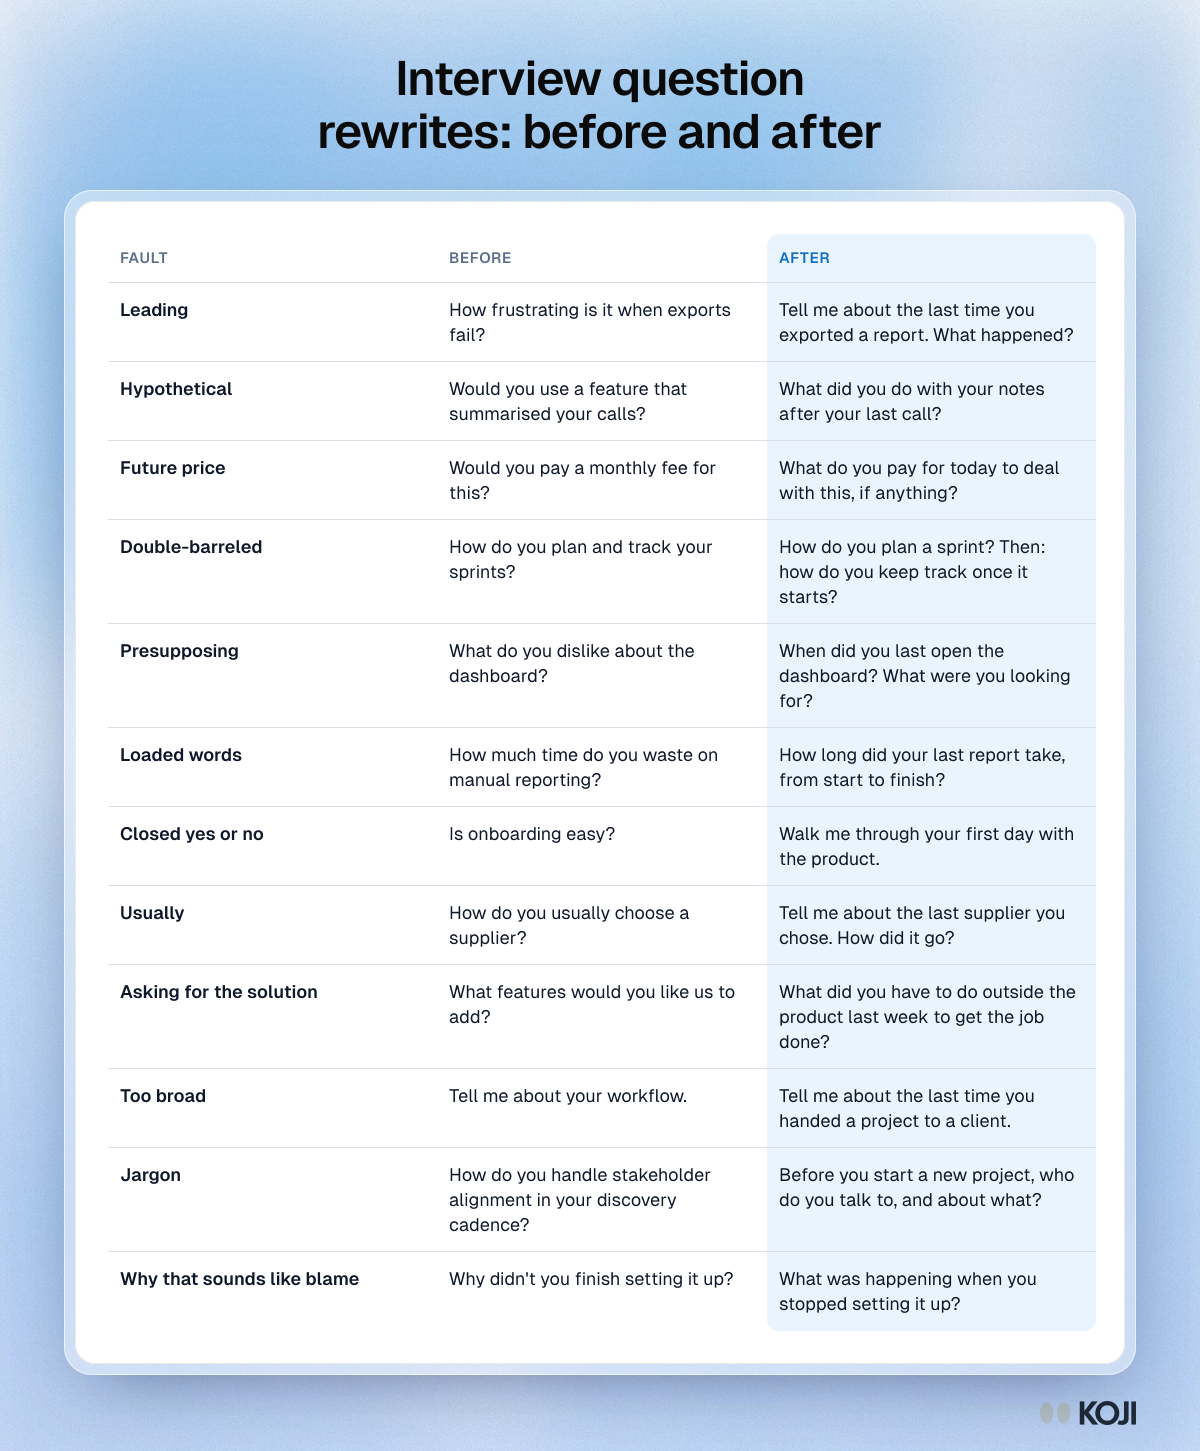
Table of twelve interview question rewrites: the fault, the original question and a better version for each, from leading and hypothetical to too broad.

Reference table

Interview question rewrites: before and after
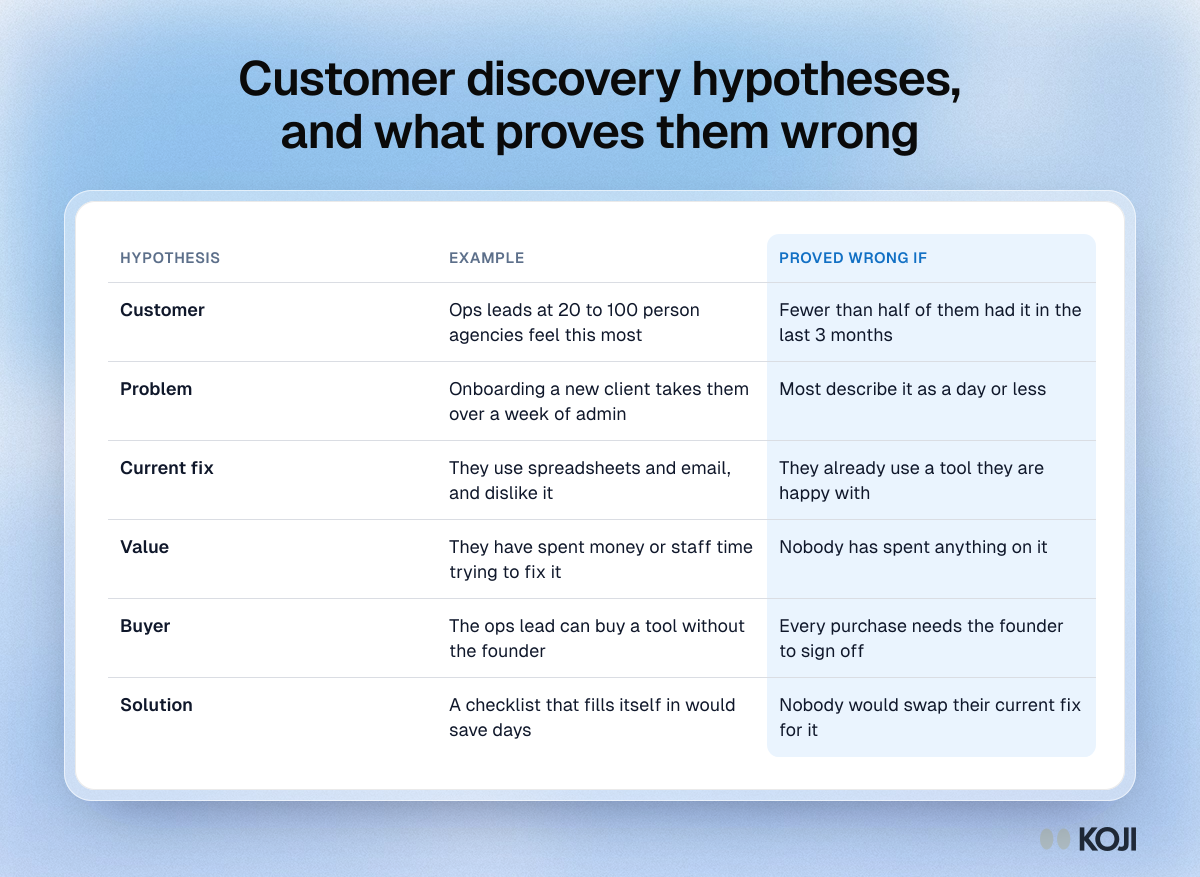
Table of six customer discovery hypotheses: customer, problem, current fix, value, buyer and solution, each with an example and what would prove it wrong.

Reference table

Customer discovery hypotheses, and what proves them wrong
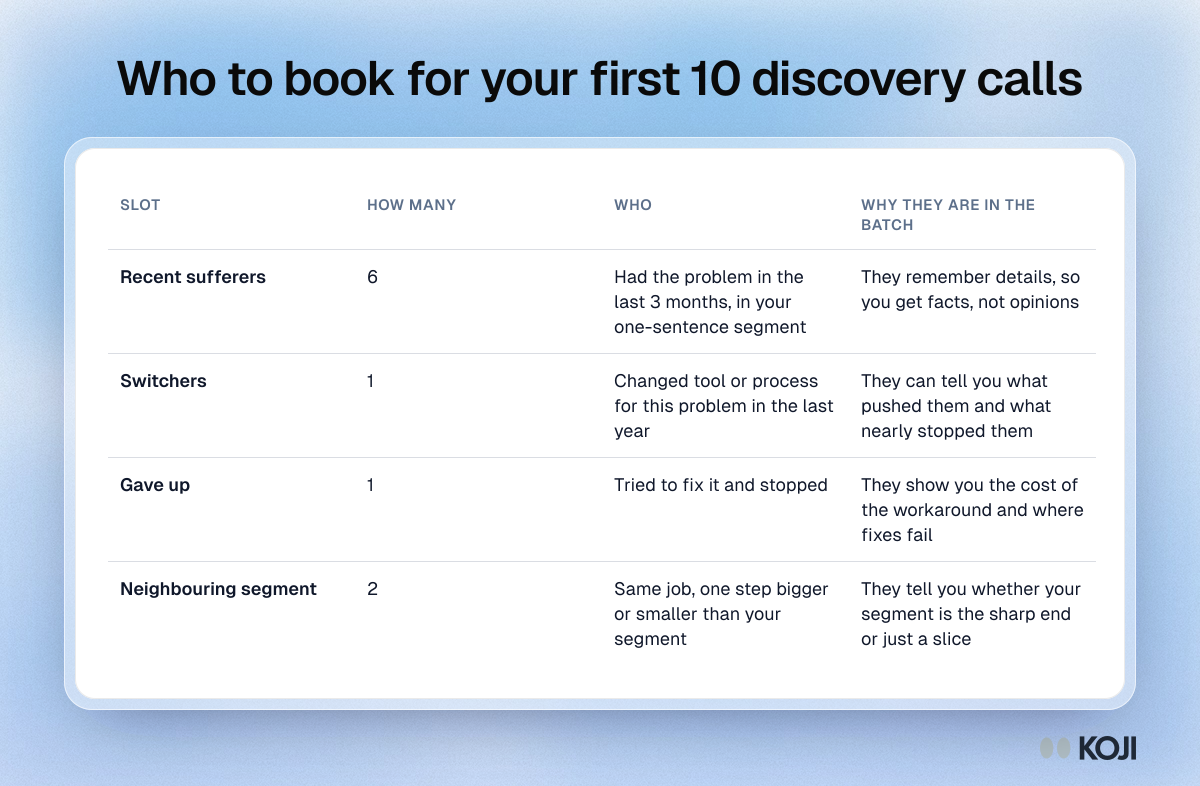
Table of the first ten discovery calls: six recent sufferers, one switcher, one who gave up and two from a neighbouring segment, with why each is there.

Reference table

Who to book for your first 10 discovery calls
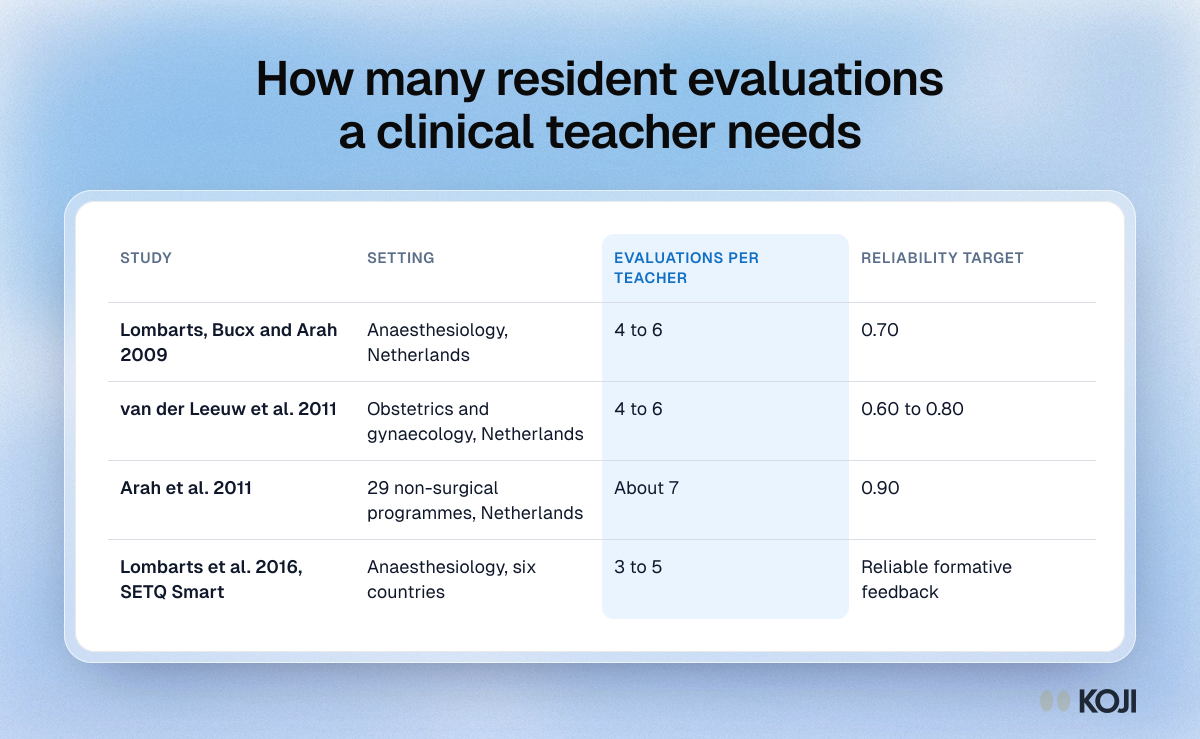
Table comparing four SETQ studies: how many resident evaluations each clinical teacher needs, from 3 to 5 up to about 7, and the reliability targeted.

Reference table

How many resident evaluations a clinical teacher needs
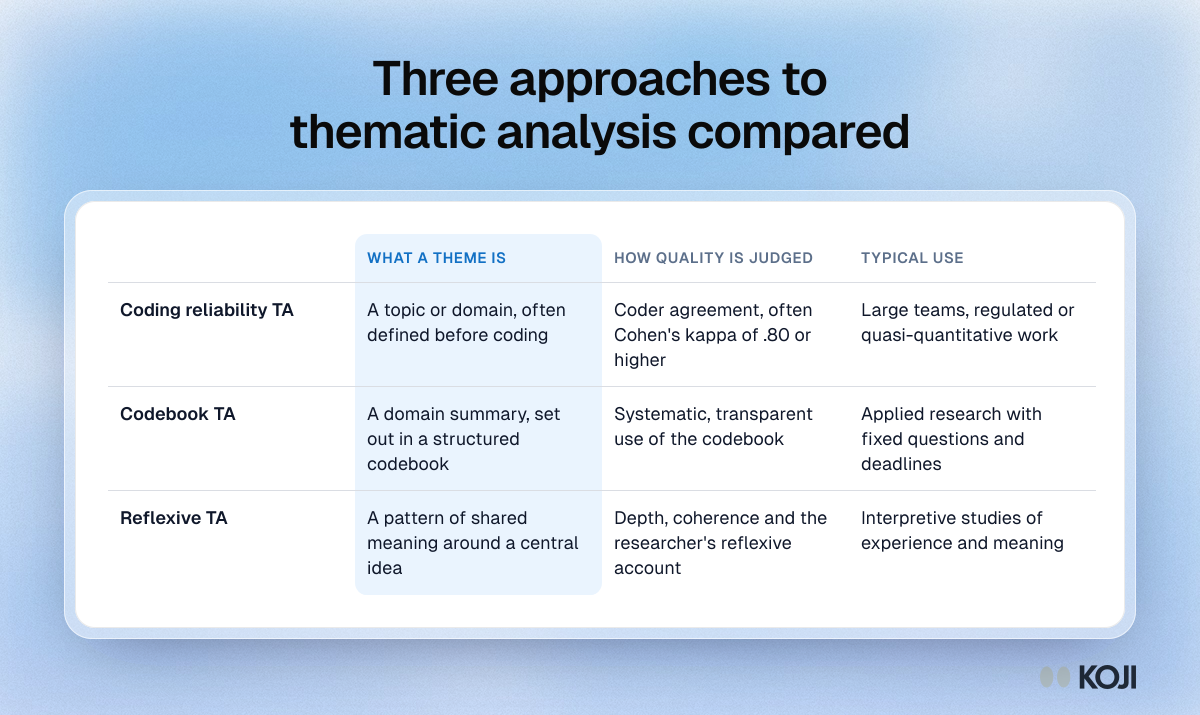
Table comparing coding reliability, codebook and reflexive thematic analysis on what a theme is, how quality is judged and typical use.

Reference table

Three approaches to thematic analysis compared
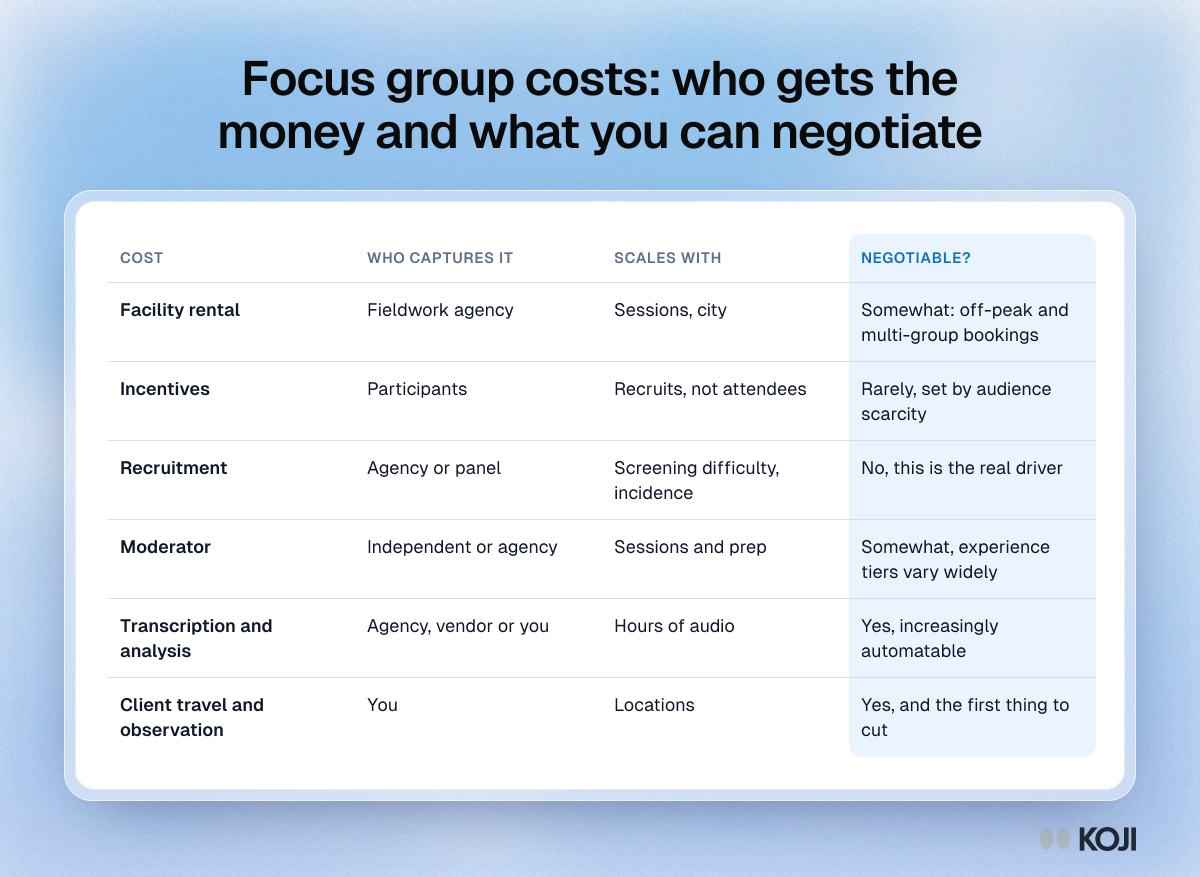
Table of six focus group cost items, from facility rental and incentives to client travel, with who captures each, what it scales with and if it is negotiable.

Reference table

Focus group costs: who gets the money and what you can negotiate
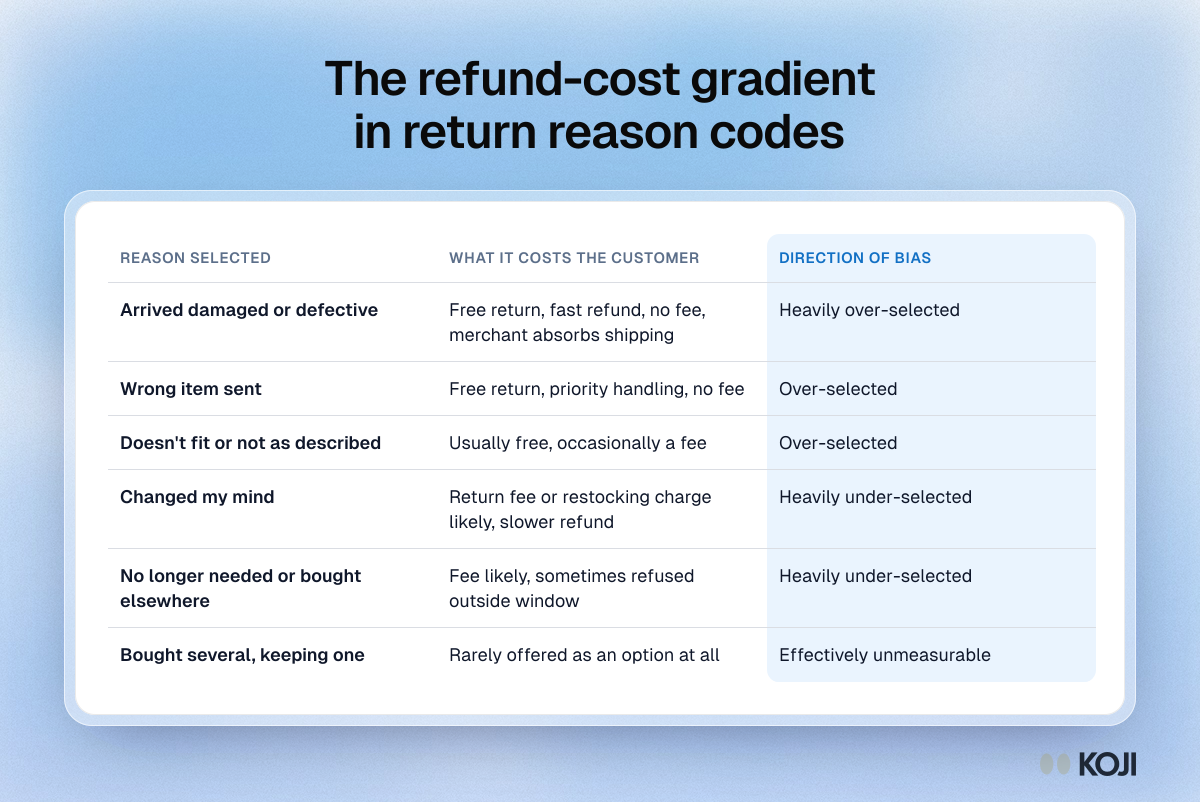
Table of six return reasons, what each costs the customer to select, and whether it ends up over or under-selected, from arrived damaged to changed my mind.

Reference table

The refund-cost gradient in return reason codes
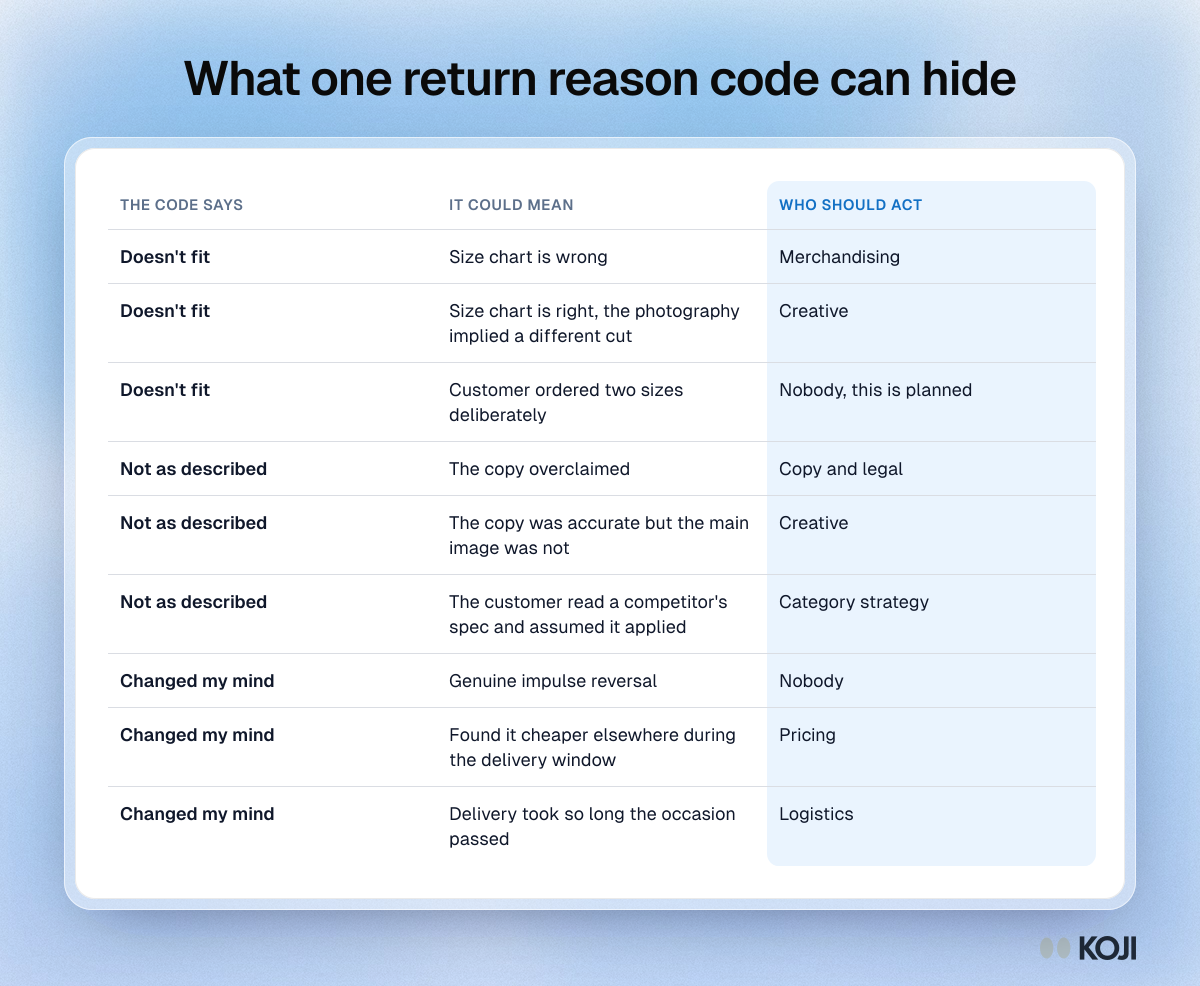
Table showing how three return reason codes hide nine different causes, such as a wrong size chart or misleading photos, each owned by a different team.

Reference table

What one return reason code can hide
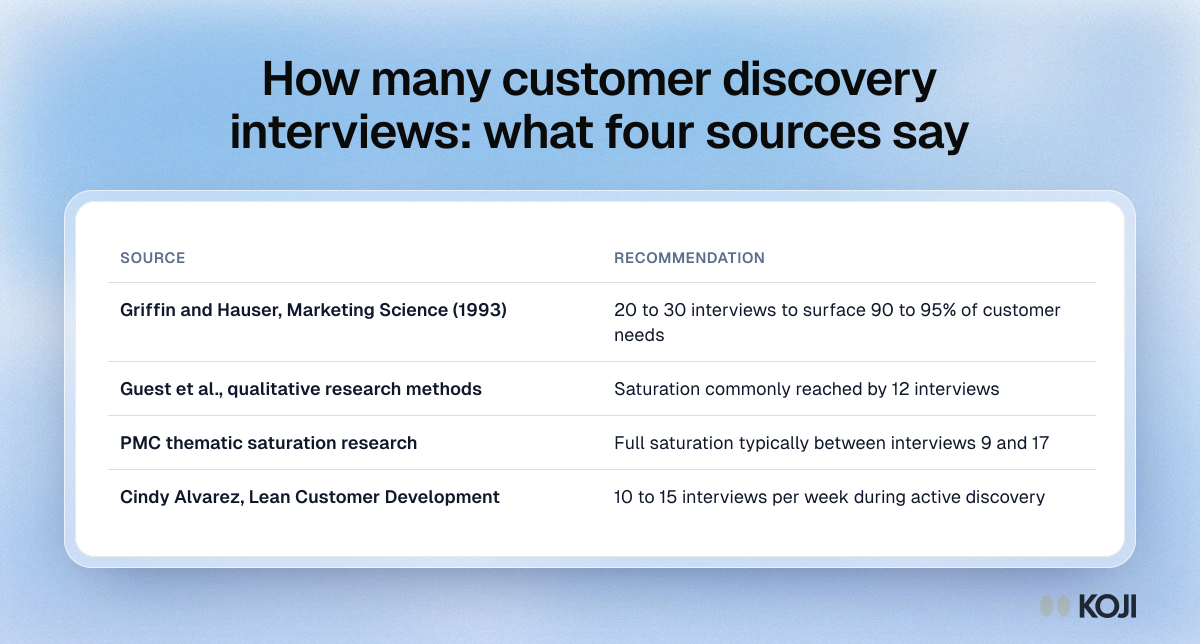
Table of four sources on how many customer discovery interviews you need, from saturation by 12 interviews to 20 to 30 to surface most customer needs.

Reference table

How many customer discovery interviews: what four sources say
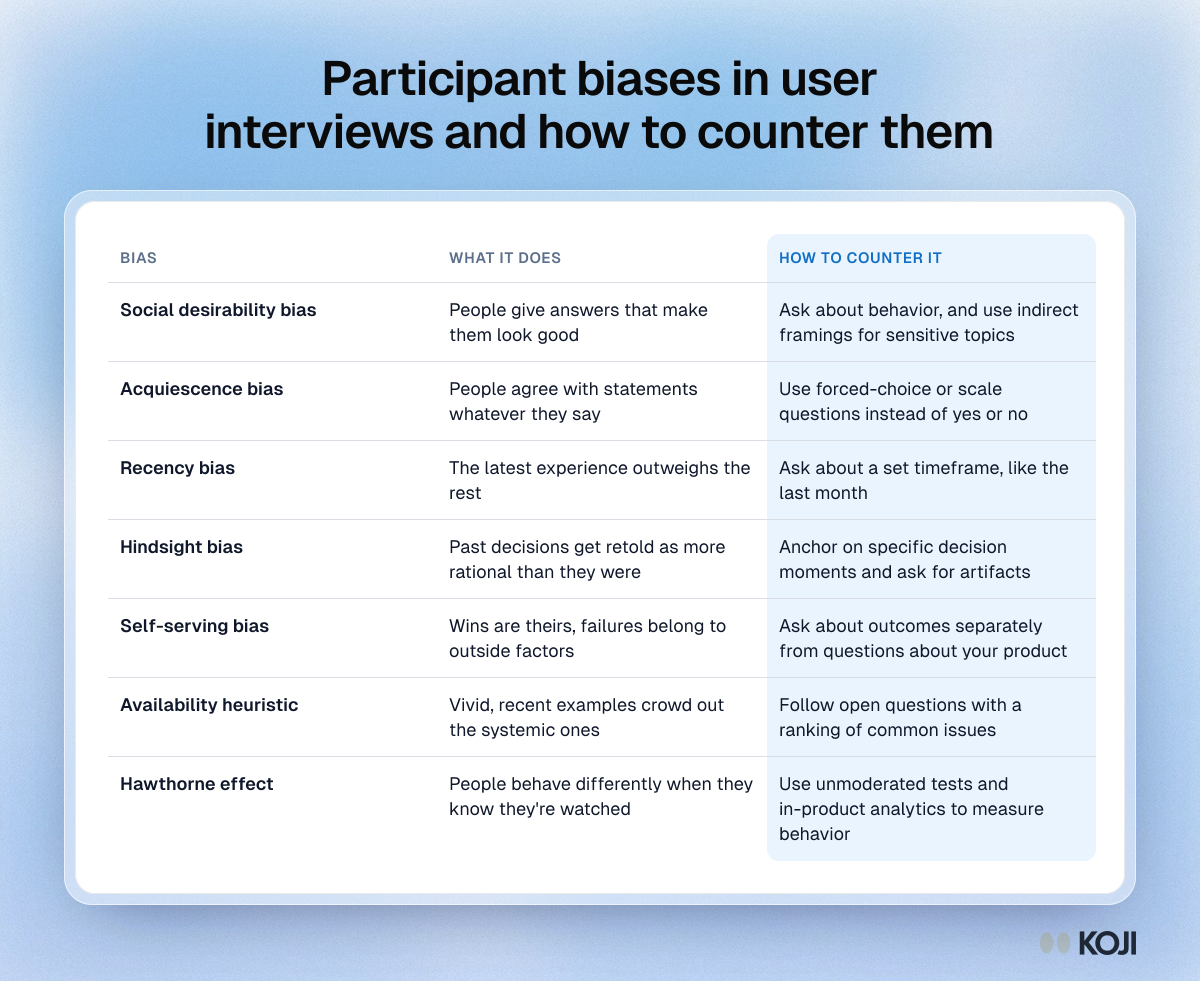
Table of seven participant-side biases in user interviews, from social desirability and recency bias to the Hawthorne effect, with a countermeasure for each.

Reference table

Participant biases in user interviews and how to counter them
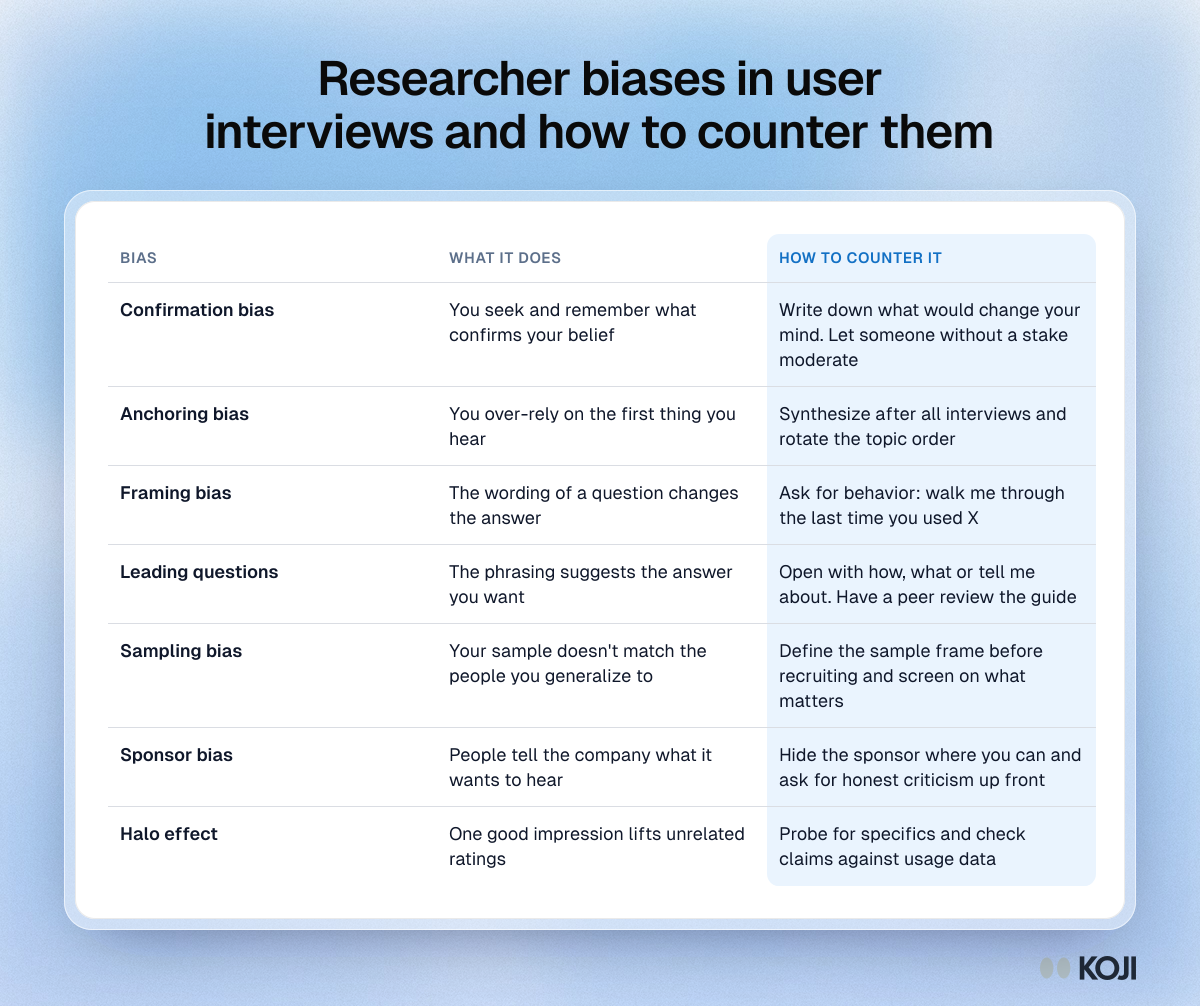
Table of seven researcher-side biases in user interviews, from confirmation and anchoring bias to the halo effect, each with what it does and a countermeasure.

Reference table

Researcher biases in user interviews and how to counter them
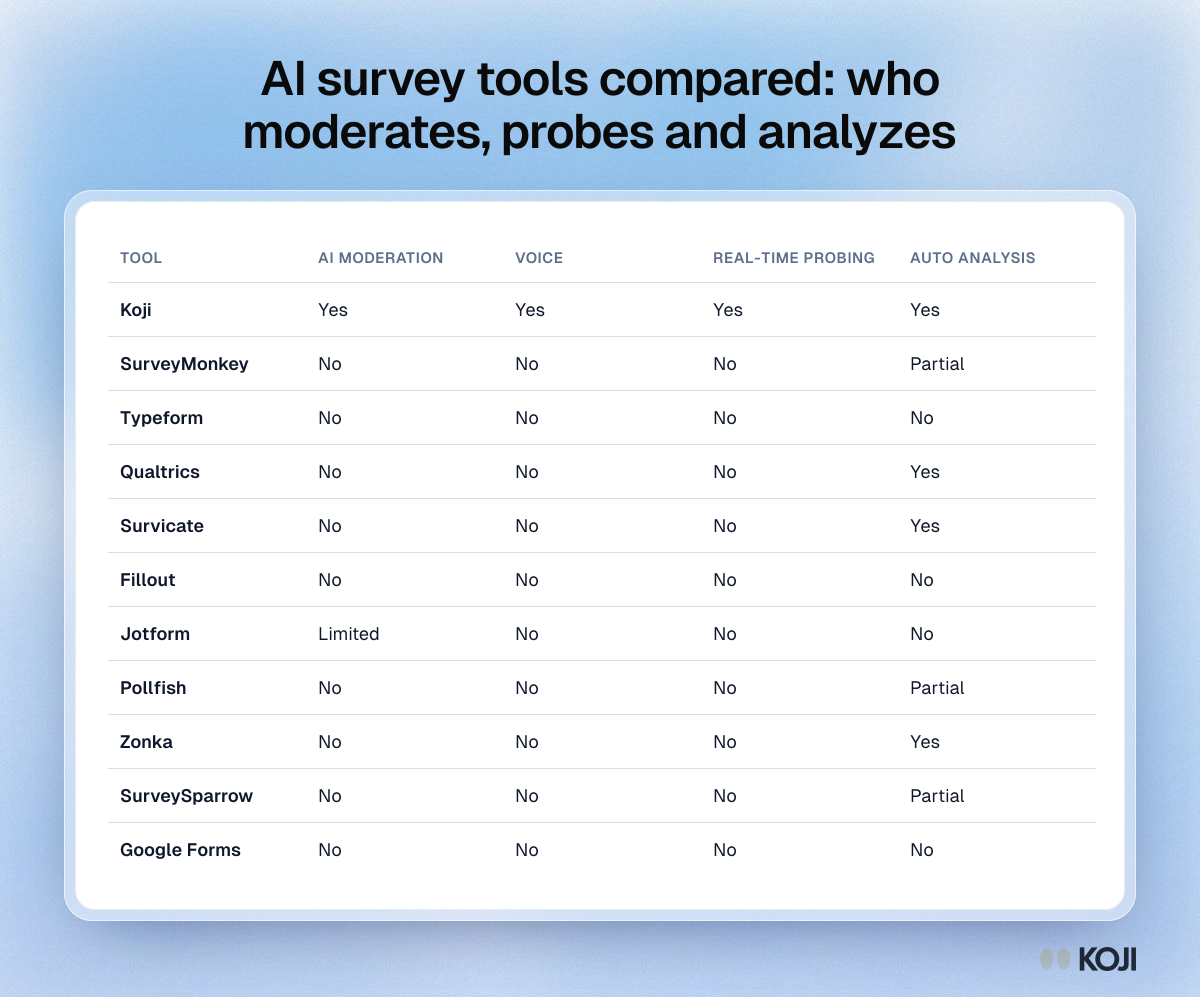
Table comparing 11 AI survey tools on AI moderation, voice, real-time probing and automatic analysis, from Koji and Typeform to Qualtrics and Google Forms.

Reference table

AI survey tools compared: who moderates, probes and analyzes
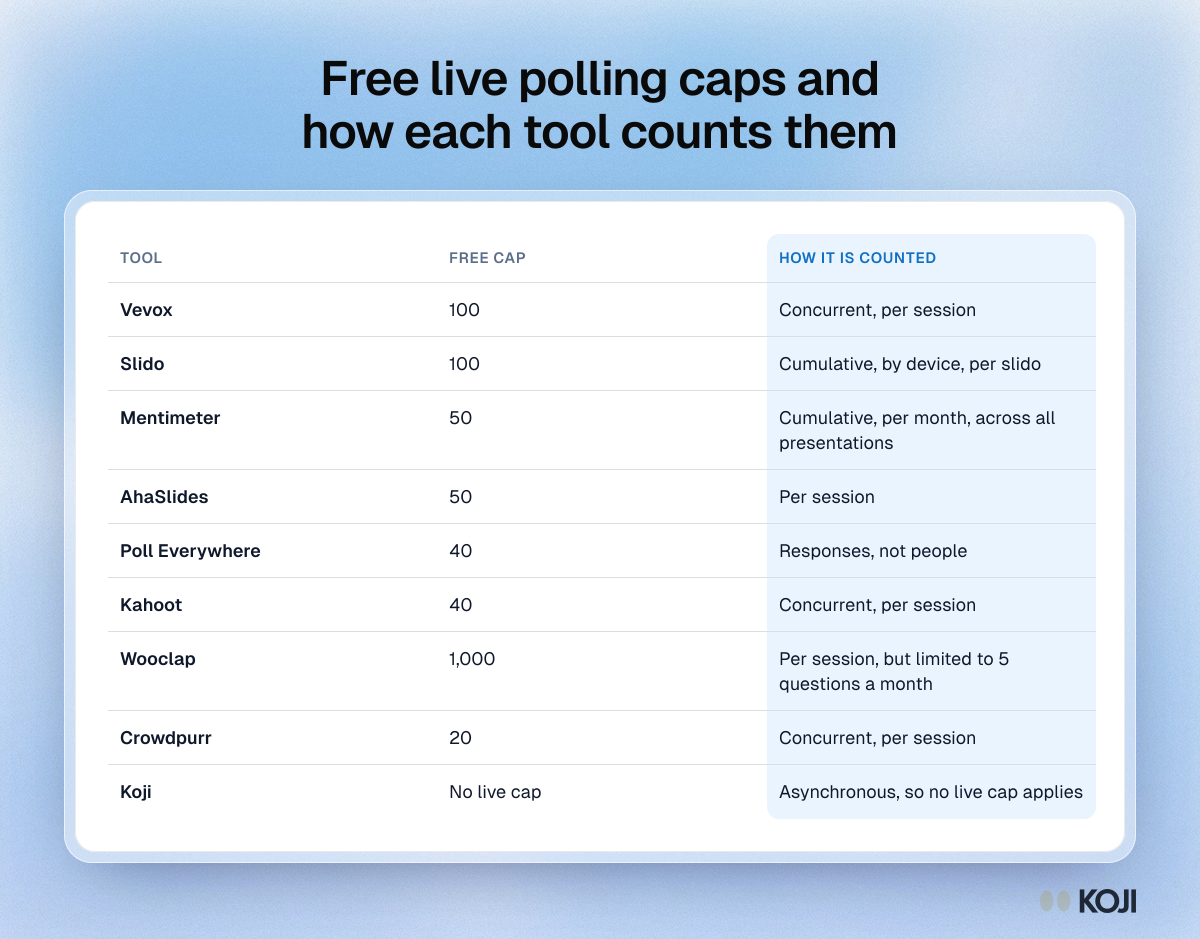
Table of free participant caps for nine live polling tools, from Vevox and Slido to Wooclap, and whether each counts people, devices or responses.

Reference table

Free live polling caps and how each tool counts them
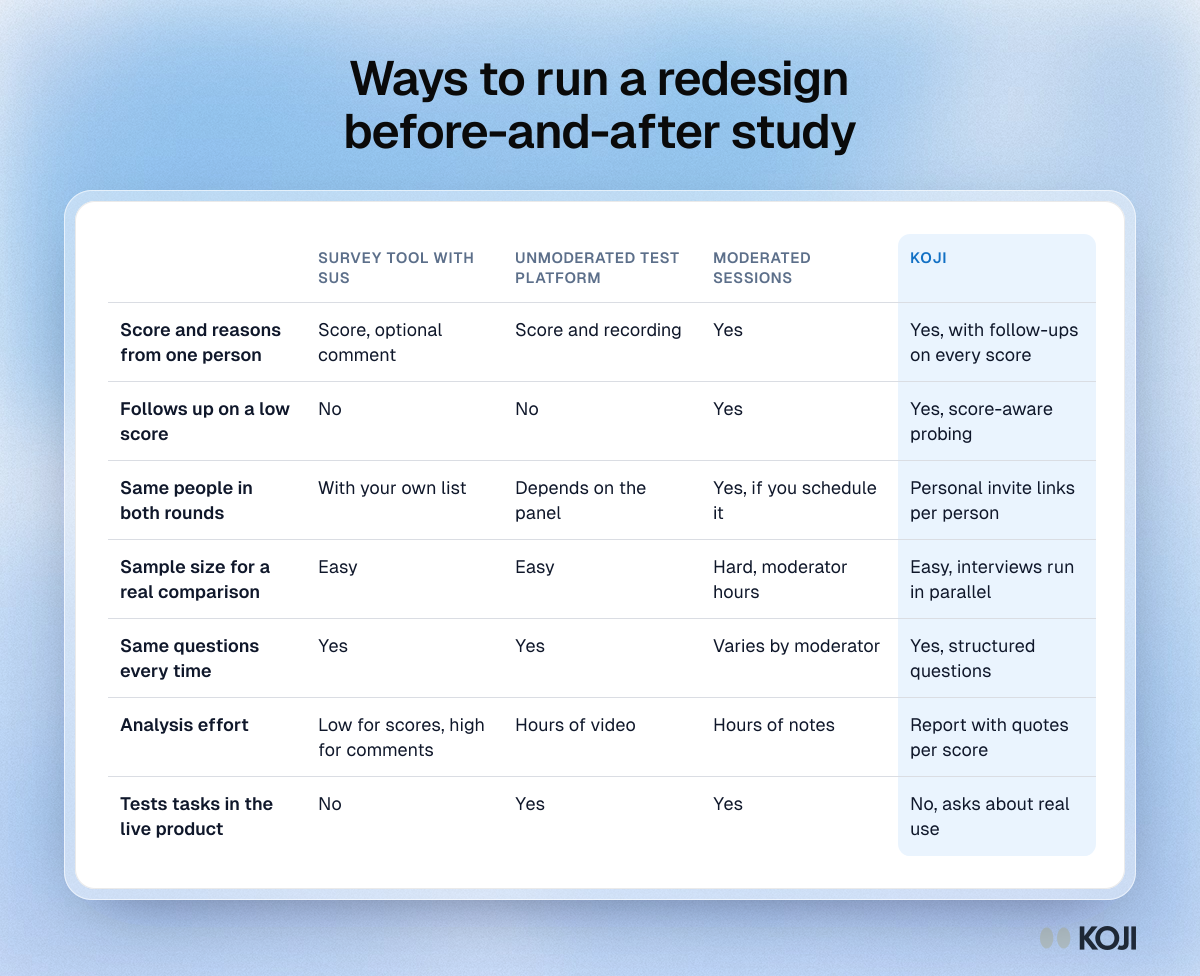
Comparison table of four ways to run a redesign before-and-after study, Koji highlighted, on criteria like follow-up probing and matched participants.

Reference table

Ways to run a redesign before-and-after study
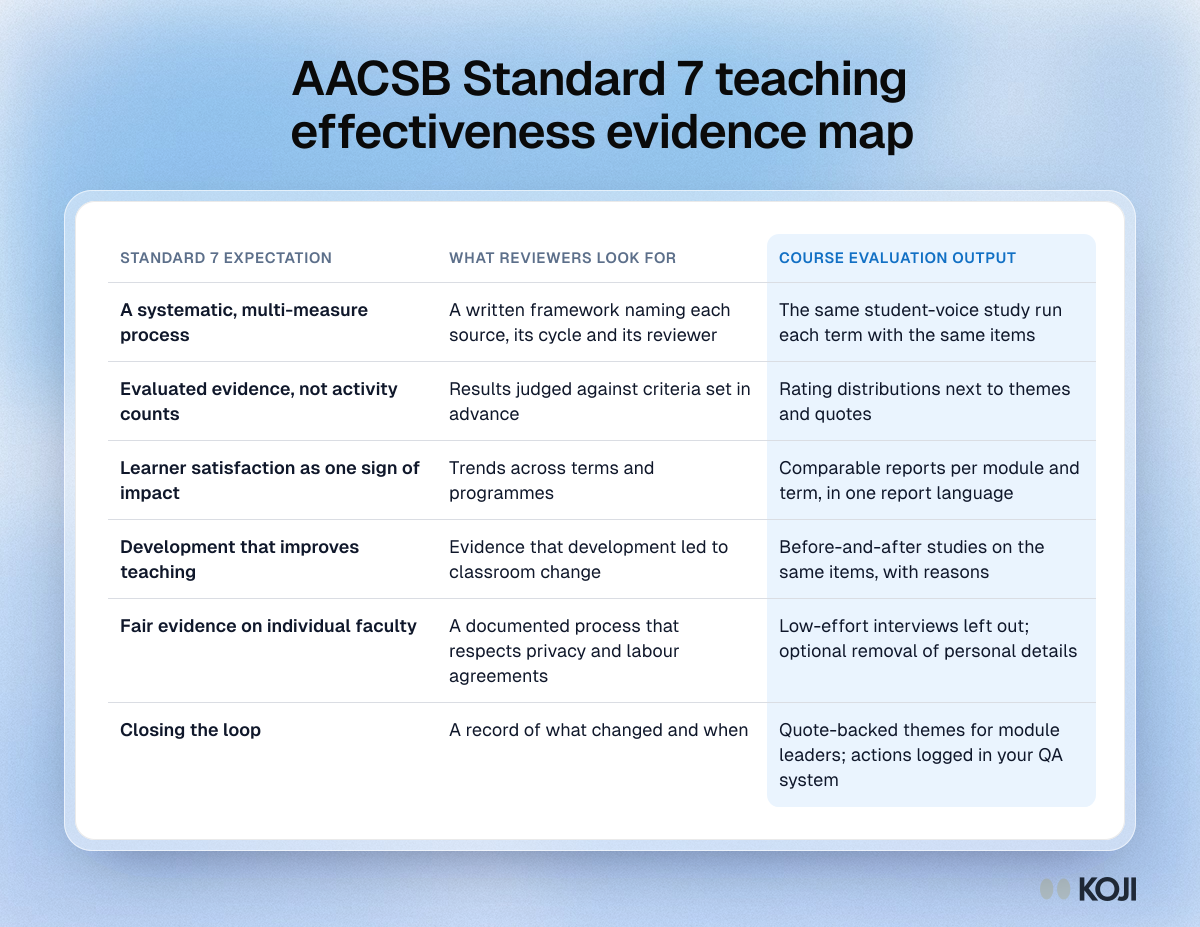
Table mapping AACSB Standard 7 teaching effectiveness expectations to the evidence review teams look for and the course evaluation outputs that support them

Reference table

AACSB Standard 7 teaching effectiveness evidence map
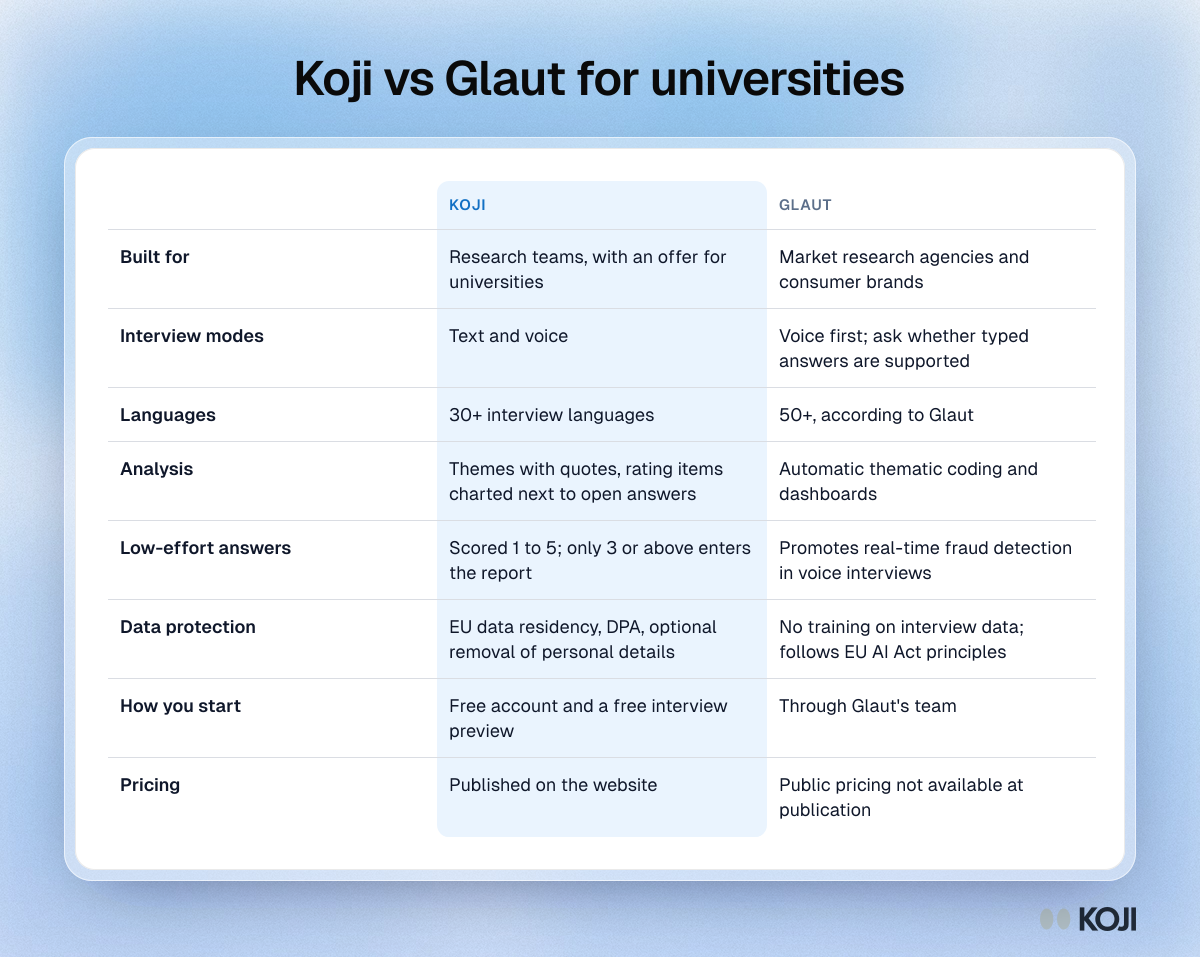
Table comparing Koji and Glaut for university feedback: buyers, interview modes, languages, analysis, quality checks, data protection and pricing

Reference table

Koji vs Glaut for universities
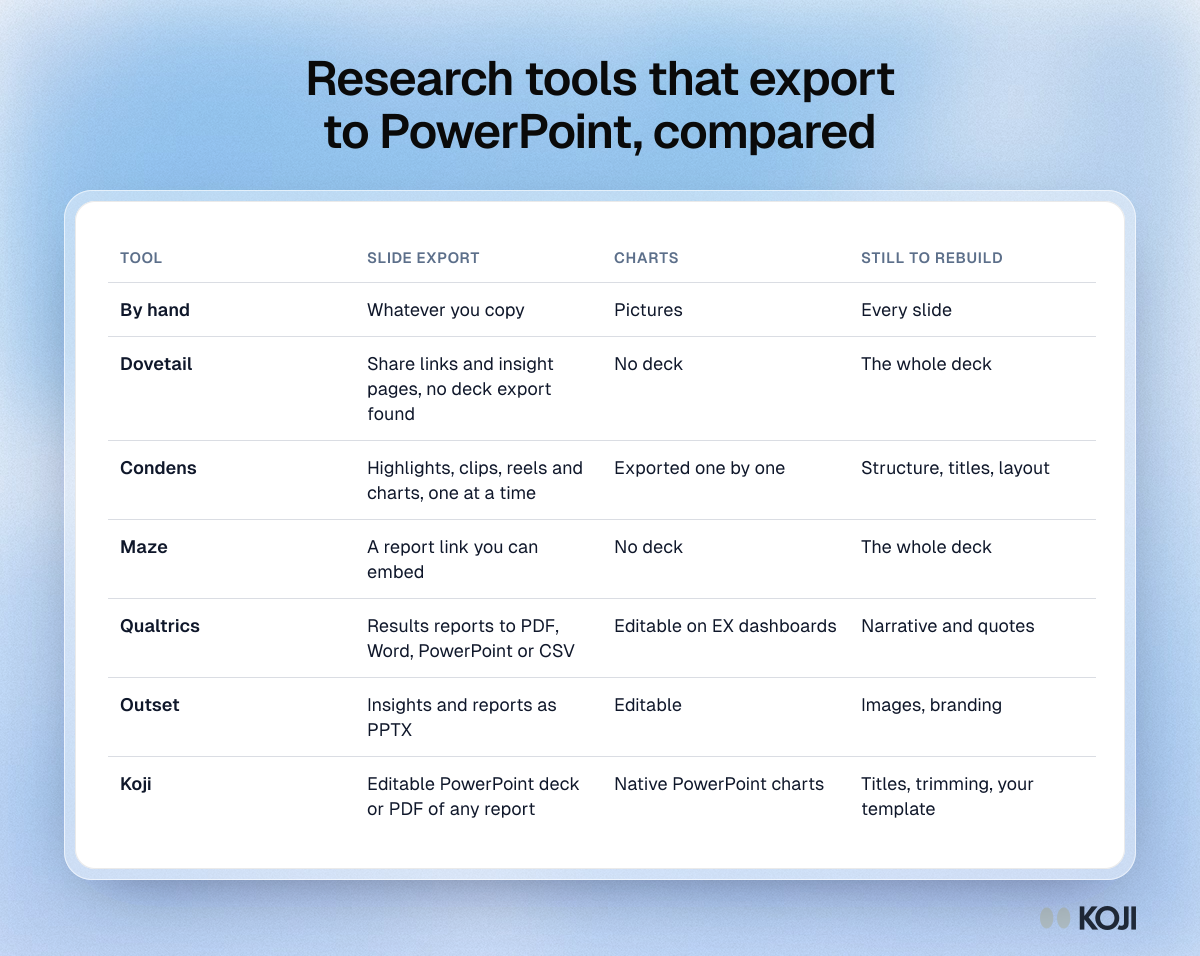
Table comparing how research tools export findings to slides, from hand-built decks to native editable PowerPoint exports, with what you still rebuild in each.

Reference table

Research tools that export to PowerPoint, compared
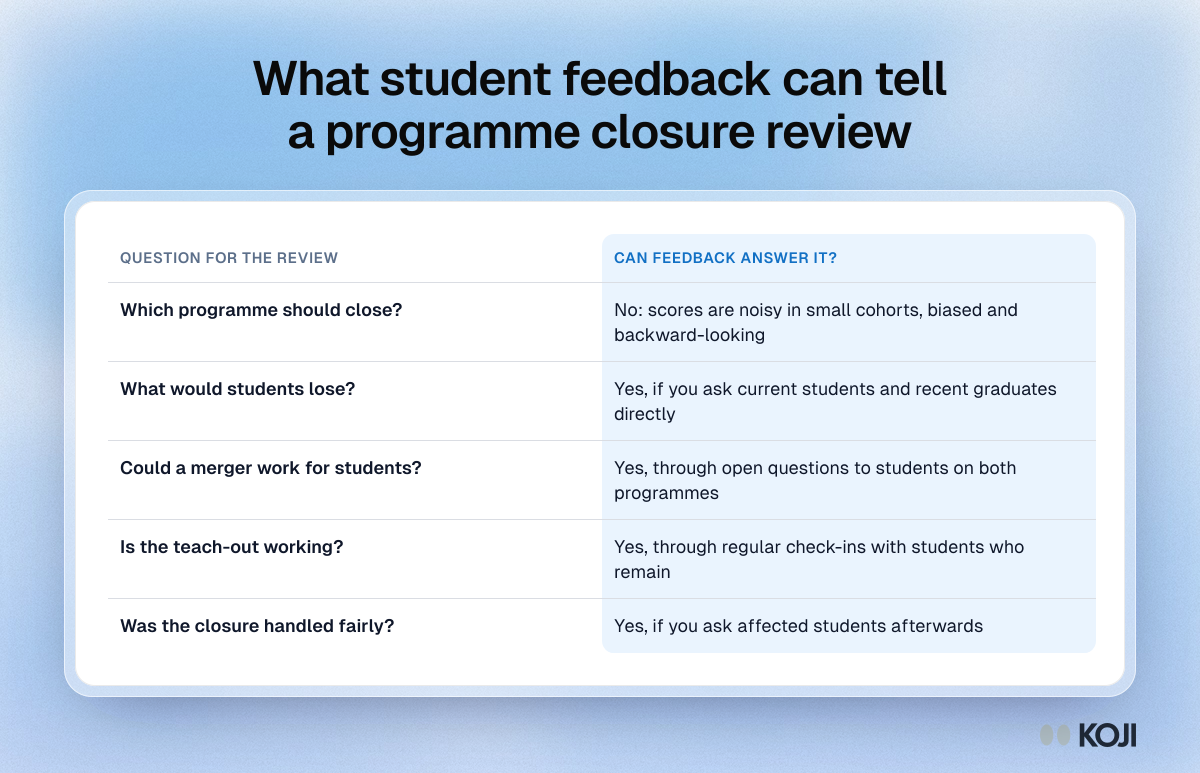
Table of five questions a programme closure review might ask, showing whether student feedback can answer each one.

Reference table

What student feedback can tell a programme closure review
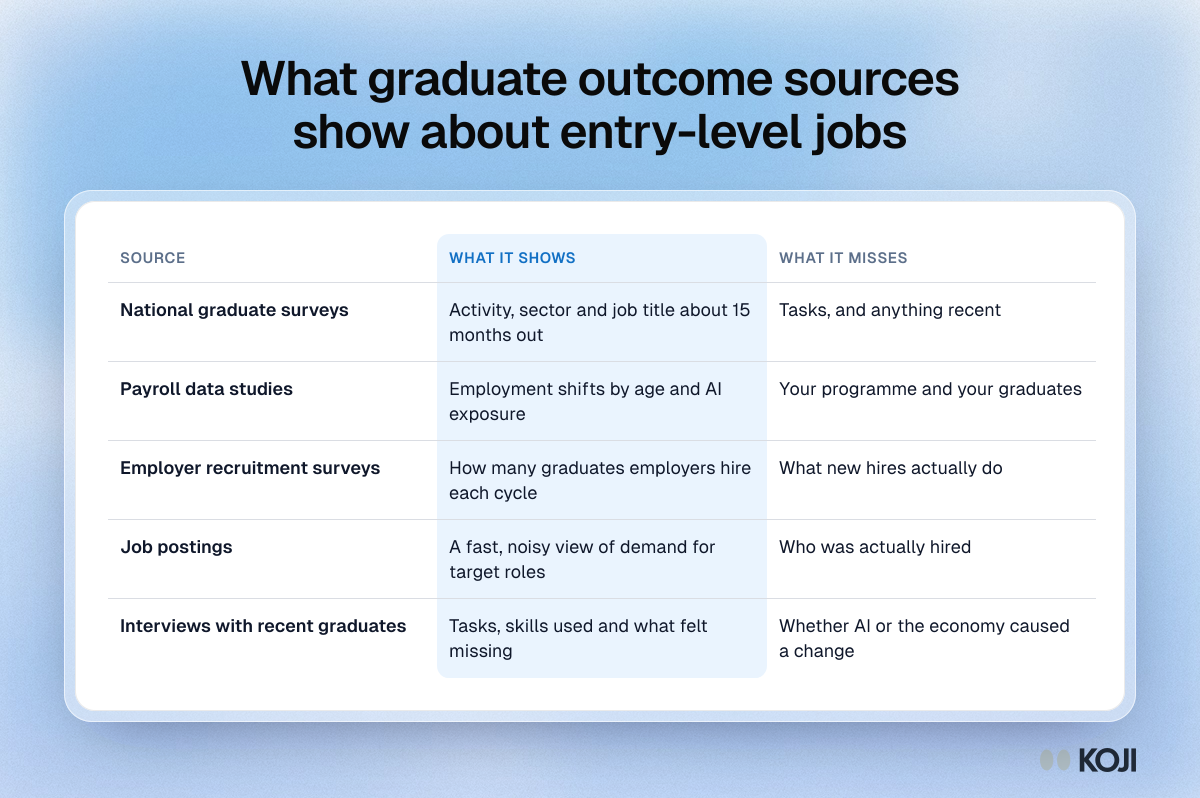
Table comparing five sources of graduate outcome evidence by what each shows and misses about entry-level jobs, from national surveys to interviews.

Reference table

What graduate outcome sources show about entry-level jobs
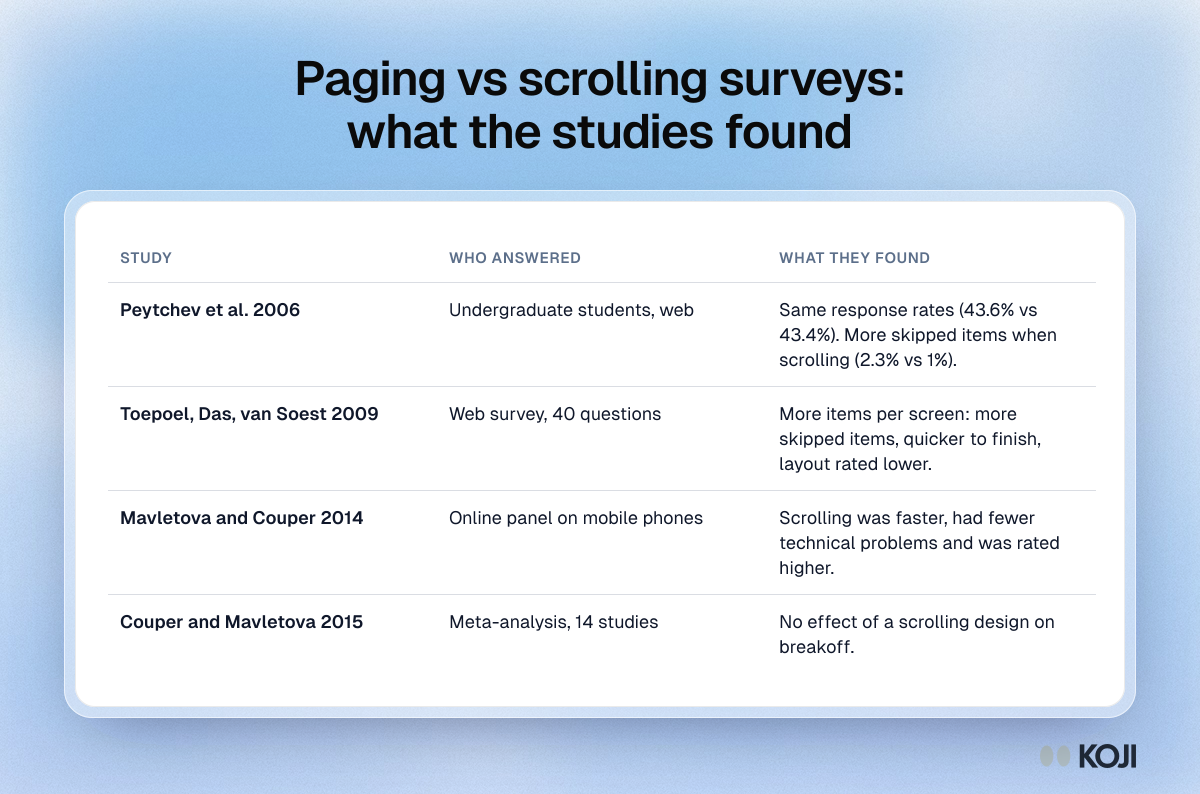
Table comparing four studies of paging and scrolling survey layouts and what each found about response rates, skipped items, speed and breakoff.

Reference table

Paging vs scrolling surveys: what the studies found
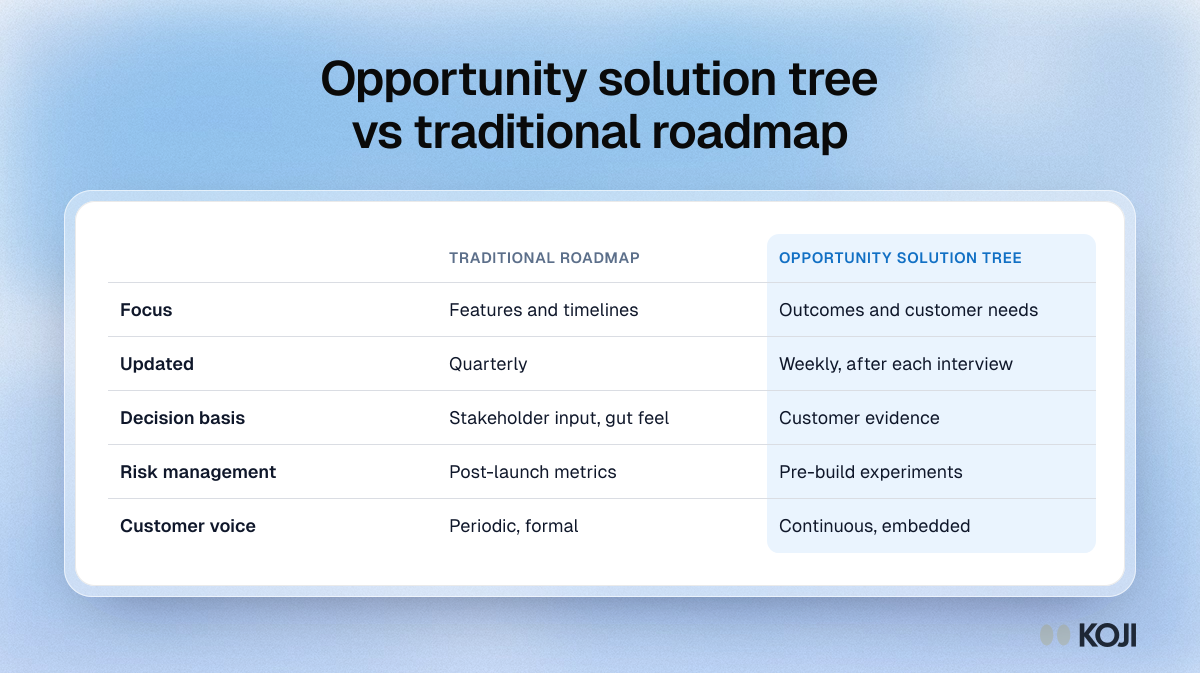
Table comparing a traditional product roadmap with an opportunity solution tree on focus, update rhythm, decision basis, risk and customer voice.

Reference table

Opportunity solution tree vs traditional roadmap
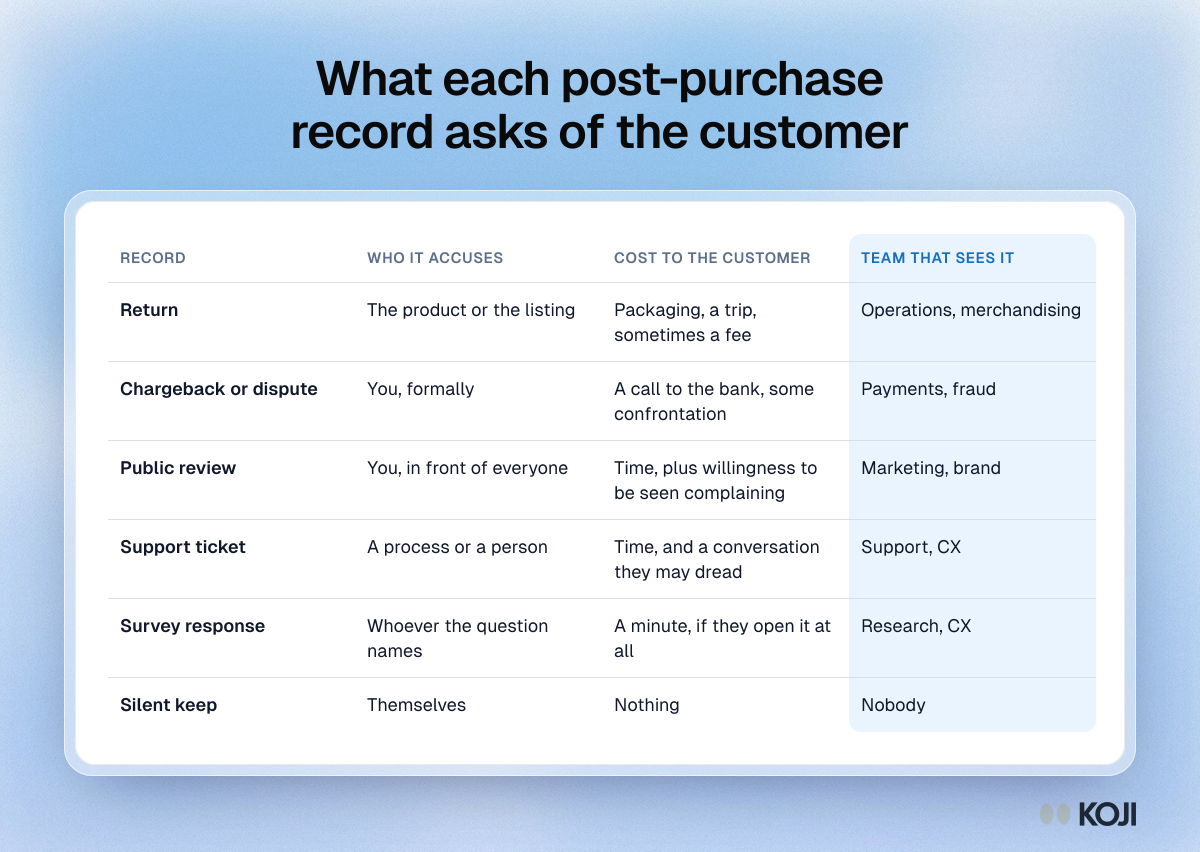
Table of post-purchase records, from returns and chargebacks to reviews, tickets and surveys, showing who each accuses, what it costs and who sees it.

Reference table

What each post-purchase record asks of the customer
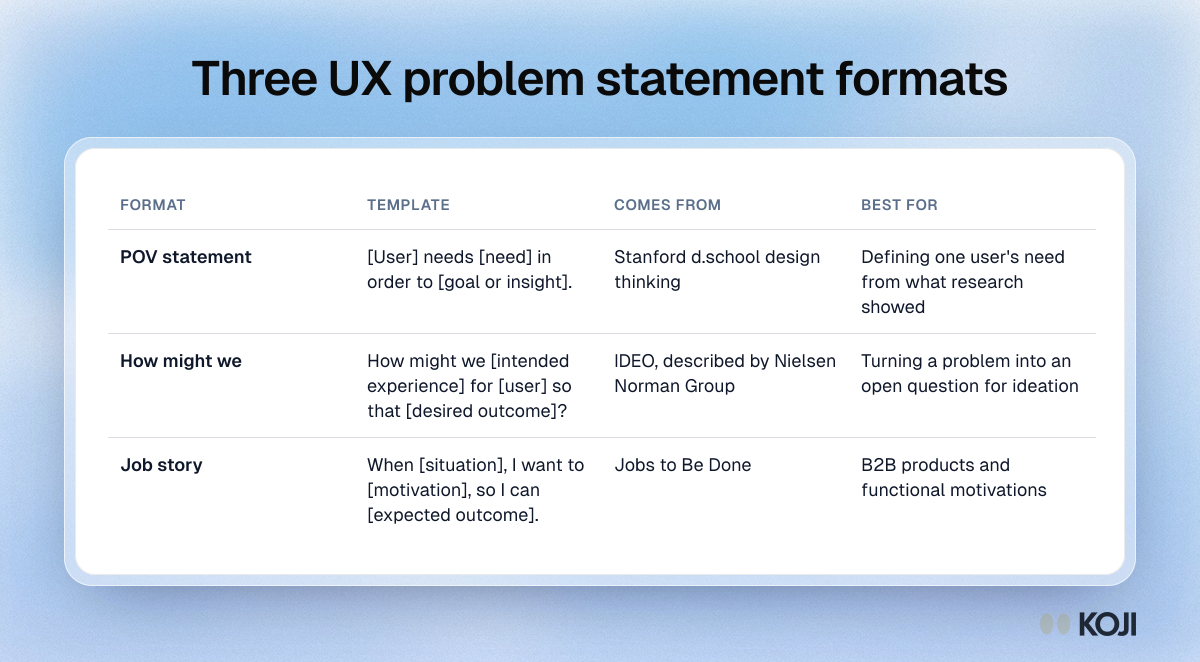
Table of three UX problem statement formats, POV statement, How might we and job story, with the template, origin and best use of each.

Reference table

Three UX problem statement formats
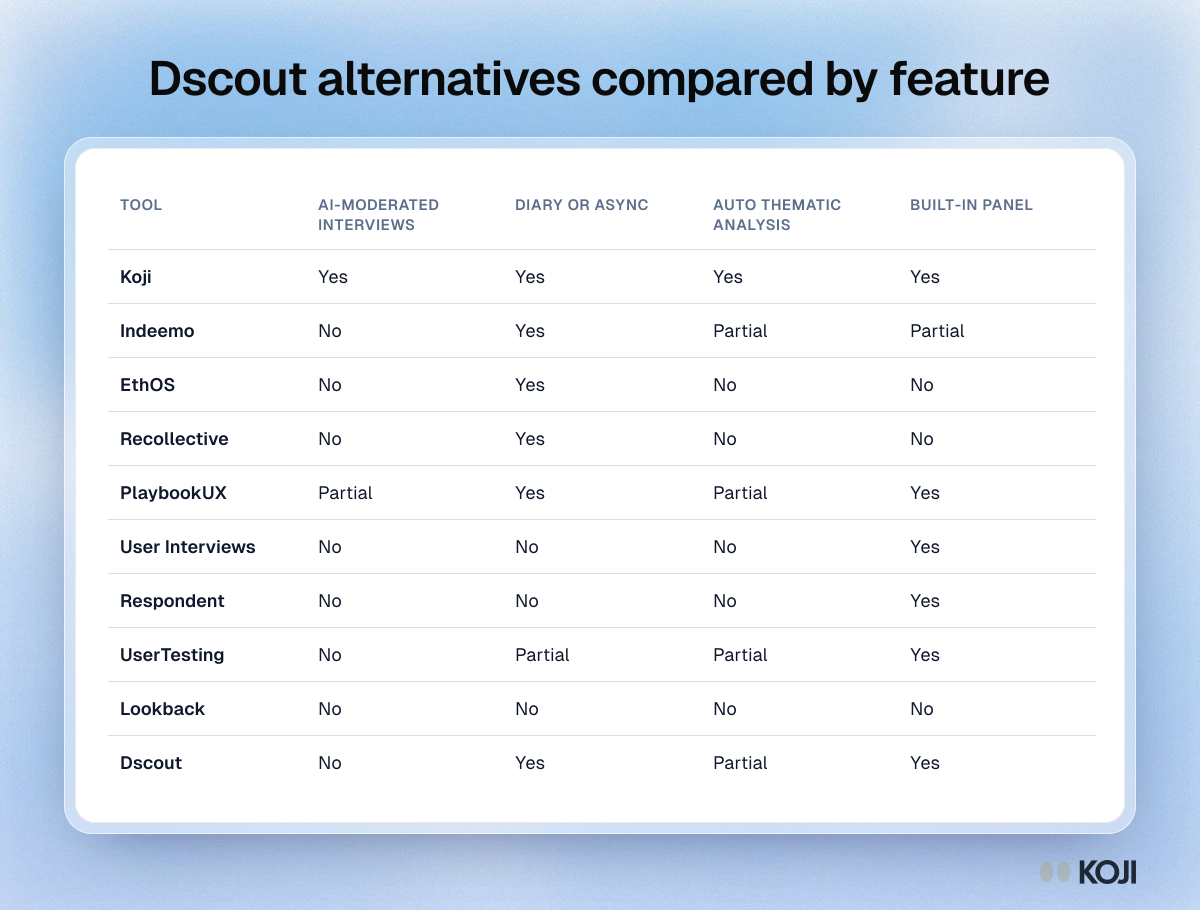
Table comparing Dscout and nine alternatives on AI-moderated interviews, diary or async studies, automatic thematic analysis and a built-in panel.

Reference table

Dscout alternatives compared by feature
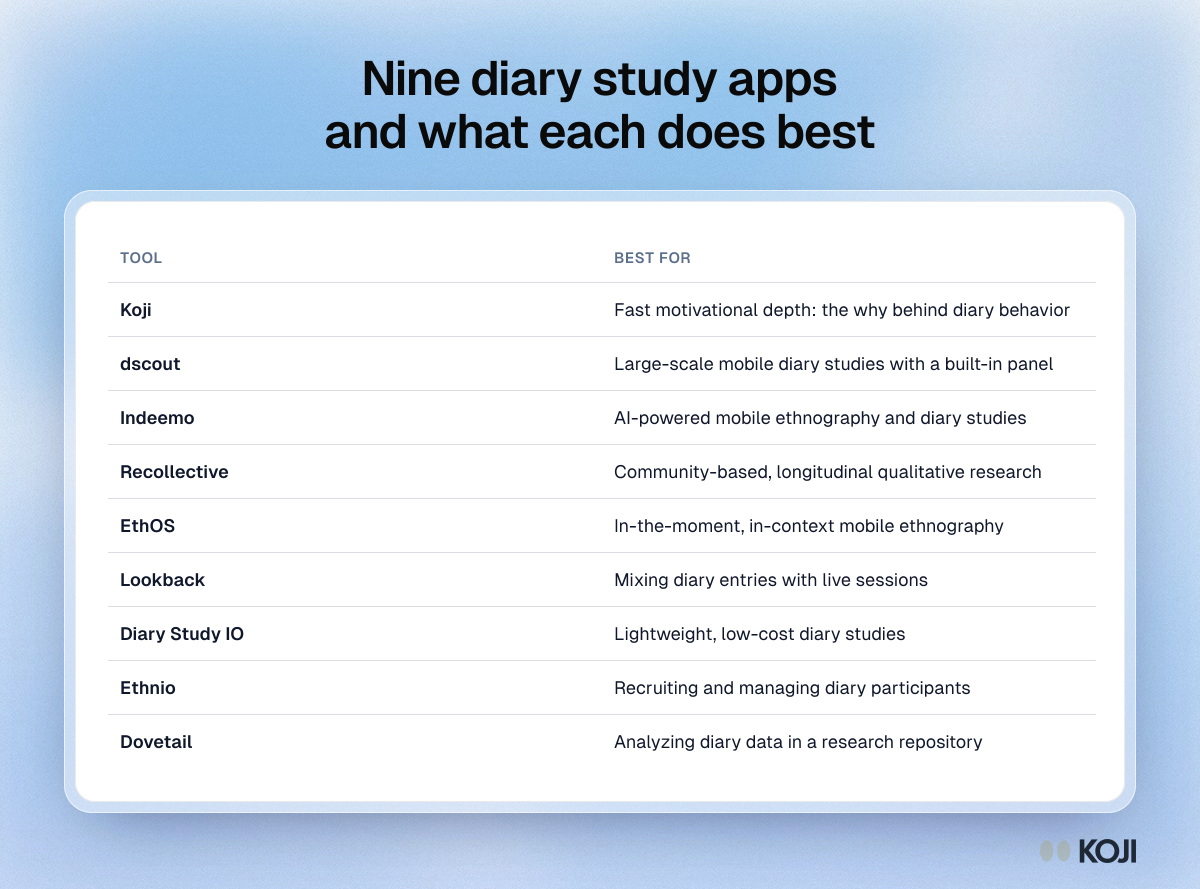
Table of nine diary study apps, including dscout, Indeemo, Recollective, EthOS and Dovetail, with the research job each one suits best.

Reference table

Nine diary study apps and what each does best
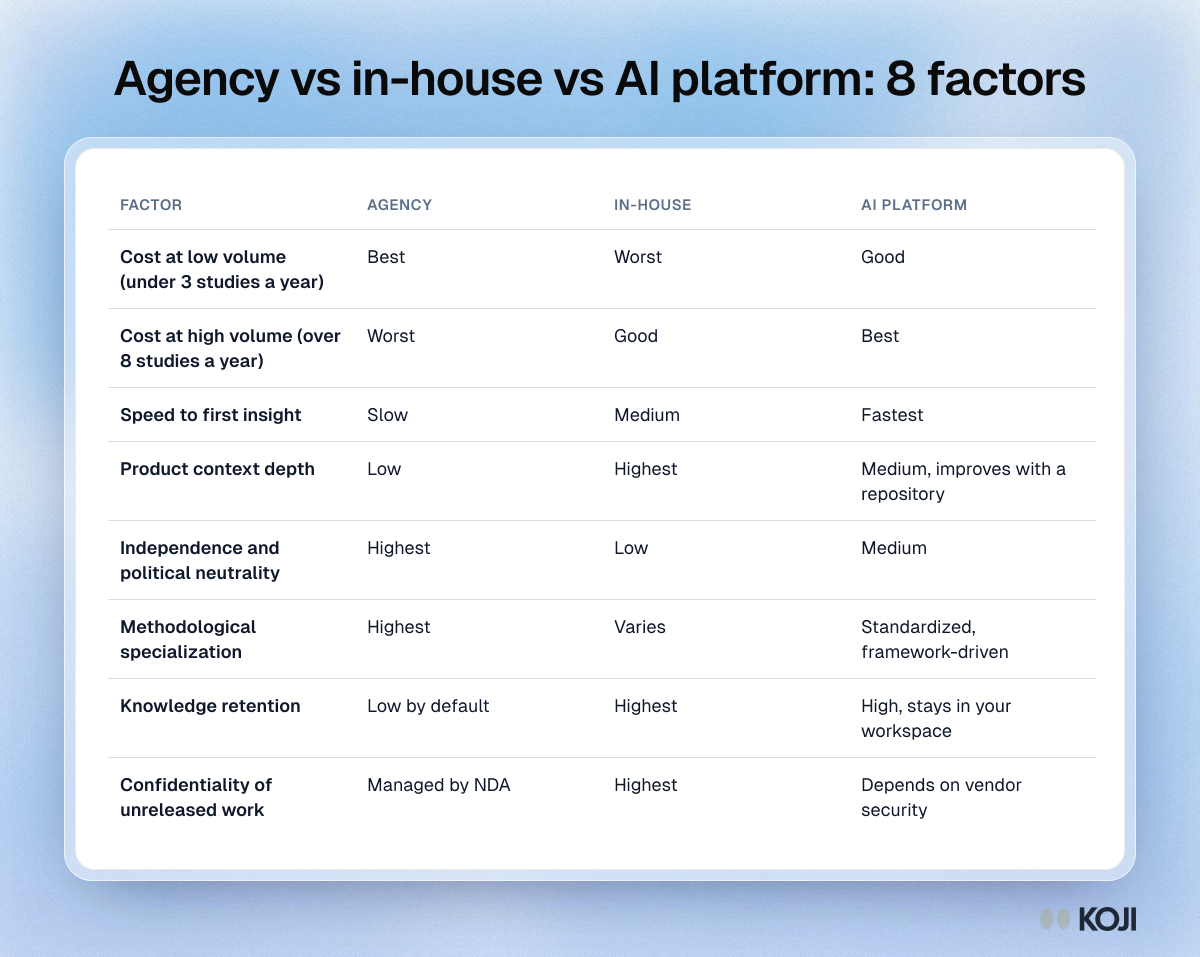
Table rating a research agency, an in-house team and an AI platform on eight factors, from cost by volume to knowledge retention.

Reference table

Agency vs in-house vs AI platform: 8 factors
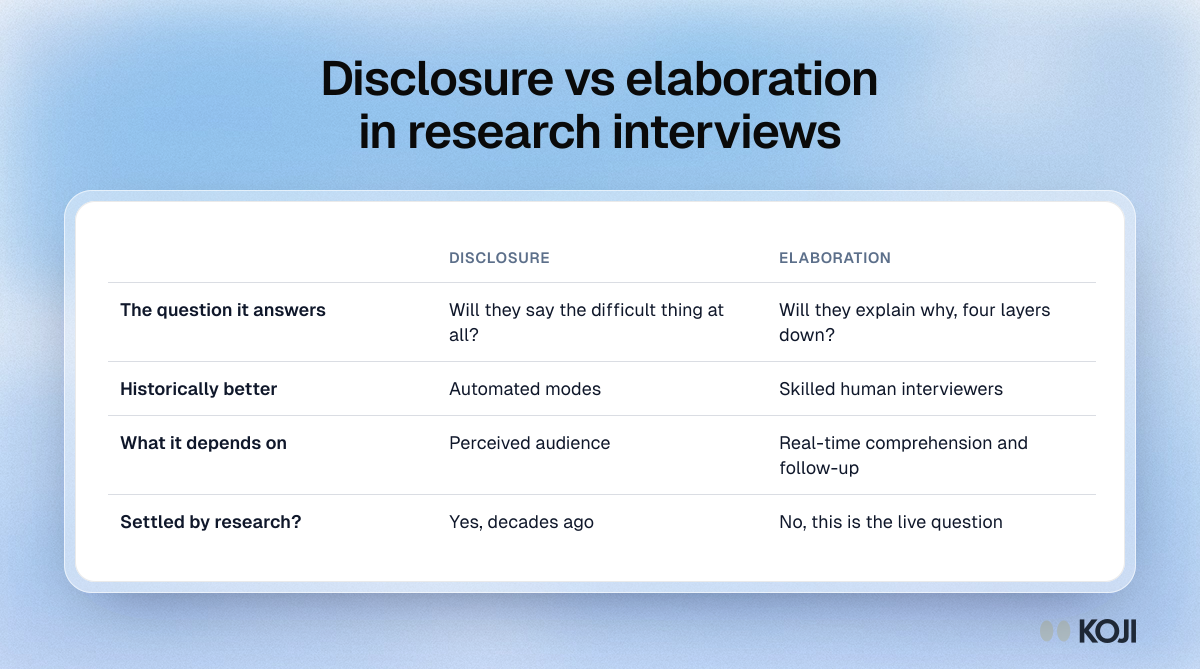
Table contrasting disclosure and elaboration: automated modes do better on disclosure, skilled human interviewers on elaboration.

Reference table

Disclosure vs elaboration in research interviews
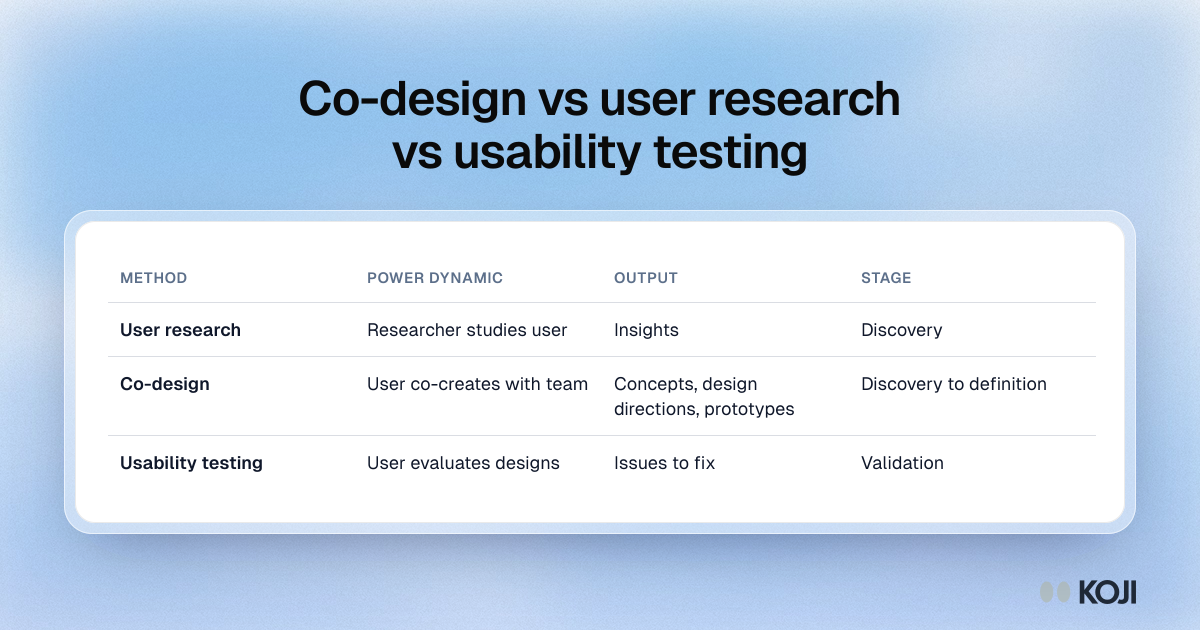
Table comparing user research, co-design and usability testing by power dynamic, output and stage, with co-design sitting between discovery and definition.

Reference table

Co-design vs user research vs usability testing
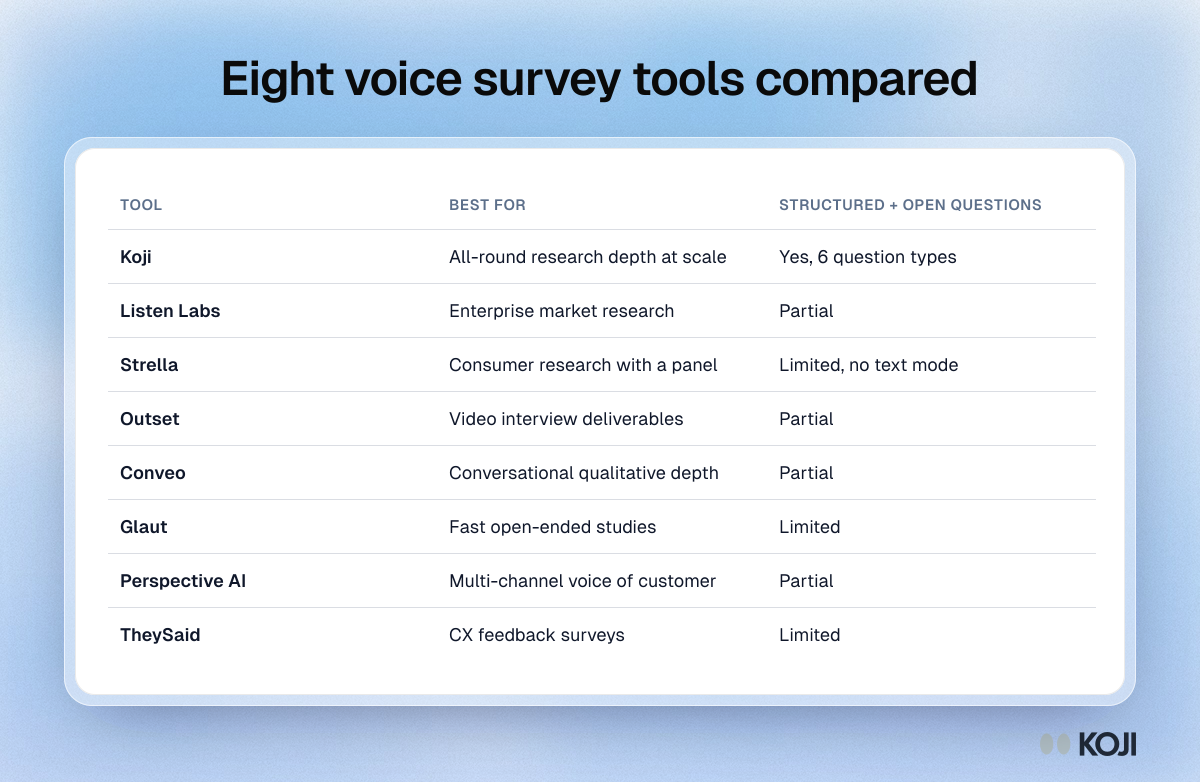
Table comparing eight voice survey tools by what each is best for and how well it mixes structured and open questions, with Koji supporting six types.

Reference table

Eight voice survey tools compared
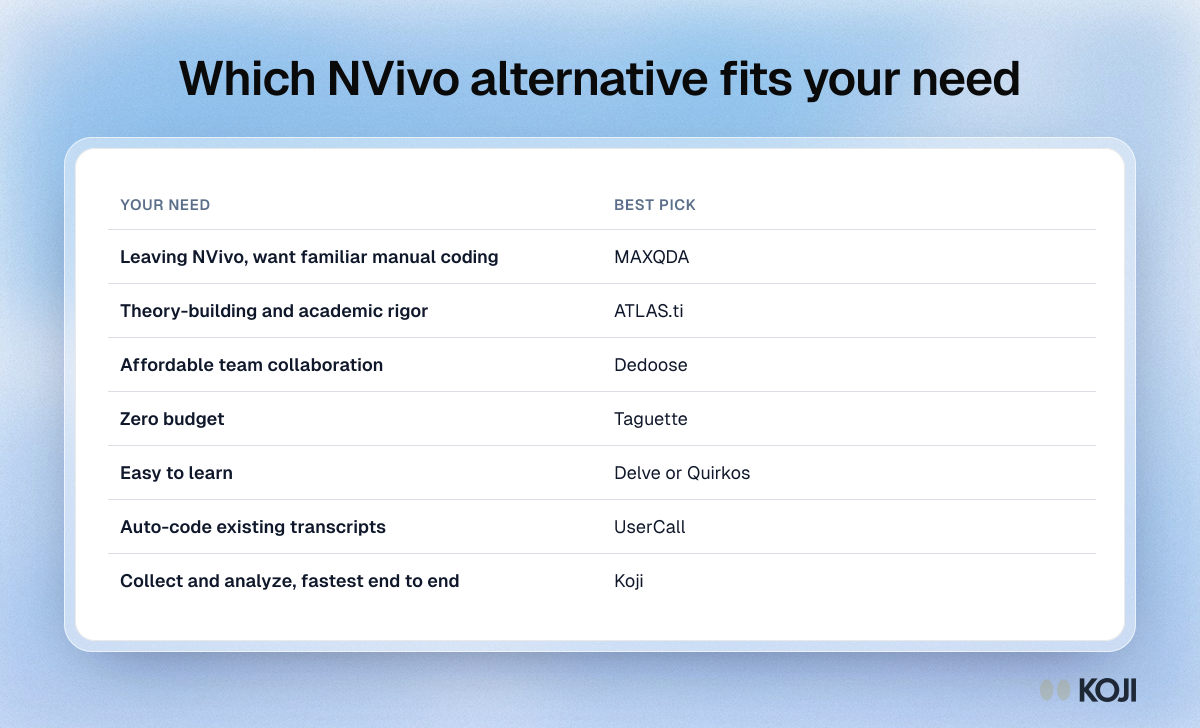
Table matching seven research needs to the best NVivo alternative, from MAXQDA for familiar manual coding to Koji for collecting and analyzing in one place.

Reference table

Which NVivo alternative fits your need
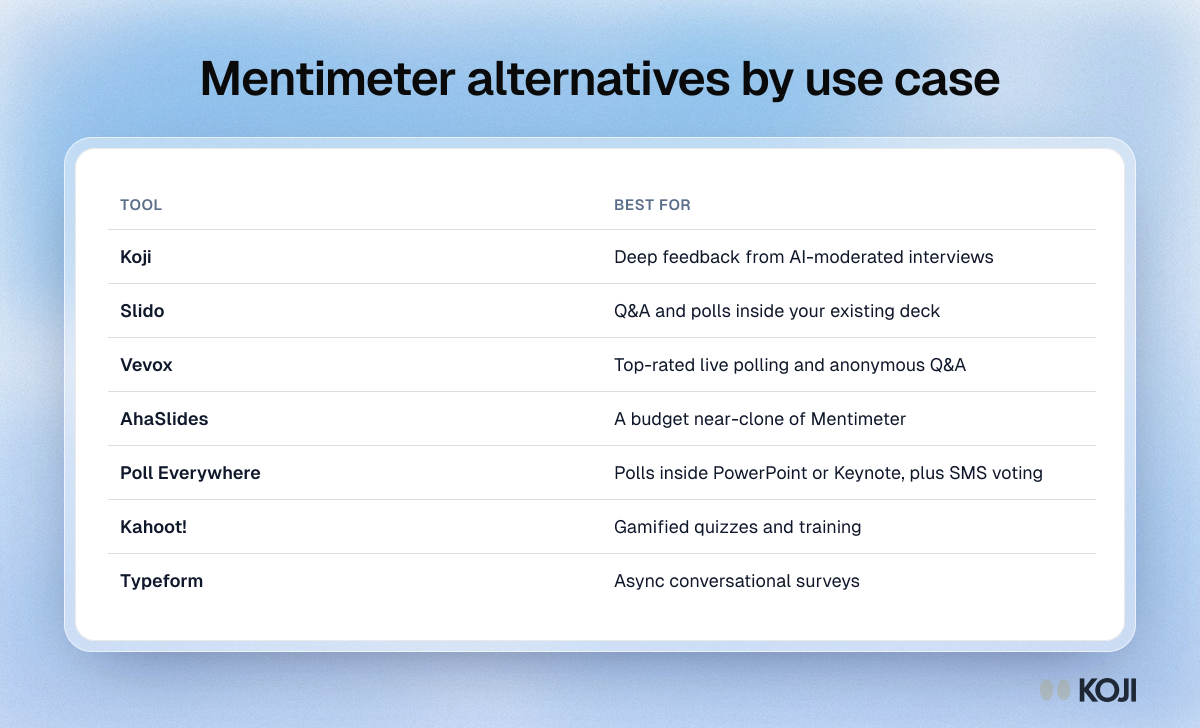
Table matching seven Mentimeter alternatives to what each does best, from Slido for in-deck Q&A to Koji for deep feedback from AI interviews.

Reference table

Mentimeter alternatives by use case
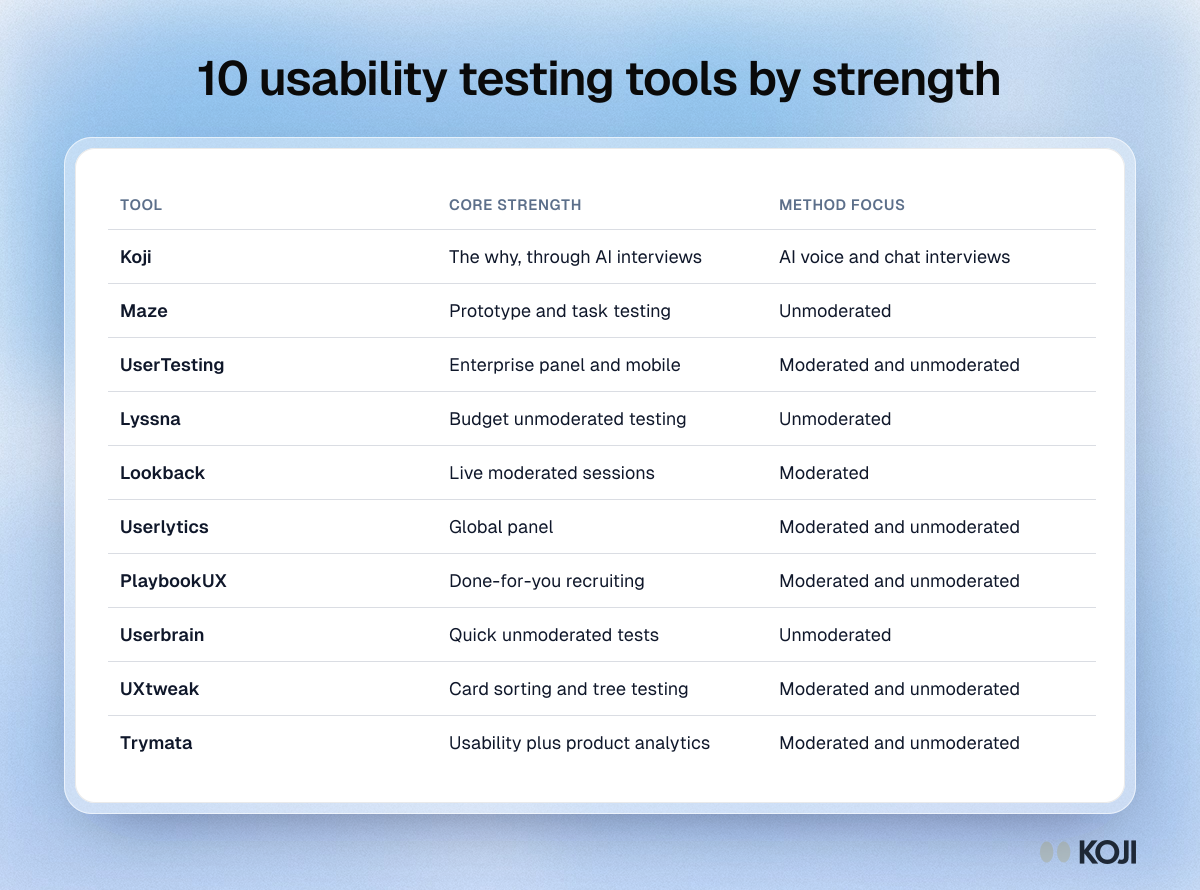
Table of 10 usability testing tools with each one's core strength and method focus, from Maze for prototype testing to Koji for AI interviews.

Reference table

10 usability testing tools by strength
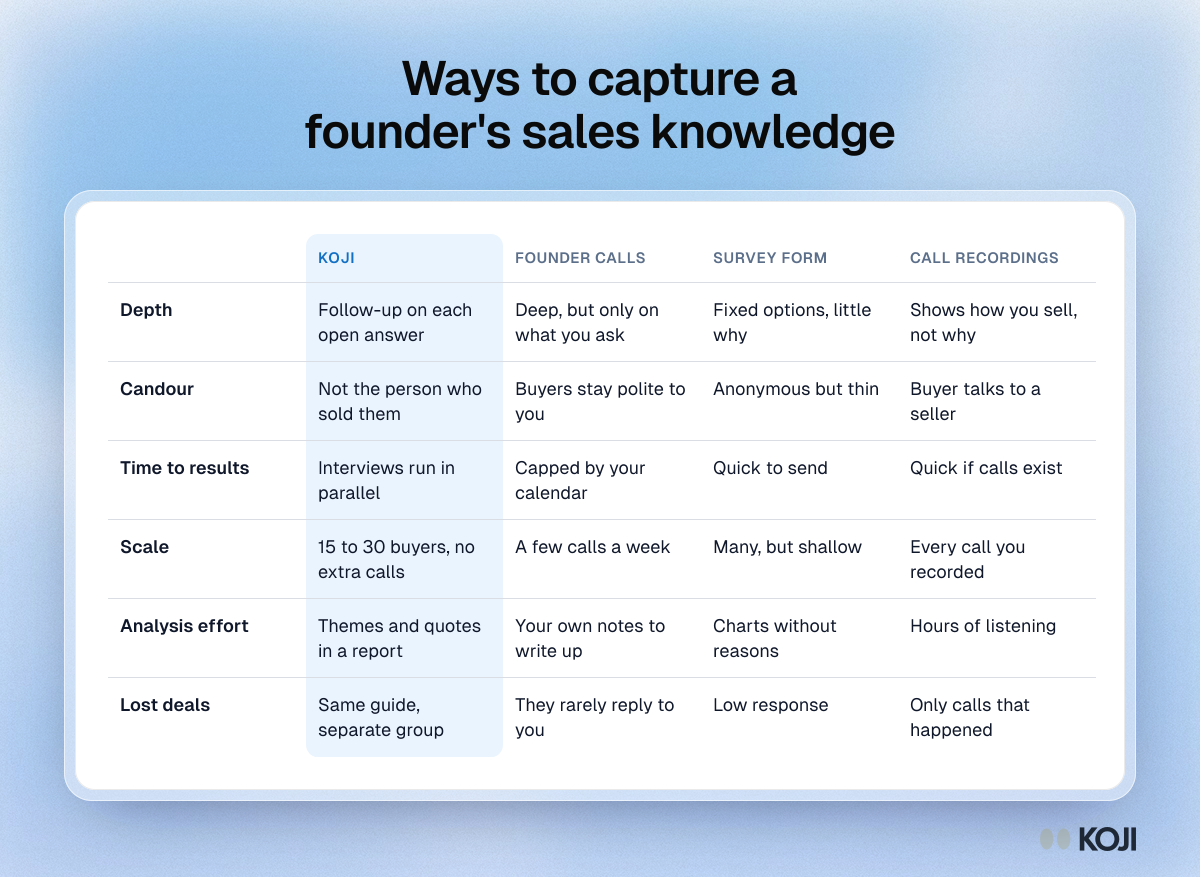
Table comparing Koji, founder calls, survey forms and call recordings on depth, candour, speed, scale, analysis effort and lost deals.

Reference table

Ways to capture a founder's sales knowledge
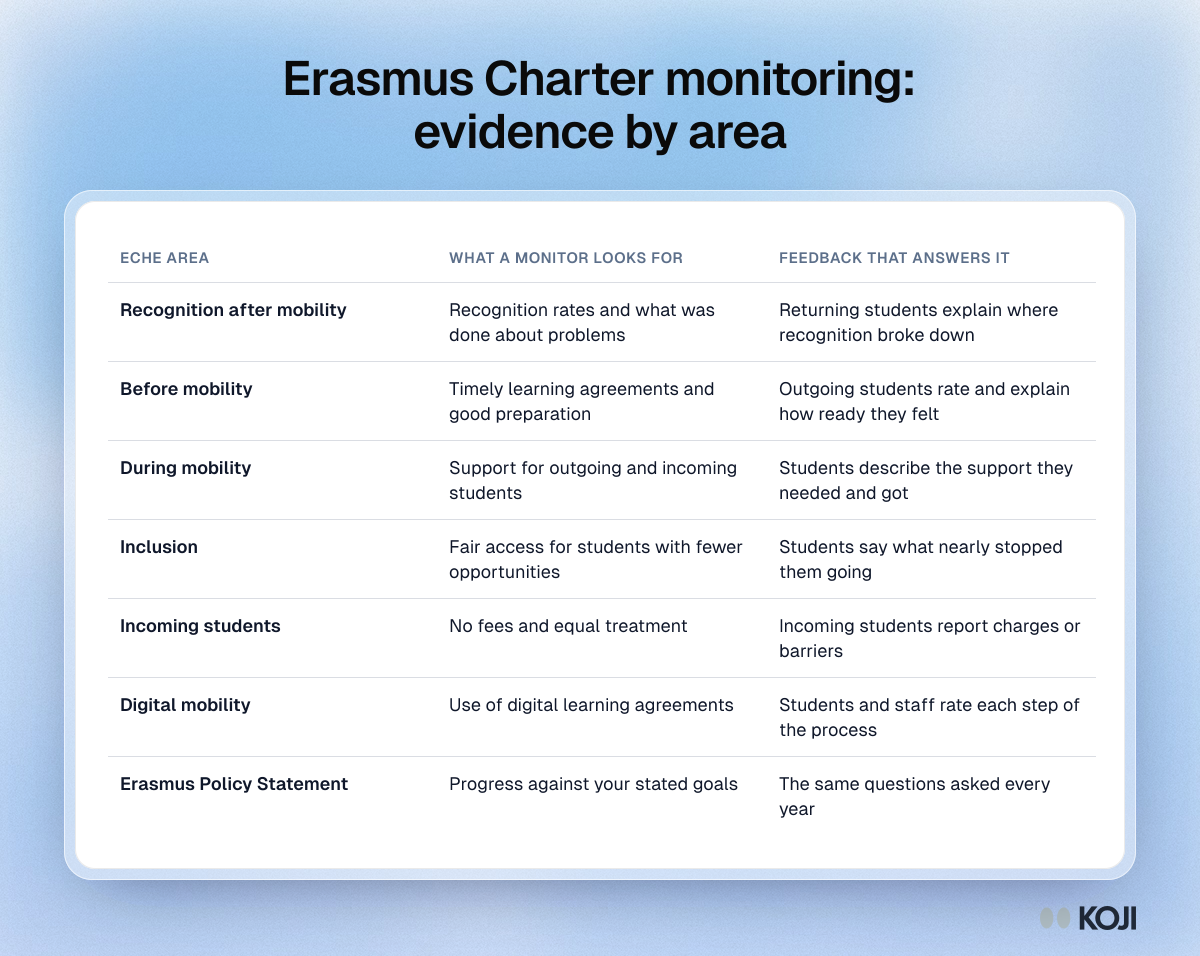
Table mapping seven Erasmus Charter areas to the evidence a National Agency monitor will look for and the student feedback that produces it.

Reference table

Erasmus Charter monitoring: evidence by area
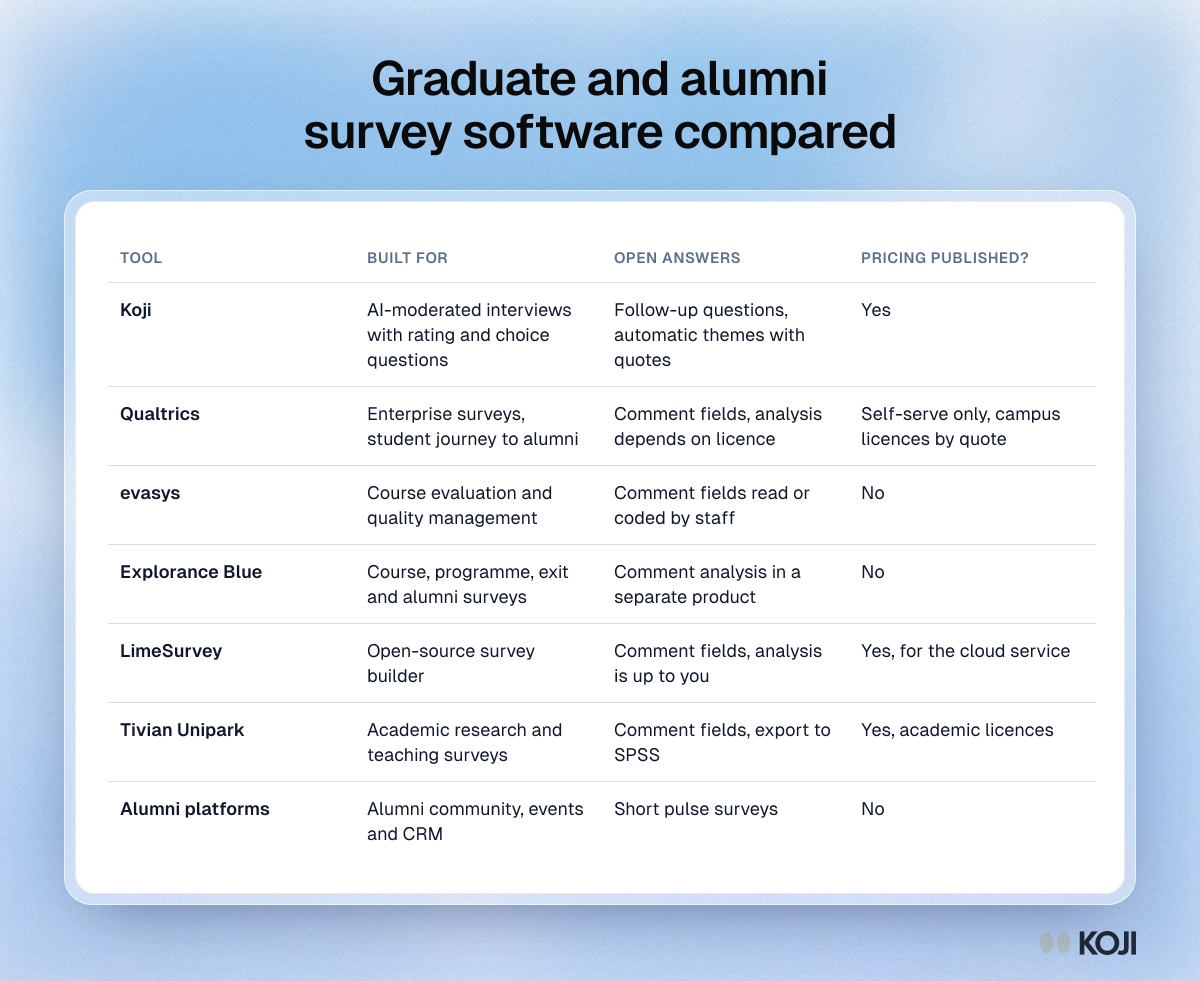
Table comparing seven graduate and alumni survey tools by what they are built for, how they handle open answers and whether pricing is published.

Reference table

Graduate and alumni survey software compared
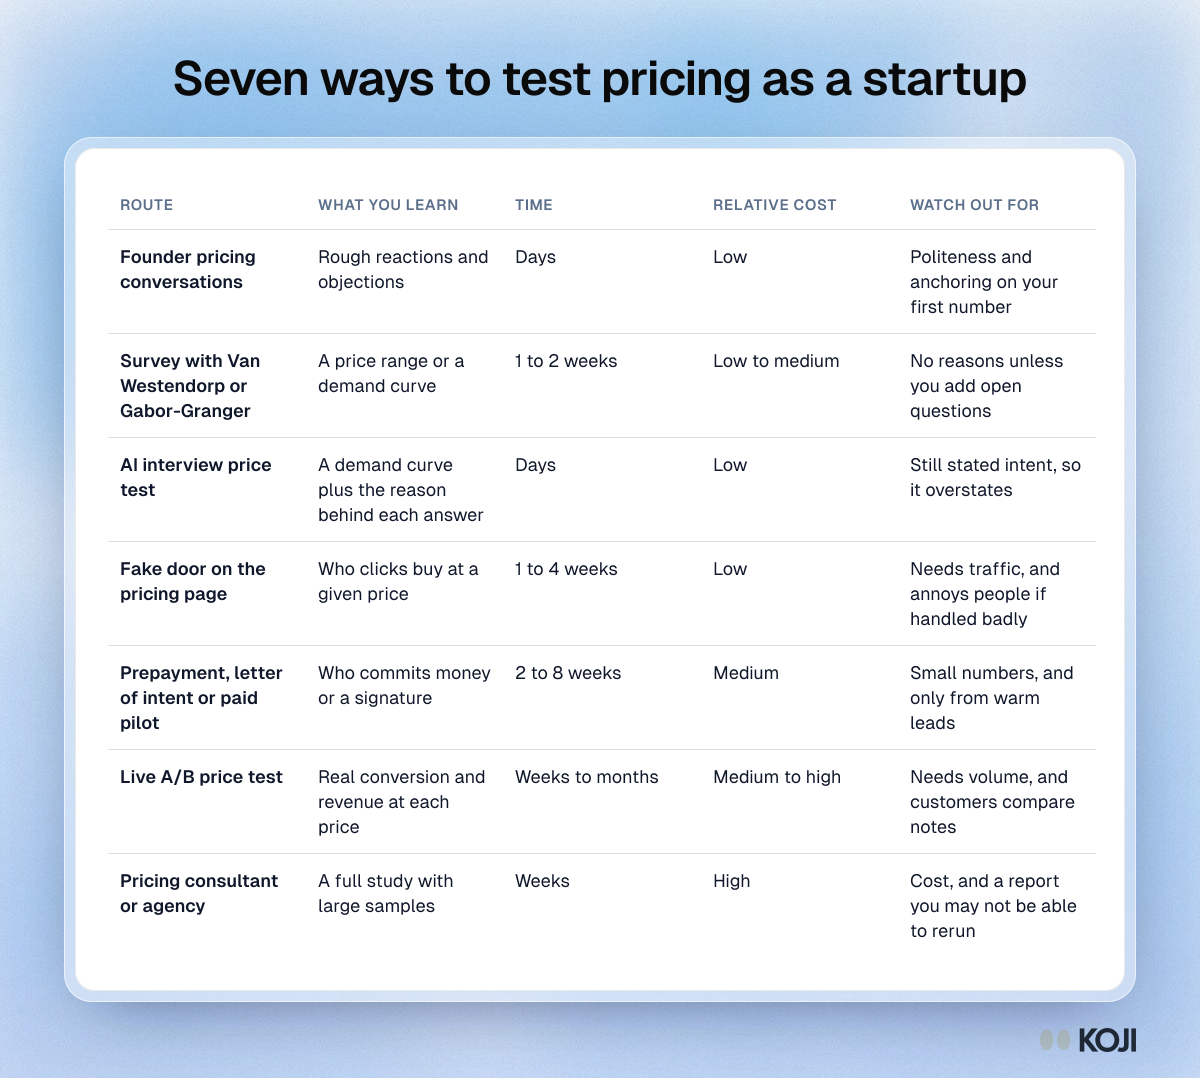
Table comparing seven ways a startup can test pricing, from founder conversations to live A/B price tests, by what you learn, time, cost and risk.

Reference table

Seven ways to test pricing as a startup
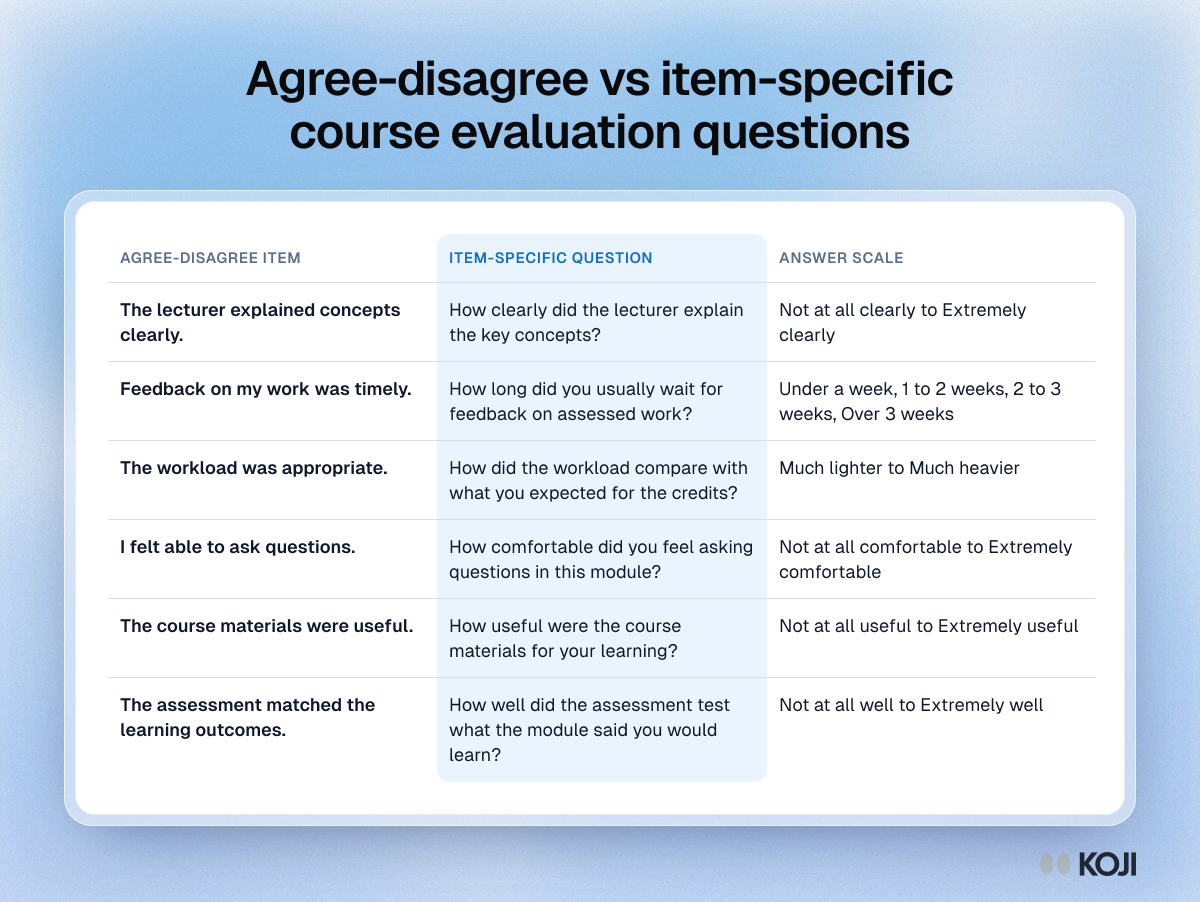
Table pairing six common agree-disagree course evaluation statements with item-specific rewrites and answer scales, from lecture clarity to assessment fit.

Reference table

Agree-disagree vs item-specific course evaluation questions
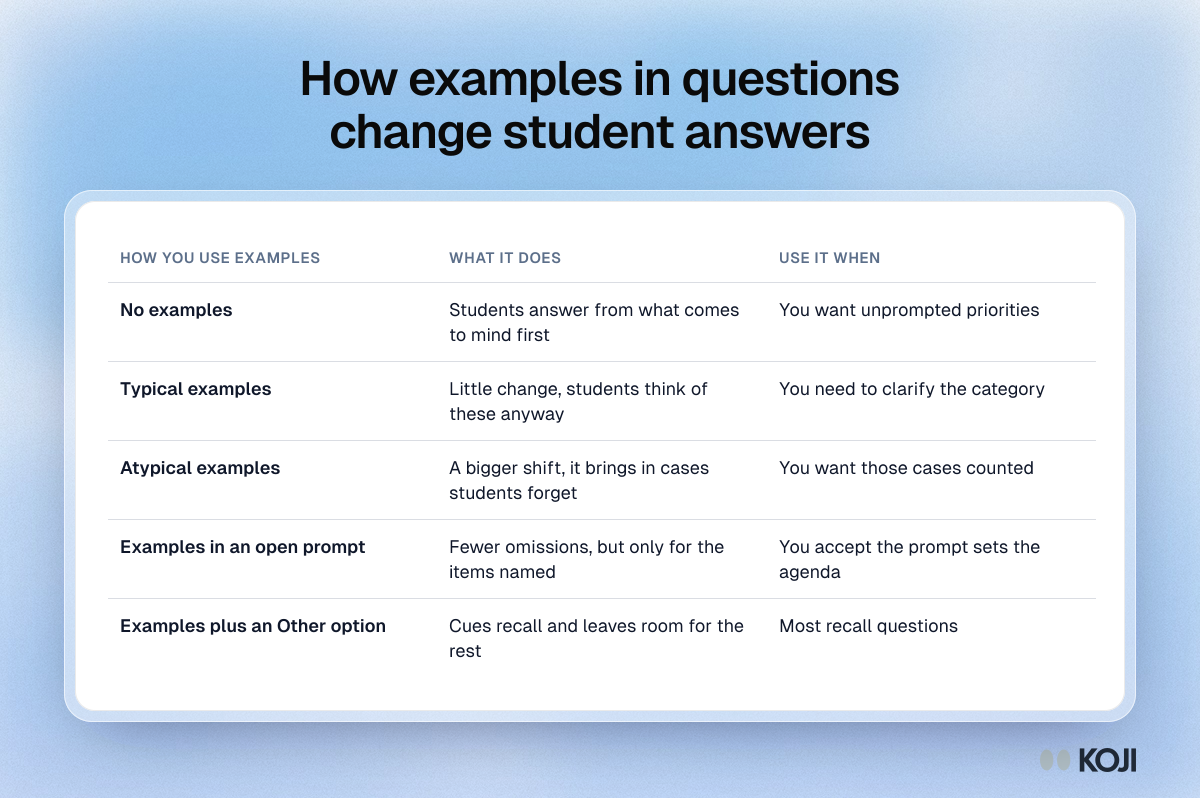
Table showing what each way of using examples in a course evaluation question does to student answers, from no examples to atypical examples.

Reference table

How examples in questions change student answers
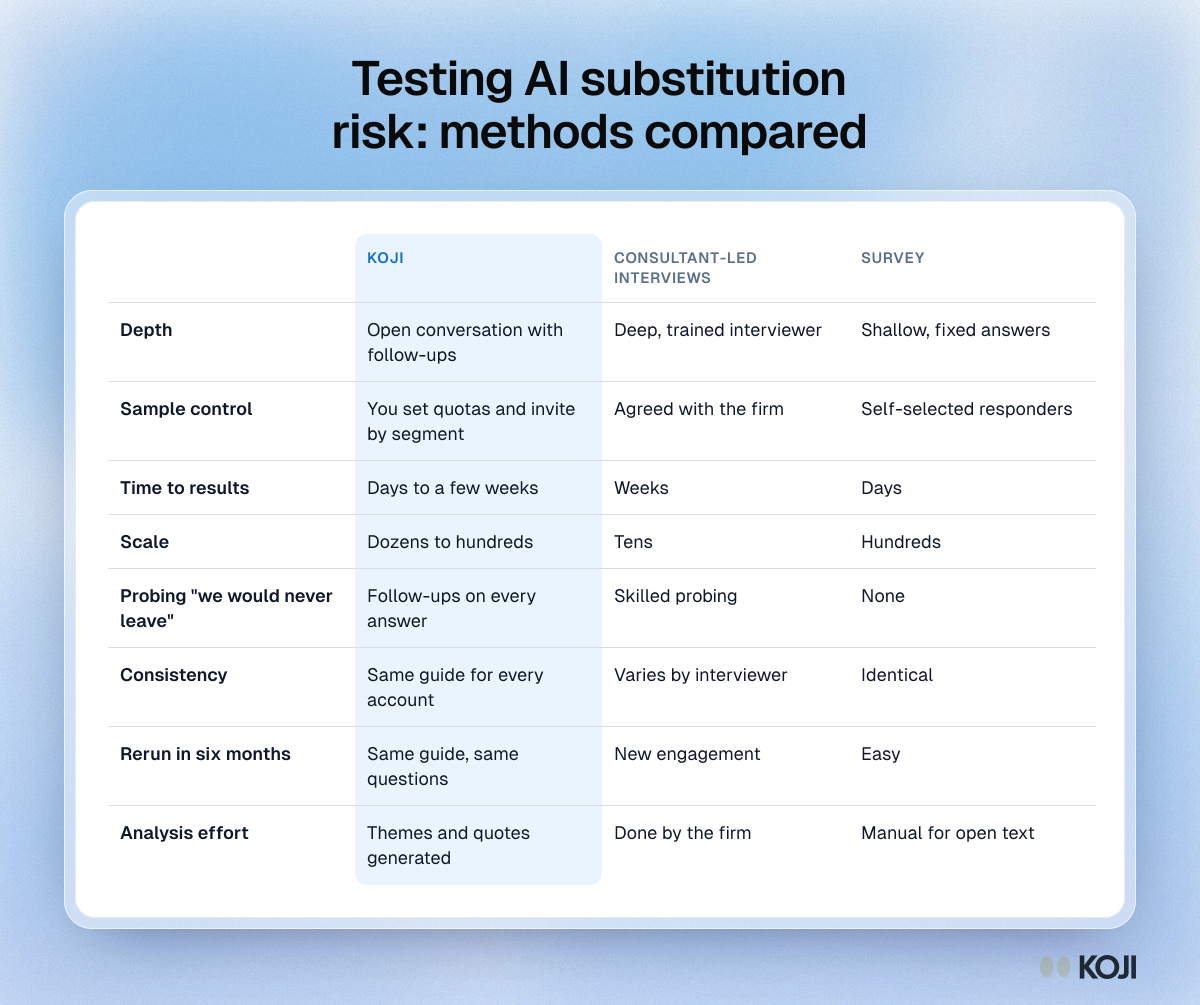
Table comparing Koji, consultant-led interviews and surveys for testing AI substitution risk, on depth, sample control, speed, scale and rerun.

Reference table

Testing AI substitution risk: methods compared
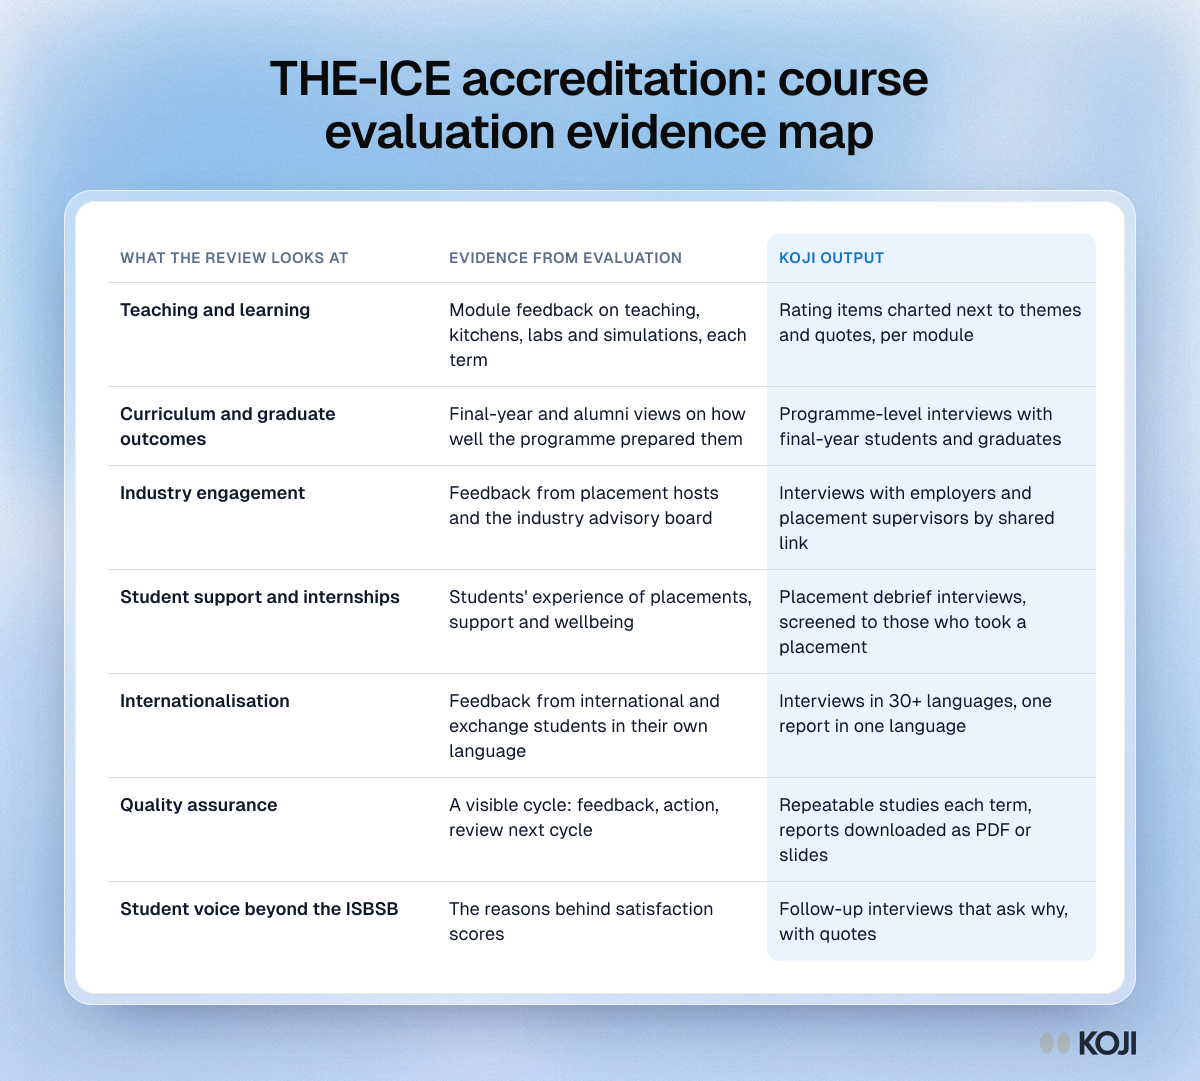
Table mapping each area a THE-ICE accreditation review looks at to course evaluation evidence and the matching Koji output

Reference table

THE-ICE accreditation: course evaluation evidence map
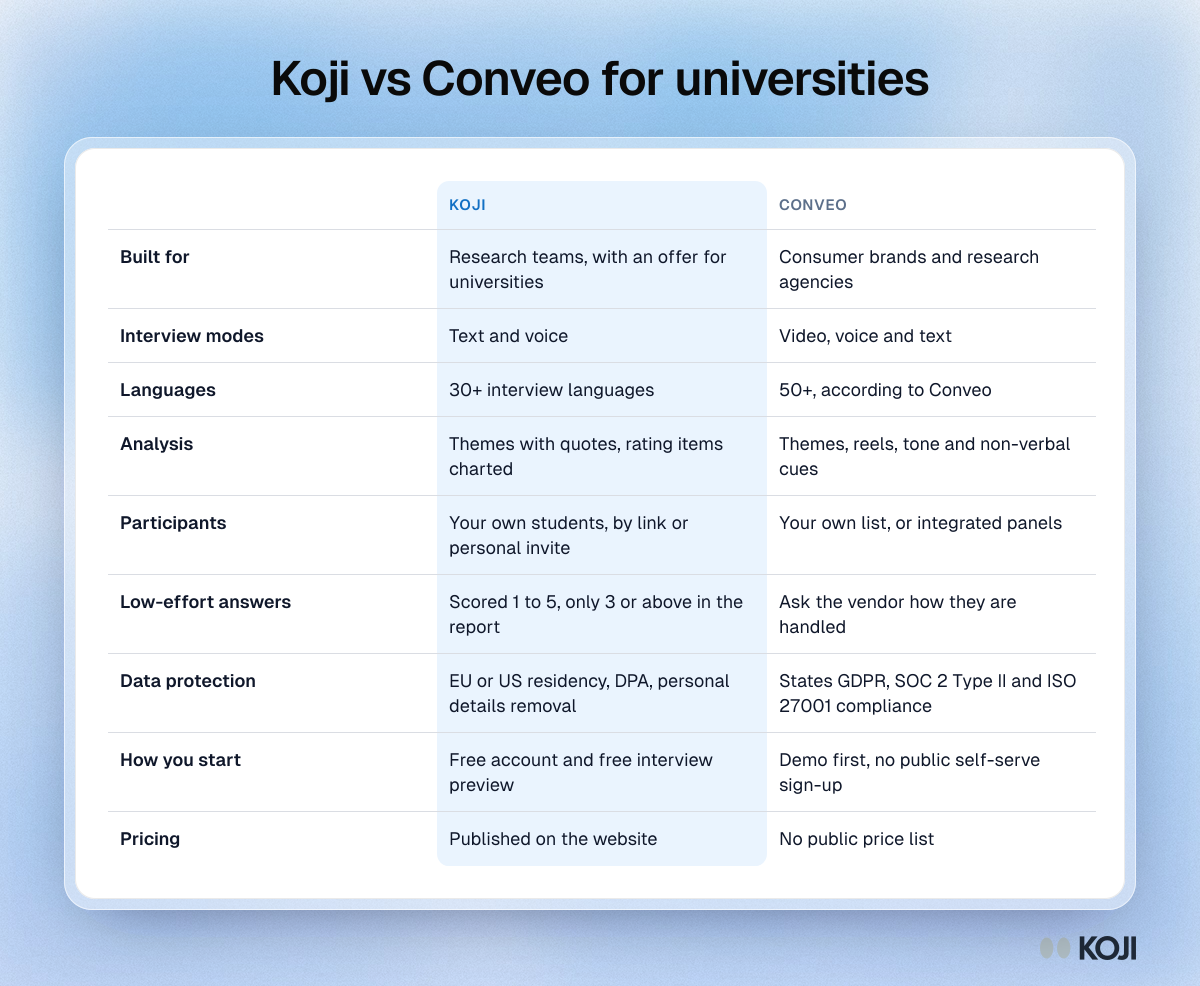
Table comparing Koji and Conveo for university feedback: interview modes, languages, analysis, participants, quality checks, data protection and pricing

Reference table

Koji vs Conveo for universities
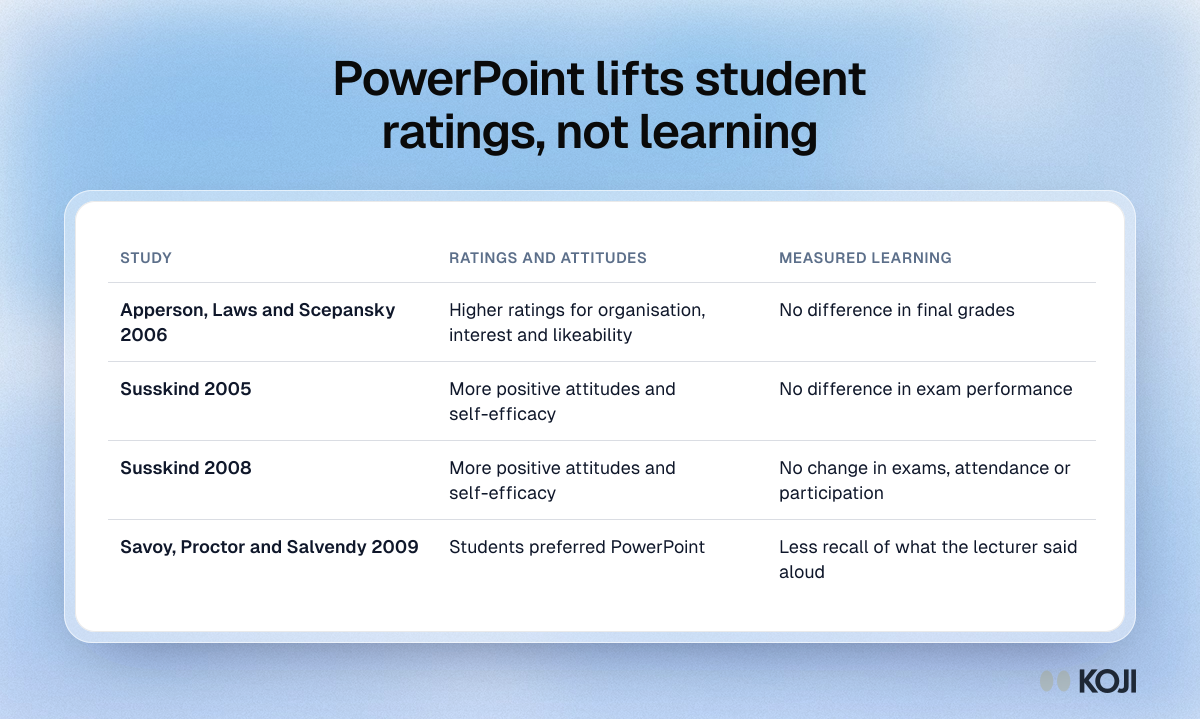
Table of four PowerPoint studies in university teaching: student ratings and attitudes rose with slides, while measured learning did not.

Reference table

PowerPoint lifts student ratings, not learning
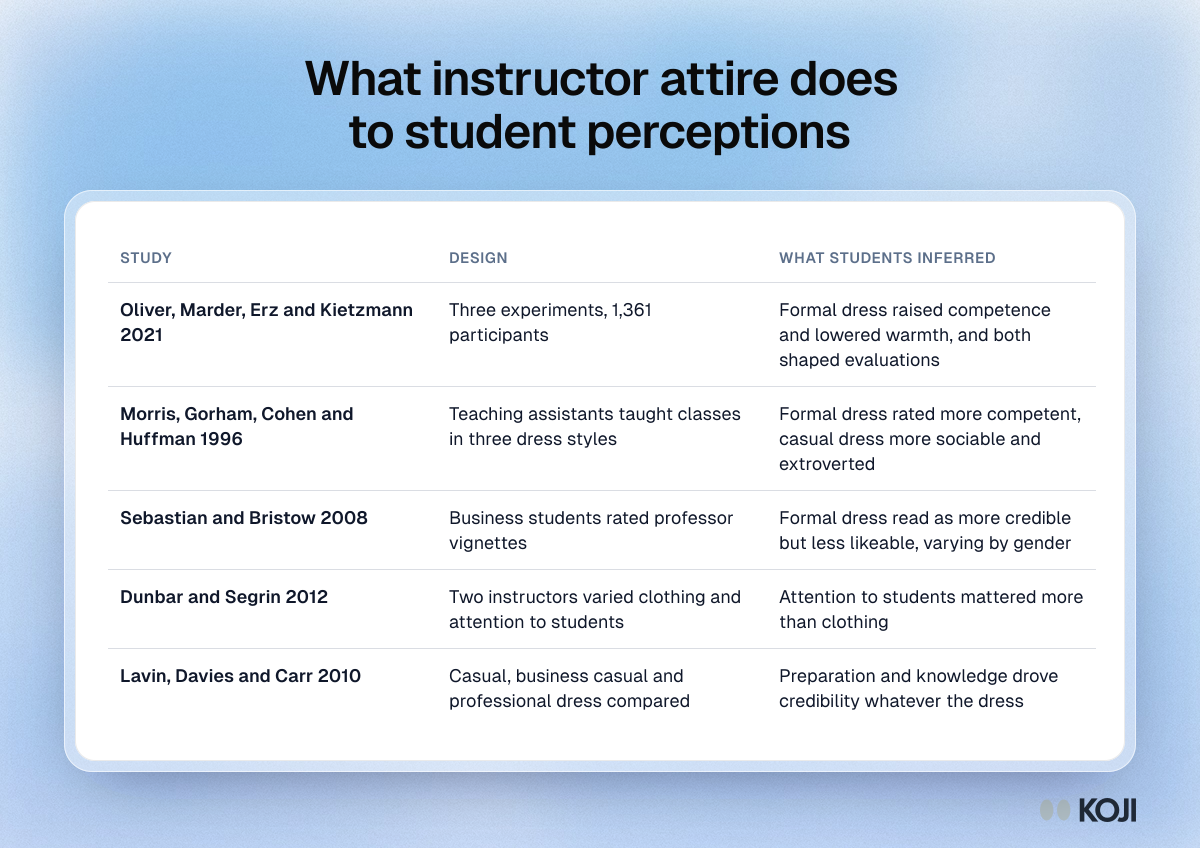
Table comparing five studies on instructor attire and student perceptions, showing each study's design and what students inferred from formal and casual dress.

Reference table

What instructor attire does to student perceptions
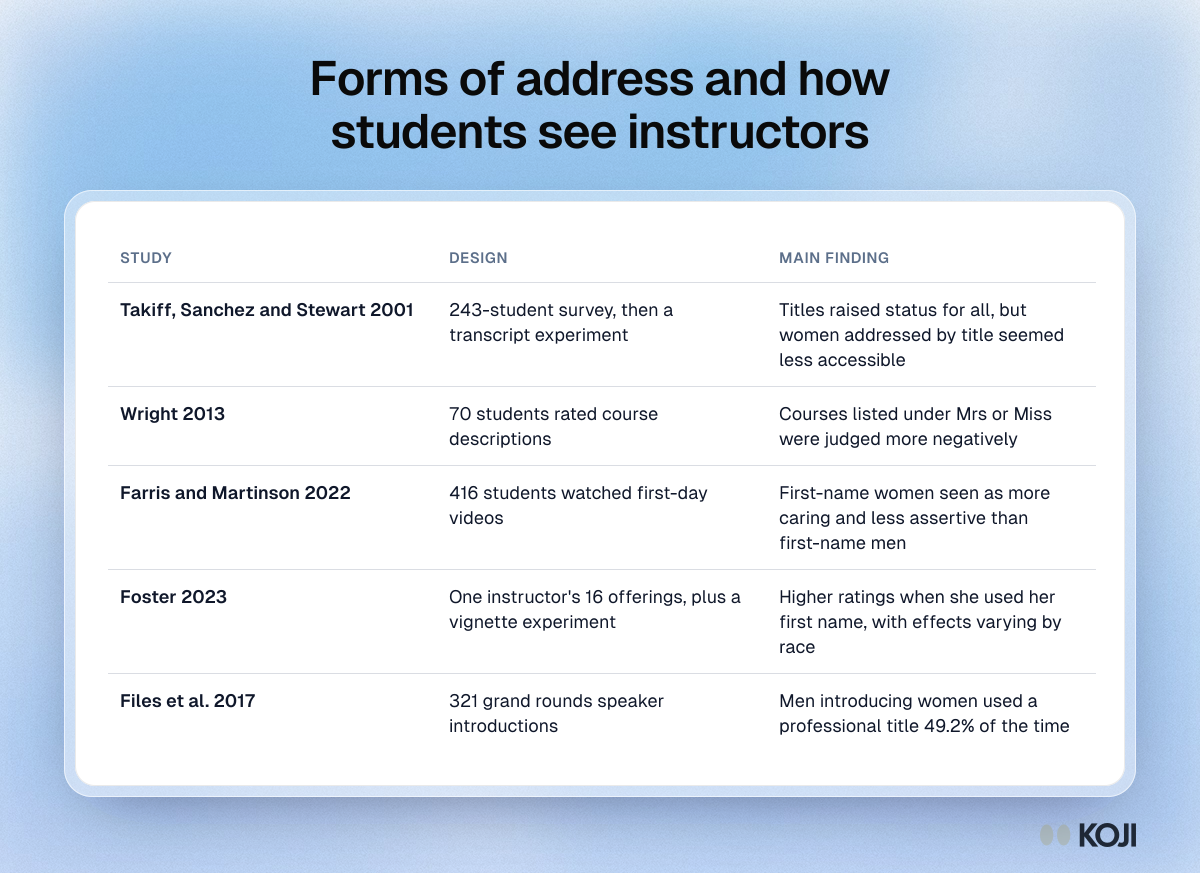
Table comparing five studies on forms of address and how students and colleagues perceive instructors, with each study's design and main finding.

Reference table

Forms of address and how students see instructors
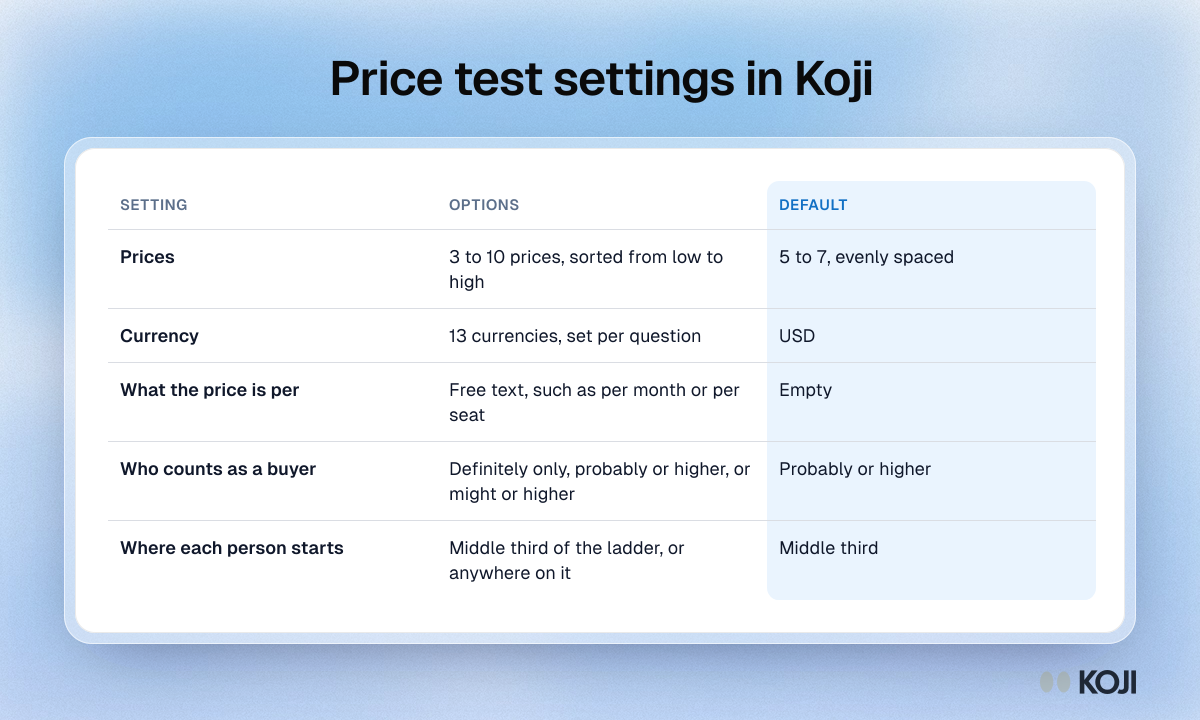
Table of the five Koji price test settings: prices, currency, unit, who counts as a buyer and starting point, with the options and default for each.

Reference table

Price test settings in Koji